. 2024 Dec;636(8043):681-689.
doi: 10.1038/s41586-024-08162-w. Epub 2024 Nov 6.

Central pattern generator control of a vertebrate ultradian sleep rhythm

Affiliations

Central pattern generator control of a vertebrate ultradian sleep rhythm

Lorenz A Fenk et al. Nature. 2024 Dec.

Abstract

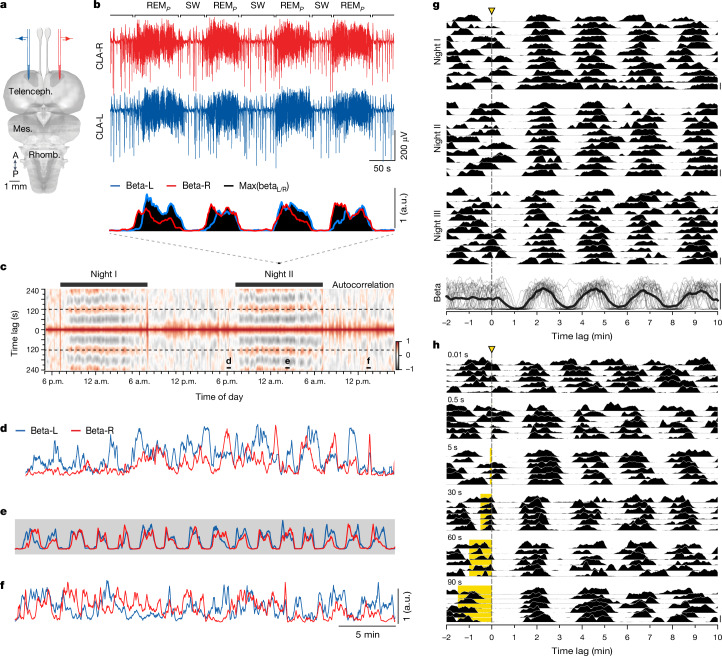
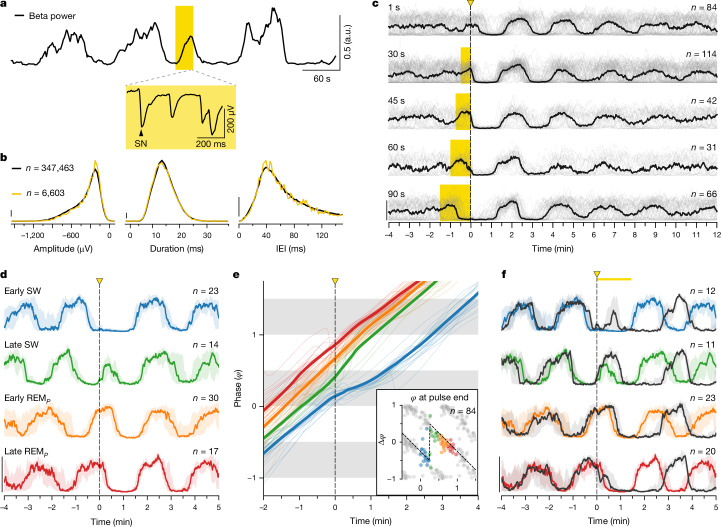
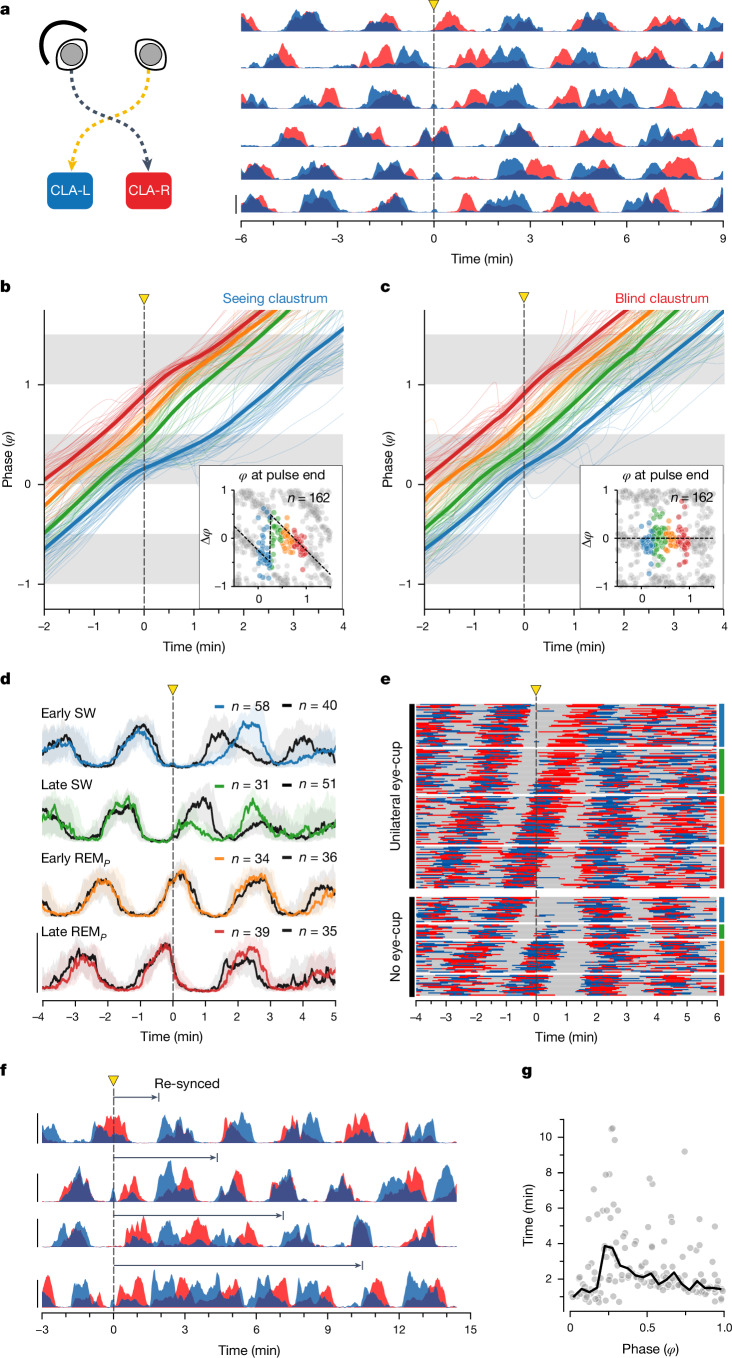
The mechanisms underlying the mammalian ultradian sleep rhythm-the alternation of rapid-eye-movement (REM) and slow-wave (SW) states-are not well understood but probably depend, at least in part, on circuits in the brainstem1-6. Here, we use perturbation experiments to probe this ultradian rhythm in sleeping lizards (Pogona vitticeps)7-9 and test the hypothesis that it originates in a central pattern generator10,11-circuits that are typically susceptible to phase-dependent reset and entrainment by external stimuli12. Using light pulses, we find that Pogona's ultradian rhythm8 can be reset in a phase-dependent manner, with a critical transition from phase delay to phase advance in the middle of SW. The ultradian rhythm frequency can be decreased or increased, within limits, by entrainment with light pulses. During entrainment, Pogona REM (REMP) can be shortened but not lengthened, whereas SW can be dilated more flexibly. In awake animals, a few alternating light/dark epochs matching natural REMP and SW durations entrain a sleep-like brain rhythm, suggesting the transient activation of an ultradian rhythm generator. In sleeping animals, a light pulse delivered to a single eye causes an immediate ultradian rhythm reset, but only of the contralateral hemisphere; both sides resynchronize spontaneously, indicating that sleep is controlled by paired rhythm-generating circuits linked by functional excitation. Our results indicate that central pattern generators of a type usually known to control motor rhythms may also organize the ultradian sleep rhythm in a vertebrate.


Conflict of interest statement

Competing interests: The authors declare no competing interests.

Figures

Fig. 1
Fig. 1. Pogona’s ultradian sleep rhythm is reset by light pulses.
a, Schematic of the Pogona brain with electrodes in the claustra. b, Top two traces, LFP from both claustra (left, CLA-L and right, CLA-R) in the middle of the night, with four REMP bouts, interspersed with SW (containing SWRs). Bottom, scrolling power in the beta band in each claustrum, and their maximum (max; black). Note dominance switches during REMP (ref. ). c, Scrolling autocorrelation of the max power of the LFP in the beta band, revealing ultradian rhythm (approximately 2 min period, stippled lines), for about 8 h each night. df, Half-hour segments from c, showing the temporal variations of beta power in each claustrum. Note regularity in e (shading indicates lights off). Full 24 h recordings from three animals are shown in Extended Data Fig. 1. g, Single 1 s light pulses (stippled line) delivered to the closed eyes of one sleeping animal over three nights reset its ultradian rhythm, estimated from variations of beta band max power, as in b. Trials every 30 min over three nights. Because light delivery is not locked to the ultradian rhythm, average beta power (bottom trace, black) oscillates only after pulse delivery, reflecting the reset. Waning of the averaged oscillation indicates noise in the ultradian rhythm frequency: after 30 min, a new light pulse is not locked to the rhythm, ensuring that sampled phases are distributed randomly. h, Effects of light-pulse duration (10 ms to 90 s). A 10 ms pulse causes a reset, but with low reliability. Long pulses (30 s and above) often trigger a REMP episode that ends with the light pulse. Pulses longer than a normal REMP cycle fail to lengthen REMP (90 s) beyond its natural duration, yet the start of a new REMP cycle is aligned to the offset of the light pulse. Pulses aligned at offset; six nights, five animals. A, anterior; P, posterior; a.u., arbitrary units; Telenceph., telencephalon; Mes., mesencephalon; Rhomb., rhombencephalon.
Fig. 2
Fig. 2. Reset of the ultradian rhythm is phase dependent.
a, A light pulse occurring near the middle of an on-going SW triggers an early episode of REMP, characterized by SNs (inset) and a concomitant increase in beta power. b, SNs evoked by a light pulse (yellow) are identical in amplitude, duration and inter-event interval (IEI) to those during normal REMP (black). c, With sustained light pulses, reset is aligned to pulse offset. With pulses 60-s-long and over, the light-triggered REMP cycle ends when it reaches its normal duration, that is, before the end of the light pulse. Ordinate, power in beta band; grey, individual trials; black, medians; 14 animals. d, Beta power (medians) for trials grouped by phase of light pulse onset (1-s-long pulse). Shading indicates IQR; four animals; n indicates trial number. A pulse in early SW causes a delay (blue). A pulse in later SW causes an early (and rapidly aborted) REMP (green). e, Phase response analysis of single (thin) and average (thick) trials in d. Main, unrolled phase (in y) of beta power relative to light onset (t = 0). Note divergent inflexions of blue and green curves at t = 0. Inset, phase response curve for the four groups of trials. Grey dots are mirrored data. Note sharp switch from delay (negative Δφ, blue) to advance (positive, green) when pulse moves from early to late SW (stippled line). f, Same as d, but including trials with 90 s light pulses (dark grey); three animals. Note similar effects, but with a reset delayed by 90 s. Coloured traces as in d, for comparison.
Fig. 3
Fig. 3. Sleep’s ultradian rhythm can be entrained by trains of light pulses.
a, Sliding autocorrelation of beta power (REMP). Pearson’s correlation, for five inter-pulse intervals (IPIs, 80–240 s). Triangles, 1 s light pulses. Beta power at top. Natural cycle period for this animal, 135 s. Entrainment occurred (horizontal bands) with IPIs of 100, 160 and 180 s, but failed with shorter and longer IPIs. b, Distributions of pulse phase during entrainment. Scale bar, density of 1. 81–131 pulses per IPI. Narrow distributions indicate phase-locking and good entrainment (120–200 s IPIs). c, Locking precision varies with IPI, with a peak around 160–180 s, hence slightly longer than the natural period. t = 0, time of light pulse. Cyan, circular means. d, Circles, autocorrelation of beta power (y) at lag corresponding to the imposed IPI (x). Line joins means. Correlation drops for short and long IPIs, as in a. Diamonds, statistics of spontaneous sleep rhythm in the 25 min preceding each pulse train. In x, autocorrelation period; in y, autocorrelation values. Stippled lines, mean x and y for baseline measurements. e, Relationship between IPI and median REMP duration. Black lines indicate mean and s.d. Diamonds, median REMP duration (y) in the 25 min preceding one pulse train (x). REMP duration does not increase beyond its spontaneous value for IPIs where entrainment occurs. NS, not significantly different from distribution of baseline sleep values (diamonds). *P < 0.1; **P < 0.05. Two-sided paired t-tests (statistics in Extended Data Table 1). f, Same as e for SW duration. SW duration increases as IPI increases, up to IPIs where entrainment fails (≥220 s). Values above 140 s (80 s IPI, see EDF4a) are clipped. *, **, as in e; ***P < 0.001. Data shown in bf are from 4 animals (12 nights). Two-sided paired t-tests (statistics in Extended Data Table 1).
Fig. 4
Fig. 4. A sleep-like rhythm can be entrained in awake animals.
a, Light off (grey) caused switch from SNs (i) to SWRs (ii, iii) and delayed eye closure (iii). After 60–80 s, SNs return, even though animal is awake, in the dark with eyes closed (iv). LFP 0.25–100 Hz band-pass. b, SWRs and SNs evoked in awake animals are identical to those in sleep. First and third panels: single traces from a. Second and fourth panels: blue, median and IQR of SWRs (n = 100) and SNs (n = 100) during awake entrainment; black, same during sleep (same animal). c, After 9–13 alternating dark/light, each 60 s (9 shown), light is left off. Beta power returns when light is expected (stippled yellow line). Black, median of 15 trials; 8 animals. d, Same as c, with 90 s period for one animal. From bottom, claustral LFP; beta power; CLA units and instantaneous rate; REMP-like activity occurs when light should have returned. e, End of awake entrainment regime with four periods (30–80 s, one animal); whereas entrainment occurs with all four periods, beta activity does not return spontaneously after less than 60 s. f, Entrained activity in darkness does not depend on eye opening. Beta power in L and R claustra, and contralateral eyelid distance (lines); entrained beta bursts begin before eyes open, briefly if at all. g, Awake entrainment (four animals, five days) showing, from bottom, distance between eyelids (green, median; grey, trials), eye openings (thresholded eyelid distance), beta power (black, median; grey, trials) and last two pulses of light entrainment. Note late eye openings relative to entrained beta (at t = around 1.5 min). Numbers of experiments, 3 30 s pulses in 2 animals; 3 45 s pulses in 3 animals; 15 60 s pulses in 8 animals; 1 70 s pulse in 1 animal; 1 80 s pulse in 1 animal; 5 90 s pulses in 4 animals.
Fig. 5
Fig. 5. Reset is unilateral if light affects a single eye.
a, Sleeping animal, both eyes closed, one eye (L in schematic) occluded with a cover. Individual trials with 1 s pulses delivered at random phases of the ultradian rhythm. Only claustrum contralateral to the seeing side (blue) experiences a reset. Both sides resynchronize after a few cycles (eg). b, Unrolled phase of beta for ‘seeing’ claustrum. Single (thin) and mean (thick) trials grouped by phase of light pulse (blue, early SW; green, late SW; orange and red, REMP). Responses as in binocular reset (Fig. 2e); four animals. Inset, phase response curve. c, Same as b for ‘blind’ side shows no phase reset. d, Overlay of the responses of the two sides (n = 162 trials) to a 1-s-long light pulse: black, beta power from ‘blind’ claustrum; colours, beta power from seeing claustrum grouped by phase of light pulse, as in Fig. 2d. Medians and IQR. e, Comparison of effect of light pulse with (top, n = 162) and without (bottom, n = 84) unilateral eye cup. Trials grouped by phase of light pulse (colour groups as in d). Grey indicates SW (low beta power). Red (right, blind claustrum) and blue (left, seeing claustrum) lines represent REMP in dominant claustrum (that with greatest beta power) at any time. Note that blind side (red) experiences no reset in unilateral eye-cup trials (top). Reset is visible as interruption of central REMP diagonal on trials with no eye-cup (bottom). f, Although only the seeing side (blue) experiences immediate reset, the two sides re-sync after one to four sleep cycles. g, Time of bilateral re-syncing (y) against phase of light pulse. Longest delays around φ = 0.25 (SW midpoint). Black, rolling median. From 162 1-s-long pulses; 13 nights, 4 animals.
Extended Data Fig. 1
Extended Data Fig. 1. Further characterization of the ultradian rhythm in Pogona.
a, Three 24h-recordings from three different animals (I-III). Each line plots the power of the LFP recorded in the left (blue) and right (red) claustra, in the 12–30 Hz band. For each animal and day, the recordings and plots run from line to line without interruption. Each line represents 3 h. Grey shading: night time (~7 pm to 7am). The insets at right represent the autocorrelogram of the merged (max values, see methods) beta power (time runs down along y, time lag in x), demonstrating the ultradian rhythm with a period of about 120 s. b, Statistics of the ultradian rhythm over 27 nights. The two vertical stippled lines represent the times at which the ambient lights went on and off and serve to align all the recordings. The 2 central hours are clipped to emphasize entry into and exit from the sleep state. Top trace: time lag of peak correlation, corresponding to the period of the ultradian rhythm. This shows that the period typically increases slightly over each night. Bottom trace: shows that the periodicity stabilizes about an hour after dark, and decreases slowly over the last 3 h of the night. Median and 5th to 95th percentile (shading). c, Autocorrelogram as in a (rotated by 90 degrees) from 8 pm to 10am the next day, showing the ultradian rhythm in an animal held overnight in constant light. This animal is entrained to a normal 12 h light − 12 h dark circadian rhythm and is kept in constant light only during the night of the recording. Note that this animal entered the normal rhythm about an hour later than is typical in darkness, but once asleep, displays the characteristics of the normal ultradian rhythm (about 120 s period, increasing slightly overnight, end before predicted or entrained light-on time).
Extended Data Fig. 2
Extended Data Fig. 2. Sleep-cycle statistics.
Statistics are calculated from the core 8 h of sleep (~8 pm to 4 am) across 23 animals and 43 nights. a, Full night statistics. Top and middle: Total amount of time in REMp and SW sleep. Bottom: Total number of cycles. We observed a small increase in total REM during experimental nights with light pulses (typically 11 or 12 pulses per night), with values remaining within the range of non-stimulated sleep. Mann–Whitney two-sided U-tests. b, Single-cycle statistics. From top to bottom: median duration of a single REMp episode; median duration of a single SW episode; median duration of the full cycle, calculated as one SW and consecutive REMp; duty-cycle calculated as the percent of time spent in SW per cycle. We observed a small but significant increase in REM duration in the unilateral cup experiments, within the normal range of non-stimulated sleep. Mann–Whitney two-sided U-tests. c, Single-cycle statistics across sleep time. Same as b but calculated for the first and last two hours of the core 8 h of sleep. We observed a slight increase of the cycle duration during the night, in the order of 10 s, as previously reported. n = 34 (no-stim), n = 3 (1 s pulses), and n = 6 (1 s pulses + unilat. cup) experiments for each condition. Wilcoxon signed-rank two-sided paired tests.
Extended Data Fig. 3
Extended Data Fig. 3. Ambient light pulses cause neither nuchal electromyographic (EMG) activity nor eye movement.
a, Twelve-min long excerpts of rectified and integrated EMGs (iEMG, see methods) from neck muscles, centered on the end of 0.1 s, 0.5 s, 1 s and 30s-long light pulses (n = 11 in all cases; shown are 4 different nights from one animal). Note the absence of a response to light during sleep, and compare sleep EMG to that recorded in the same animal when it is awake. ***: P < 0.01. Wilcoxon signed-rank two-sided paired test of mean iEMG before and after the light pulse. From top to bottom: W = 26, P = 0.57715; W = 21, P = 0.32031; W = 18, P = 0.20605; W = 31, P = 0.89844. Mann–Whitney two-sided U-test of mean iEMG after the pulse during sleep and waking state. From top to bottom: U = 4, P = 0.00007; U = 8, P = 0.00018; U = 1, P = 0.00007; U = 0, P = 0.00003. b, Measurement of eyelid movements (left and right eyes, see methods) in response to 30 s light pulses in sleeping animals. Note absence of motion, and compare with eyelid movements in awake animals (right). Same calibration in all.
Extended Data Fig. 4
Extended Data Fig. 4. REMP sleep homeostasis.
a, Train of 1s-long light pulses delivered at a short inter-pulse interval (IPI) of 80 s. Such a short IPI fails to entrain the ultradian rhythm, and suppresses REMP for several minutes (top). Upon cessation of the stimuli, REMP resumes and occupies a larger fraction of the sleep cycle than before stimulation (bottom left, **P = 0.0078, W = 0), with longer REMP average duration (bottom middle, *P = 0.0234, W = 2) and shorter SW average duration (bottom right, *P = 0.0156, W = 1); n = 8 experiments; 25 min preceding (pre) and following (post) pulse trains were used for statistical comparison. Wilcoxon signed-rank two-sided paired tests. **: P < 0.05; *: P < 0.1. These results are consistent with a recent study reporting sleep homeostasis in Pogona. b, Same as in a but with light pulses applied at IPI = 180 s, causing reliable entrainment (see Fig. 3). This regime is accompanied by no alteration of the percentage of post-stimulation REM (bottom left, P = 0.375, W = 18), average REMP duration (bottom middle, P = 0.1602, W = 13) or average SW duration (bottom right, P = 0.4316, W = 19); n = 10 experiments. c, Two consecutive trains of 60 s and 80s-long light pulses, separated by 60 min, and each consisting of 10 pulses delivered every 60 s and 80 s, respectively. Both trains are included in the quantifications of a and indicated by red lines. Suppression of REMP during the light pulses is followed by a rebound, visible as an increase in REMP and simultaneous decrease in SW duration, slowly returning to baseline levels after stimulation (bottom panel). Open circles indicate long (>240 s) SW or REMP periods. d, Quantification of the data in c, comparing the hour preceding the first pulse train (I) with the hour following it (II), and the three hours following the second train (III-V). Left panel (from left to right): **P = 0.0060, U = 196; *P = 0.0225, U = 212.5; P = 0.0555, U = 232.5; P = 0.9361, U = 356. Right panel (from left to right): P = 0.0891, U = 447; *P = 0.0185, U = 466.5; P = 0.5270, U = 290; **P = 0.0066, U = 198. Mann–Whitney two-sided U-tests. ** and * as in a.
Extended Data Fig. 5
Extended Data Fig. 5. Pogona’s retinal projections decussate fully at the optic chiasm, enabling monocular reset experiments.
a, I-IV Transverse sections through the brain at the level of the thalamus (Th) and optic tectum (OT) after intravitreal injection of neurobiotin (red) into the right eye. The contralateral labeling suggests the complete decussation of the retinal ganglion cell axons in the optic nerve (ON). Blue = fluorescent Nissl stain.
Extended Data Fig. 6
Extended Data Fig. 6. Ambient light pulses fail to generate a reset of the ultradian rhythm when both eyes are cupped, proving that the reset by light pulses is due to retinal stimulation through closed eyelids.
a, Combined (L and R) beta power recorded over two nights in two sleeping animals. Top row shows, for each animal and over multiple trials, the light-evoked (1 s long pulses, triangles) reset when no eye cups are present; the bottom row shows the same when both eyes are cupped. Below each panel: superimposed single-trials beta power (grey) and their average (black). Note that the reset is absent in animals with bilateral eye-cups. b, Unrolled phase of claustrum beta in animals with bilateral eye-cups. Calculated from unilateral beta power, as in Fig. 5b,c. Thick (means) and thin (single trials) grouped by phase of light pulse (blue, early SW; green, late SW; orange and red, REMP). Note that responses match those of the blind claustrum in unilateral eye-cup experiments (Fig. 5c). Inset: phase-response curve is flat, indicating no phase-dependent response to the pulse. Below median and IQR of unilateral beta power grouped by phase of the light pulse.

References

    1. Hobson, J. A., McCarley, R. W. & Wyzinski, P. W. Sleep cycle oscillation: reciprocal discharge by two brainstem neuronal groups. Science189, 55–58 (1975). - PubMed
    1. McCarley, R. W. & Hobson, J. A. Neuronal excitability modulation over the sleep cycle: a structural and mathematical model. Science189, 58–60 (1975). - PubMed
    1. Jouvet, M. & Michel, F. Release of the ‘paradoxal phase’ of sleep by stimulation of the brain stem in the intact and chronic mesencephalic cat [article in French]. C R Seances Soc Biol Fil154, 636–641 (1960). - PubMed
    1. Lu, J., Sherman, D., Devor, M. & Saper, C. B. A putative flip-flop switch for control of REM sleep. Nature441, 589–594 (2006). - PubMed
    1. Weber, F. et al. Control of REM sleep by ventral medulla GABAergic neurons. Nature526, 435–438 (2015). - PMC - PubMed

LinkOut - more resources