. 2025 Jan;637(8044):145-155.
doi: 10.1038/s41586-024-08168-4. Epub 2024 Nov 6.

Offline ensemble co-reactivation links memories across days

Affiliations

Offline ensemble co-reactivation links memories across days

Yosif Zaki et al. Nature. 2025 Jan.

Abstract

Memories are encoded in neural ensembles during learning1-6 and are stabilized by post-learning reactivation7-17. Integrating recent experiences into existing memories ensures that memories contain the most recently available information, but how the brain accomplishes this critical process remains unclear. Here we show that in mice, a strong aversive experience drives offline ensemble reactivation of not only the recent aversive memory but also a neutral memory formed 2 days before, linking fear of the recent aversive memory to the previous neutral memory. Fear specifically links retrospectively, but not prospectively, to neutral memories across days. Consistent with previous studies, we find that the recent aversive memory ensemble is reactivated during the offline period after learning. However, a strong aversive experience also increases co-reactivation of the aversive and neutral memory ensembles during the offline period. Ensemble co-reactivation occurs more during wake than during sleep. Finally, the expression of fear in the neutral context is associated with reactivation of the shared ensemble between the aversive and neutral memories. Collectively, these results demonstrate that offline ensemble co-reactivation is a neural mechanism by which memories are integrated across days.


Conflict of interest statement

Competing interests: The authors declare no competing interests.

Figures

Fig. 1
Fig. 1. A strong aversive experience drives retrospective memory linking to a neutral context learned days ago.
a, Schematic of the prospective versus retrospective memory-linking behaviour experiment. b, Freezing during aversive recall. There is no difference in aversive recall freezing between the prospective (pro.) and retrospective (retro.) conditions (t34 = 0.36, P = 0.72). n = 16 (retrospective) and n = 20 (prospective) mice. c, Freezing during neutral versus novel recall. There is a significant interaction between direction (prospective versus retrospective) and context (neutral versus novel) (F1,32 = 4.90, P = 0.034). n = 8 (retrospective neutral), n = 8 (retrospective novel), n = 12 (prospective neutral) and n = 8 (prospective novel) mice. Post hoc testing: retrospective (t32 = 2.586, P = 0.029), prospective (t32 = 0.452, P = 0.6546). d, Schematic of the low-shock versus high-shock retrospective memory-linking experiment. Calcium imaging was performed during all sessions. e, Freezing during aversive recall in low- versus high-shock mice. Mice froze more in the aversive context after receiving a high shock versus low shock (t18,8 = 5.877, P = 0.000012). n = 10 (low-shock) and n = 12 (high-shock) mice. f, Freezing during neutral versus novel recall in low- versus high-shock mice. There was a significant effect of context (neutral versus novel) (F1,20 = 17.32, P = 0.000048) and a significant interaction between context and amplitude (F1,20 = 4.99, P = 0.037). n = 10 (low shock) and n = 12 (high-shock) mice. High-shock mice froze more in the neutral versus novel contexts (t11 = 4.37, P = 0.002) and low-shock mice froze no differently (t9 = 1.23, P = 0.249). g, The correlation between aversive recall freezing and memory-linking strength. Aversive memory strength was correlated with the strength of retrospective memory linking in high-shock mice (R2 = 0.45, P = 0.016), but not in low-shock mice (R2 = 0.0003, P = 0.963). n = 10 (low-shock) and n = 12 (high-shock) mice. *P ≤ 0.05, ***P< 0.001, ****P < 0.0001. Error bars indicate s.e.m.
Fig. 2
Fig. 2. Hippocampal ensembles exhibit population bursts of calcium events during offline periods.
a, Behavioural schematic of the retrospective memory-linking experimental design. The same as in Fig. 1d, but focusing here on the offline periods. b, Schematic of the lens and Miniscope placement onto the dorsal hippocampus (top left). Top right, representative histological analysis of GCaMP6f expression in the hippocampal CA1, imaged using confocal microscopy. Green, AAV1-Syn-GCaMP6f expression; blue, cellular DAPI stain. Bottom left, maximum-intensity projection of an example mouse across one recording session. Bottom right, spatial footprints of all recorded cells during the session on the left randomly colour coded. This experiment was repeated across two cohorts. Scale bars, 50 μm (top) and 200 μm (bottom). c, Example of a burst event. The top trace represents the z-scored mean population activity within one of the offline recordings. Three timepoints were chosen (overlaid in circles), the middle representing the peak of a burst event and the timepoints to its left and right representing t − 2 s and t + 2 s from the peak, respectively. The bottom three matrices represent binarized spatial footprints depicting the spatial footprints of the cells sufficiently active to participate in a burst (z > 2). The matrices represent the timepoints of the three datapoints above it, ordered by time. d, Locomotion of an example mouse during each burst event stacked along the y axis (top), and the mean locomotion around burst events (bottom). Mice showed a robust and brief slowing down around 1 s before each burst event, before increasing locomotion back up around 2 s later. e, Mouse locomotion as in d, but averaged across all of the mice. Each thin line represents one mouse, and the thick black line represents the mean across mice, with the grey ribbon around it representing the s.e.m. n = 8 mice. This demonstrates a robust and reliable decrease in locomotion around the onset of burst events. From the experiment in Extended Data Fig. 3. Error bands indicate s.e.m.
Fig. 3
Fig. 3. A strong aversive experience recruits the past neutral ensemble into offline population bursts.
a, Example offline 1 burst event (left). Each row represents the activity of a neuron, colour coded by ensemble (blue, neutral; white, remaining). The top black trace represents the z-scored mean population activity. Right, example non-burst event. b, The same as in a but for offline 2 (red, aversive; purple, overlap; blue, neutral; white, remaining). c, During offline 1 in the low- and high-shock groups, a greater percentage of the neutral ensemble participated in bursts than the remaining ensemble (ensemble: F1,13 = 16.33, P = 0.001; amplitude: F1,13 = 0.009, P = 0.925; ensemble × amplitude: F1,13 = 0.0058, P = 0.940). n = 7 (low-shock) and n = 8 (high-shock) mice. d, During offline 2 in the low- and high-shock groups, a greater percentage of the aversive ensemble participated in bursts than the remaining ensemble (ensemble: F1,13 = 13.57, P = 0.0028; amplitude: F1,13 = 0.000078, P = 0.99; ensemble × amplitude: F1,13 = 0.16, P = 0.69). n = 7 (low-shock) and n = 8 (high-shock) mice. e, During offline 2 in the low- and high-shock groups, a greater percentage of the overlap ensemble participated in bursts than the remaining ensemble (ensemble: F1,13 = 13.95, P = 0.0025; amplitude: F1,13 = 0.014, P = 0.91; ensemble × amplitude: F1,13 = 0.31, P = 0.58). n = 7 (low-shock) and n = 8 (high-shock) mice. f, During offline 2, neutral and remaining ensembles differentially participated in bursts in the high- and low-shock groups (ensemble × amplitude: F1,13 = 5.186, P = 0.040). High-shock mice showed higher neutral ensemble participation relative to the remaining ensemble (t7 = 4.88, P = 0.0036), low-shock mice showed no difference in ensemble participation (t6 = 1.33, P = 0.23). n = 7 (low-shock) and n = 8 (high-shock) mice. **P < 0.01. Error bars indicate s.e.m.
Fig. 4
Fig. 4. A strong aversive experience drives co-bursting of the overlap ensemble with the neural ensemble.
a, Representation of the quantification of independent ensemble participation during burst versus non-burst periods. b, During burst periods, the overlap ensemble participated independently in more bursts than the aversive ensemble (t14 = 7.95, P = 0.000002) and more than the neutral ensemble (t14 = 5.59, P = 0.0001) but there was no difference in participation across low- versus high-shock mice (F1,13 = 1.43, P = 0.25) and no interaction (F2,26 = 2.49, P = 0.10). n = 7 (low-shock) and n = 8 (high-shock) mice. c, During non-burst periods, there was no difference in participation across ensembles (F2,26 = 0.38, P = 0.69) or between low- and high-shock mice (F1,13 = 0.73, P = 0.41), and no interaction (F2,26 = 0.36, P = 0.70). n = 7 (low-shock) and n = 8 (high-shock) mice. d, Representation of the quantification of ensemble co-participation during burst versus non-bursting periods. e, During burst periods, there was a significant interaction between ensemble combination and low- versus high-shock (F1,13 = 12.2, P = 0.004). Overlap ensemble preferentially co-participated with the neutral ensemble (N) rather than with the aversive ensemble (A) (t7 = 4.95, P = 0.003), whereas in the low-shock group, there was no difference in overlap ensemble participation with the neutral and aversive ensembles (t6 = 0.99, P = 0.36). n = 7 (low-shock) and n = 8 (high-shock) mice. f, During non-burst periods, there was no difference in co-participation between ensembles (F1,13 = 0.027, P = 0.87) or between low- and high-shock (F1,13 = 0.11, P = 0.74), and there was no interaction (F1,13 = 1.11, P = 0.31). n = 7 (low-shock) and n = 8 (high-shock) mice. Error bars indicate s.e.m.
Fig. 5
Fig. 5. Co-reactivation between the overlap and neutral ensembles occurs during more wake than during sleep.
a, Schematic of the GRIN lens and electrode implants used for this experiment (left). Mice were injected with AAV1-Syn-GCaMP6f in the dorsal CA1. Then, 2 weeks later, the mice were implanted with a lens above the injection site, with two EEG electrodes and two EMG electrodes. Next, 2 weeks after this, the mice were implanted with a baseplate for Miniscope calcium imaging. Middle, maximum-intensity projection of an example mouse across one recording session, imaged using a Miniscope. Right, the spatial footprints of all recorded cells during that session, randomly colour coded. Each mouse was run one at a time for this experiment. Scale bars, 200 μm. b, Example of 24 concatenated calcium imaging offline sessions. Top, the sleep state across all the calcium imaging recordings. Bottom, the whole-population mean activity, the aversive ensemble mean activity, the overlap ensemble mean activity and the neural ensemble mean activity. The dotted grey lines represent the boundaries between each offline recording. c, Ensemble co-bursting across sleep states. Left, wake high-shock mice had higher co-bursting of overlap × neutral than overlap × aversive (t4 = 4.94, P = 0.016) while low-shock mice had no difference in co-bursting between these ensembles (t3 = 1.20, P = 0.32). Middle, for NREM, there was no difference in high-shock (t4 = 0.53, P = 0.66) or low-shock (t3 = −0.49, P = 0.66) co-bursting. Right, for REM, there was no difference in high-shock (t4 = 1.04, P = 0.63) or low-shock (t3 = −0.53, P = 0.63) co-bursting. n = 4 (low-shock) and n = 5 (high-shock) mice. Error bars indicate s.e.m.
Fig. 6
Fig. 6. A strong aversive experience drives ensemble co-reactivation during neutral context recall.
a, Ensemble reactivation during neutral versus novel recall. The reactivation index was computed as the difference in ensemble overlap between the neutral versus novel contexts (that is, reactivation during neutral − reactivation during novel; Methods) (ensemble overlap percentages are shown in Extended Data Fig. 4q–s). Left, there was no difference between the low- and high-shock groups in the reactivation index of the neutral ensemble (t12 = 0.42, P = 0.68). Middle, there was no difference in the aversive ensemble (t12 = 0.38, P = 0.71). Right, there was a significant difference in the overlap ensemble (t12 = 3.2, P = 0.007). b, In high-shock mice, population activity patterns in the neutral context changed significantly from neutral encoding to neutral recall (amplitude: F1,12 = 5.65; session pair: F1,12 = 10.42; amplitude × session pair: F1,12 = 6.22). During neutral recall in high-shock mice, population activity vectors were less correlated with the average neutral encoding population vector than aversive recall activity was with the average aversive encoding population vector (t7 = 4.10, P = 0.009). Neutral encoding-to-recall correlations were also lower in high- versus low-shock mice (t6,92 = 2.98, P = 0.042). Aversive encoding-to-recall correlations were no different in the high- versus low-shock mice (t6,11 = 1.13, P = 0.30). In low-shock mice, neutral and aversive encoding-to-recall correlations were no different (t5 = 0.23, P = 0.83). n = 6 (low-shock) and n = 8 (high-shock) mice. c, Single experiences are encoded by neurons that are highly active during learning. During the offline period after a strong aversive experience, not only is the aversive ensemble reactivated to consolidate that memory, but a past neutral memory ensemble is also reactivated, linking the aversive and neutral memories. During recall of the neutral memory, the linked memory ensemble is reactivated to drive fear in the neutral context. Error bars indicate s.e.m.
Extended Data Fig. 1
Extended Data Fig. 1. Behavioural experiment controls.
A) Schematic to test the temporal window of prospective memory-linking (top). Mice underwent Aversive encoding and then either 5 h, 1d, or 2d later they underwent Neutral encoding. The following day, mice were tested in the previously experienced Neutral context. Mice froze significantly more in the Neutral context when the Neutral context occurred within 5 h of the Aversive context, compared to when it occurred one day or more after Aversive encoding (bottom). Main effect of timepoint (F2,24 = 3.689, p = 0.04) (5h, n = 10 mice; 1d, n = 9 mice; 2d, n = 8 mice). Post-hoc tests revealed a trend for higher freezing in the 5 h timepoint compared to the 1d or 2d timepoints: 1d (t16.38 = 2.137, p = 0.07), 2d (t13.45 = 2.38, p = 0.07). B) Schematic to test the temporal window of retrospective memory-linking (top). Mice underwent Neutral encoding, followed by Aversive encoding in a separate context 5 h, 1d, or 2d later. The day following Aversive encoding, they were tested in the previously experienced Neutral context. Mice froze no differently in the Neutral context regardless of how long before Aversive encoding the Neutral context was experienced (bottom). No main effect of timepoint (F2,27 = 0.73, p = 0.49) (5h, n = 10 mice; 1d, n = 10 mice; 2d, n = 10 mice). C) Schematic of low- vs high-shock retrospective memory-linking experiment (without calcium imaging as a replication – biological replicate). Mice underwent Neutral encoding followed by a low- or high-shock Aversive encoding two days later. In the subsequent 3 days, mice were tested in the Aversive context, and then Neutral and Novel contexts, counterbalanced. D) Mice froze more in the Aversive context in high-shock vs low-shock mice (t14 = 5.04, p = 0.00018) (low-shock, n = 8 mice; high-shock, n = 8 mice). E) High-shock mice exhibited higher freezing in Neutral vs Novel recall, while low-shock mice did not. A priori post-hoc test: high-shock (t7 = 2.65, p = 0.033), low-shock (t7 = 1.21, p = 0.133) (low-shock, n = 8 mice; high-shock, n = 8 mice). F) Schematic of temporal window retrospective memory-linking experiment to test whether memory-linking occurs at longer temporal windows. Mice underwent Neutral encoding followed by high-shock Aversive encoding two days later or seven days later. In the subsequent days, mice were tested in the Aversive context, and then Neutral and Novel contexts, counterbalanced. G) Mice froze no differently in the Aversive context in 2-day vs 7-day mice (t28.81 = 0.72, p = 0.47) (2-day, n = 16 mice; 7-day, n = 15 mice). H) Mice in both 2-day and 7-day groups showed higher freezing in Neutral vs Novel recall (F1,29 = 63.06, p = 9e-9). There was no difference in freezing in 2-day vs 7-day mice (F1,29 = 0.16, p = 0.69) and no interaction (F1,29 = 0.60, p = 0.45) (2-day, n = 16 mice; 7-day, n = 15 mice). I) Schematic to test whether the order of Aversive Recall affects retrospective memory-linking. Mice underwent Neutral encoding followed by high-shock Aversive encoding two days later. In the subsequent three days, mice were tested either in the Aversive context followed by Neutral and Novel, counterbalanced (Aversive First); or, mice were tested in Neutral and Novel, counterbalanced, followed by the Aversive context (Aversive Last). J) Mice froze no differently in the Aversive context if Aversive Recall came first or last (t46 = 0.72, p = 0.48). K) Mice in both groups (Aversive First and Aversive Last) showed higher freezing in Neutral vs Novel recall (F1,46 = 38.15, p = 1.6e-7). There was no difference in freezing in Aversive First vs Aversive Last groups (F1,46 = 0.19, p = 0.66) and no interaction (F1,46 = 0.14, p = 0.71). L) Representative histological verification of viral expression in dorsal and ventral hippocampus. Blue represents DAPI and green represents AAV5-Syn-PSAM-GFP. M) Schematic of the behavioural experiment disrupting hippocampal activity during the offline period. Mice were injected with AAV5-Syn-PSAM-GFP into dorsal and ventral hippocampus. Mice all had a Neutral experience and two days later a strong Aversive experience. Right after Aversive encoding, mice either had the hippocampus inactivated for 12hrs using the PSAM agonist, PSEM, or were given saline as a control. To do this, mice were injected four times, every three hours, to extend the manipulation across a 12-hour period. Two days later, mice were tested in the Neutral or a Novel context for freezing. N) Control (saline-treated) mice displayed retrospective memory-linking (i.e., higher freezing during Neutral vs Novel recall), while mice that received hippocampal inhibition (PSEM-treated) no longer displayed retrospective memory-linking. Significant interaction between Experimental Group (PSEM vs Sal) and Context (Neutral vs Novel) (F1,42 = 4.00, p = 0.05) (Saline Neutral, n = 12 mice; Saline Novel, n = 10 mice; PSEM Neutral, n = 12 mice; PSEM Novel, n = 12 mice). Post-hoc tests demonstrate higher freezing in Neutral vs Novel contexts in the Sal group (t19.84 = 2.57, p = 0.03) and no difference in freezing in Neutral vs Novel contexts in the PSEM group (t22 = 0.31, p = 0.76). O) Schematic of the behavioural experiment as above, but this time to test the effects of hippocampal inactivation on Aversive memory recall. Mice all underwent the Neutral and Aversive experiences as before, as well as PSEM or saline injections following Aversive encoding (as in Extended Data Fig. 1m); however, two days following Aversive encoding, mice were tested in the Aversive context to test for an intact aversive memory. P) Mice froze no differently in the Aversive context whether they had received hippocampal inhibition or not (t13.9 = 0.32, p = 0.748) (Saline, n = 7 mice; PSEM, n = 9 mice).
Extended Data Fig. 2
Extended Data Fig. 2. Retrospective memory-linking with an appetitive contextual memory.
A) Schematic of behavioural experiment to test whether cocaine-context pairing leads to a measurable conditioned response in the conditioned context. Mice were administered cocaine or saline immediately prior to exposure to a novel context. The following day, they were returned to the conditioned context off-drug for recall. B) Mice that received cocaine locomoted significantly more than saline controls during encoding (t18 = 5.07, p = 0.00008) (Cocaine, n = 9 mice; Saline, n = 9 mice). C) Mice that received cocaine locomoted significantly more than saline controls during recall in the conditioned context the day following encoding (t16 = 2.92, p = 0.010) (Cocaine, n = 9 mice; Saline, n = 9 mice). D) Schematic of behavioural experiment to test whether the conditioned response observed in Extended Data Fig. 2a–c is context-specific. Mice were administered cocaine or saline immediately prior to exposure to a novel context. The following day, they were placed in a novel context. E) Mice that received cocaine locomoted significantly more than saline controls during encoding (t18 = 5.64, p = 0.000024) (Cocaine, n = 10 mice; Saline, n = 10 mice). F) Mice that received cocaine locomoted no differently than saine controls during recall of a novel context (t18 = 1.35, p = 0.20) (Cocaine, n = 10 mice; Saline, n = 10 mice). G) Schematic of behavioural experiment to test for retrospective memory-linking with cocaine. Mice were exposed to a neutral context, and two days later they were administered either cocaine or saline immediately prior to being placed in a separate context. In the subsequent days, mice were tested in Neutral and Novel contexts, counterbalanced, and then in the cocaine-paired context last. H) Left: Mice locomoted no differently in the Neutral encoding context (t54 = 1.96, p = 0.056). Right: Mice that received cocaine locomoted more than mice that received saline during Cocaine encoding (t54 = 9.36, p = 6.72e-13) (Cocaine, n = 28 mice; Saline, n = 28 mice). I) Left: There is a strong trend that mice that received cocaine locomoted more during Neutral recall than mice that received saline (t54 = 2.85, p = 0.01). Right: Mice that received cocaine or saline locomoted no differently in Novel recall (t54 = 1.83, p = 0.07) (Cocaine, n = 28 mice; Saline, n = 28 mice).
Extended Data Fig. 3
Extended Data Fig. 3. Neurons active during Aversive encoding are selectively reactivated offline and during Aversive recall.
A) Representative maximum intensity projection of the field-of-view of one example session (left). Spatial footprints of all recorded cells during the session, randomly colour-coded (right). B) Schematic of a single aversive experience. Mice had an Aversive experience followed by a 1 hr offline session in the homecage. The next day, mice were tested in the Aversive context, followed by a test in a Novel context one day later. Calcium imaging in hippocampal CA1 was performed during all sessions. C) Mice acquired within-session freezing during Aversive encoding (left); main effect of time (F8,56 = 12.59, p = 3.87e-10, n = 8 mice). And mice responded robustly to all three foot shocks, though their locomotion generally decreased across shocks, driven by increased freezing (right); main effect of shock number (F2,14 = 7.45, p = 0.0154, n = 8 mice) and main effect of PreShock vs Shock (F1,7 = 581, p = 5.38e-8, n = 8 mice), and no interaction. D) Mice displayed a modest decrease in locomotion across the 1 hr offline period (arbitrary units) (R2 = 0.064, p = 1.9e-8, n = 8 mice). E) Mice froze significantly more in the Aversive context than in a Novel context during recall (t7 = 165, p = 4e-6, n = 8 mice). F) Cells that were active during Aversive encoding and reactivated offline were significantly more likely to be reactivated during Aversive recall than cells active during Aversive encoding and not reactivated offline (t7 = 19.41, p = 2e-7, n = 8 mice). G) A larger fraction of cells active during Aversive recall than during Novel recall were previously active during Aversive encoding (t7 = 6.897, p = 0.0002, n = 8 mice). H) During the offline period, ~40% of the population was made up of cells previously active during Aversive encoding (top). This Aversive ensemble was much more highly active than the rest of the population during the offline period (bottom; A.U.) (t7 = 8.538, p = 0.00006, n = 8 mice). I) Each cell’s activity was compared during locomotion vs during quiet rest (left; A.U.). A regression line was fit to the cells in the Aversive ensemble and in the Remaining ensemble separately, for each mouse. The Remaining ensemble showed greater activity during locomotion than during quiet rest (i.e., a less positive slope). The Aversive ensemble showed relatively greater activity during quiet rest than locomotion (i.e., a more positive slope) across mice (right) (t7 = 5.76, p = 0.047, n = 8 mice). J) Cells that had high levels of activity (A.U.) during Aversive encoding continued to have high levels of activity during the offline period (example mouse; left). There was a linear relationship between how active a cell was during Aversive encoding and how likely it was to be reactivated during the offline period (all mice; right) (R2 = 0.726, p = 1.25e-23, n = 8 mice). K) During the offline period, cells that would go on to become active during recall were more highly active than the Remaining ensemble during the offline period. The top represents the proportion of each ensemble (legend to its right). The cells that would become active during both Aversive and Novel recall were most highly active (A.U.). There was no difference in activity in the cells that would go on to be active in Aversive or Novel. Main effect of Ensemble (F3,21 = 27.81, p = 1.65e-7, n = 8 mice). Post-hoc tests: for Aversive vs Novel (t7 = 1.33, p = 0.22), for Remaining vs Aversive ∩ Novel (t7 = 11.95, p = 0.000007), for Remaining vs Aversive (t7 = 3.97, p = 0.005), for Remaining vs Novel (t7 = 7.47, p = 0.0001). L) Neuron activities were circularly shuffled 1000 times relative to one another and the mean population activity was re-computed each time. This shuffling method preserved the autocorrelations for each neuron while disrupting the co-firing relationships between neurons. The burst frequency was computed for each of these shuffles to produce a shuffled burst frequency distribution (grey histogram), to which the true burst frequency was compared (blue dotted line). This is an example mouse. M) The mean burst frequency for the shuffled distribution was computed and compared to the true burst frequency for each mouse. True burst frequencies were greater than shuffled burst frequencies in every mouse (t7 = 6.159, p = 0.000463, n = 8 mice), suggesting that during the offline period, hippocampal CA1 neurons fire in a more coordinated manner than would be expected from shuffled neuronal activities. N) As in Extended Data Fig. 3l, neuron activities were shuffled, and mean population was re-computed each time. From this population activity trace, the skew of the distribution was computed. If there were distinct periods where many neurons simultaneously fired, we hypothesized that the true distribution of mean population activity would be more skewed with a strong right tail demonstrating large and brief deflections, compared to shuffled neuronal activities. We computed the skew of each shuffled mean population activity, to produce a distribution (grey histogram), to which the true mean population’s skew was compared (blue dotted line). This is an example mouse. O) The mean skew for the shuffled distribution was computed and compared to the true skew of the mean population activity for each mouse. The true skew was greater than the shuffled skew in every mouse (t7 = 13.36, p = 0.000003, n = 8 mice), supporting the idea that the mean population activity undergoes brief burst-like activations requiring the coordinated activity of groups of neurons. P) Matrix of burst events for an example mouse, stacked along the y-axis and centred on time t = 0 (top), and the average mean population activity around each burst event (bottom). Q) As in Extended Data Fig. 3p but averaged across all mice. Each thin line represents one mouse, and the thick black line represents the mean across mice with the grey ribbon around it representing the standard error (n = 8 mice). There is no periodicity to when these burst events occur. R) The burst event frequency decreased across the hour (F11,77 = 6.91, p = 5.66e-8, n = 8 mice). S) A larger fraction of the Aversive ensemble vs the Remaining ensemble participated in each burst event (left) (t7 = 3.68, p = 0.0079, n = 8 mice). T) Ensemble burst participation as a function of burst threshold. The burst threshold was parametrically varied, and the ratio of Aversive-to-Remaining burst participation was computed at each burst threshold. Aversive-to-Remaining burst ratio is negatively related to burst threshold (R2 = 0.28, p = 3.4e-7) (n = 8 mice). On the left graph, the black line represents the mean across mice with SEM represented in the error bars, and each individual mouse is represented by the grey lines. On the right is the same data as on the left graph, but without the individual mice. U) Ensemble burst participation as a function of bin size. The Aversive-to-Remaining burst participation ratio was computed at varying bin sizes. At larger bin sizes, the selective increase in Aversive burst participation is no longer present (n = 8 mice).
Extended Data Fig. 4
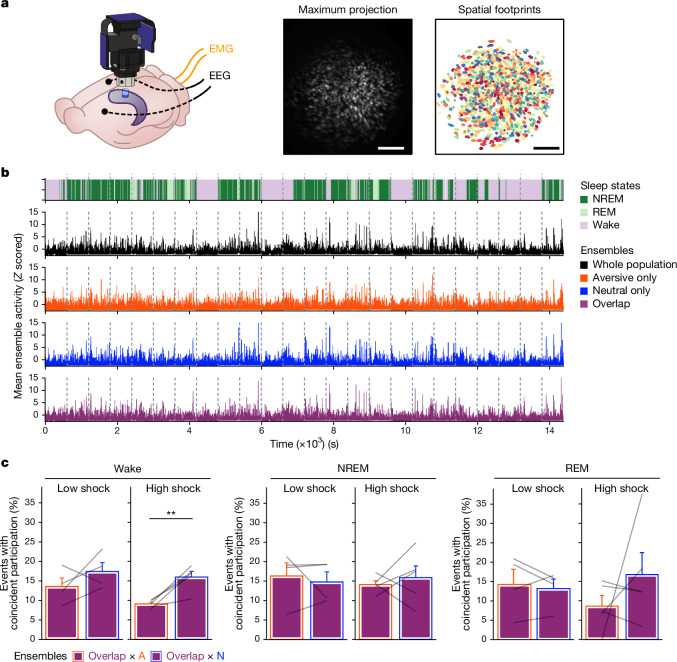
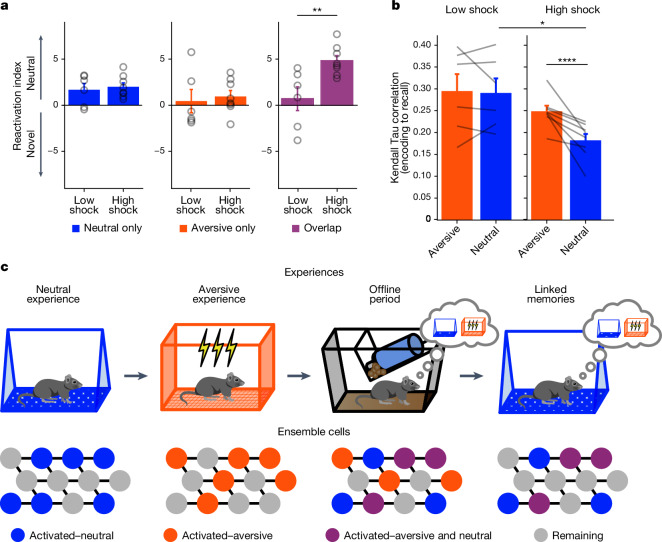
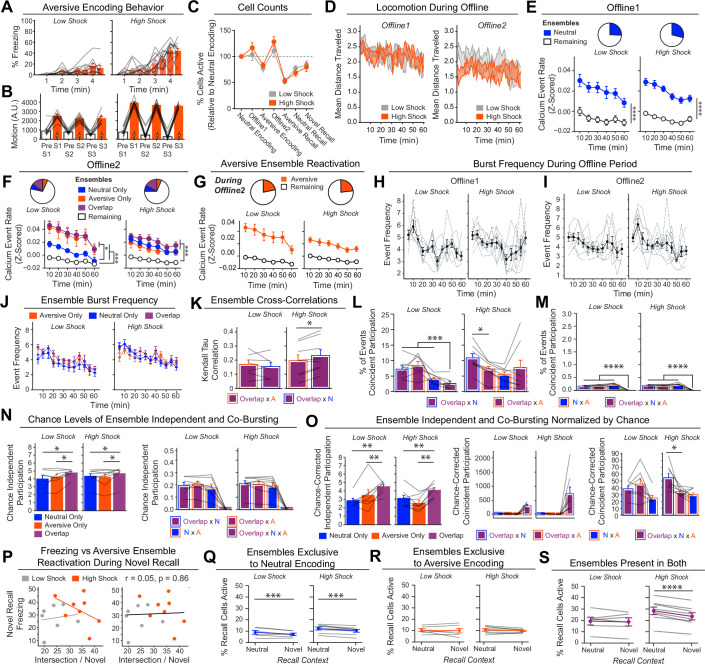
Extended Data Fig. 4. Low- vs High-shock calcium imaging supplementary analyses.
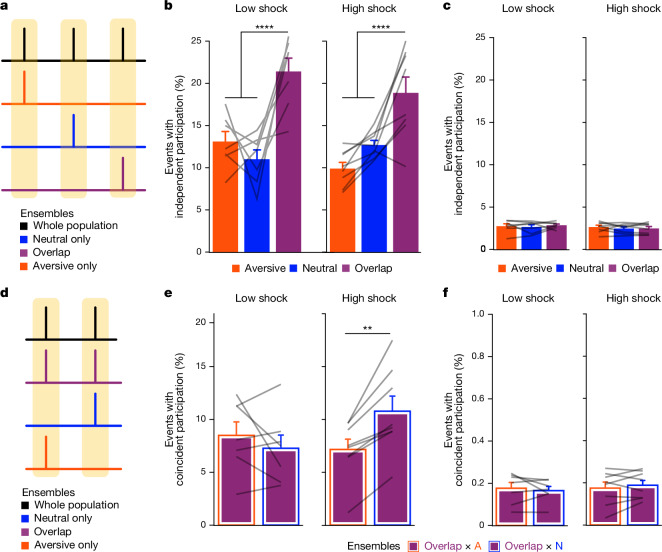
A) Mice acquired within-session freezing during Aversive encoding. Mice that received high shocks (1.5 mA) displayed more freezing than mice that received low shocks (0.25 mA) (low-shock, n = 10 mice; high-shock, n = 12 mice). B) Mice responded robustly to each foot shock. High-shock mice responded more strongly to each shock than low mice did (low-shock, n = 10 mice; high-shock, n = 12 mice). C) Relative to the first calcium imaging recording, mice showed comparable fractions of observed cells across the remaining sessions (low-shock, n = 8 mice; high-shock, n = 10 mice). D) Locomotion across the 1 hr offline period after Neutral encoding (Offline 1) and after Aversive encoding (Offline 2) in low- and high-shock mice (in arbitrary units). Mice showed decreased locomotion across the offline period on both days. Low Shock mice did not locomote differently from high-shock mice during either offline period (low-shock, n = 10 mice; high-shock, n = 12 mice). E) During Offline 1 after Neutral encoding, cells that were active during Neutral encoding (Neutral ensemble) made up ~25-30% of the offline cell population (pie charts) (X2 = 0.122, df = 1, p = 0.73). The Neutral ensemble was more highly active than the Remaining ensemble during the offline period (line graphs; A.U.). There was a main effect of Ensemble (F1,159 = 59.19, p = 1.4e-12), no effect of Amplitude (F1,13 = 0.039, p = 0.85), and an effect of Time (F1,159 = 4.33, p = 0.039), and all interactions p > 0.05 (low-shock, n = 7 mice; high-shock, n = 8 mice; 659 Offline 1 cells recorded per mouse on average). F) During Offline 2 after Aversive encoding, similar proportions of previously active cells were reactivated across low- and high-shock groups (pie charts) (X2 = 0.326, df = 3, p = 0.955). However, ensembles were differentially reactivated based upon the amplitude of the Aversive experience (Ensemble x Amplitude: F3,331 = 5.36, p = 0.0013) (line graphs; A.U.). In low-shock mice, the Neutral, Aversive, and Overlap ensembles were more highly active than the Remaining ensemble (contrast, t18 = 4.22, p = 0.0005). Additionally, these ensembles were differentially active relative to one another (F2,12 = 4.03, p = 0.046). This was driven by the Neutral ensemble being less active. The Neutral ensemble was less active than the Aversive and Overlap ensembles (t12 = 2.83, p = 0.03) while the Aversive ensemble was no differently active than the Overlap ensemble (t12 = 0.19, p = 0.85). In high-shock mice, the Neutral, Aversive, and Overlap ensembles were all more highly active than the Remaining ensemble (t21 = 4.36, p = 0.0003), but these three ensembles were no differently active from each other (F2,14 = 1.52, p = 0.25). In high-shock mice compared to low-shock mice, the Overlap and Aversive ensembles were less active than in high-shock mice (Overlap ensemble: t75.43 = 2.44, p = 0.03; Aversive ensemble: t65.83 = 3.59, p = 0.003). (low-shock, n = 7 mice; high-shock, n = 8 mice; 705 Offline 2 cells recorded per mouse on average). G) Aversive ensemble reactivation compared to Remaining ensemble during Offline 2. Ensemble reactivation here is measured as it is during Offline 1 following Neutral encoding (Extended Data Fig. 4e). There is a significant effect of ensemble (Aversive vs Remaining) (F1,159 = 90.14, p = 0.00). There is a significant effect of time (F1,159 = 4.05, p = 0.046). There is no significant effect of Amplitude (low vs high-shock) (F1,13 = 0.045, p = 0.84) (low-shock, n = 7 mice; high-shock, n = 8 mice). H) During Offline 1, burst event frequency gradually decreased across the hour (F11,143 = 4.43, p = 1.0e-5). No difference across shock amplitudes (F11,13 = 0.31, p = 0.587) (low-shock, n = 7 mice; high-shock, n = 8 mice). Significant interaction between Time and Amplitude (F11,143 = 1.87, p = 0.047). Follow-up repeated measures ANOVAs showed that both low- and high-shock groups showed a significant decrease in event rate across time (low-shock: F11,66 = 4.13, p = 0.0001; high-shock: (F11,77 = 2.43, p = 0.01). I) During Offline 2, burst event frequency decreased across time (F11,143 = 6.69, p = 0.000054). No difference across shock amplitudes (F1,13 = 0.0056, p = 0.94) (low-shock, n = 7 mice; high-shock, n = 8 mice). J) During Offline 2, bursts as defined by each ensemble (rather than by whole population) decreased across the hour, with comparable frequencies across ensembles and amplitudes (low-shock, n = 7 mice; high-shock, n = 8 mice). K) Time-lagged cross correlations between the Overlap ensemble and the Neutral and Aversive ensembles during the offline period. Each of the three ensembles (Overlap, Neutral, and Aversive) were binned into 120 sec bins. Each time bin of Overlap ensemble activity was cross-correlated with the corresponding time bin of Neutral ensemble and Aversive ensemble activity. Cross-correlations were computed with a maximum time lag of 5 frames (or, ~160 ms). For each mouse, the correlations were averaged across all time bins to get an average cross-correlation between the Overlap ensemble and Neutral ensemble (i.e., Overlap x Neutral) and the Overlap ensemble by Aversive ensemble (i.e., Overlap x Aversive). There was a significant interaction between Ensemble Combination and low- vs high-shock group (F1,13 = 6.70, p = 0.02) (low-shock, n = 7 mice; high-shock, n = 8 mice). Post-hoc tests revealed that in high-shock mice, Overlap x Neutral correlations were higher than Overlap x Aversive correlations (t7 = 3.97, p = 0.01) whereas they were no different in low-shock mice (t6 = 0.83, p = 0.44). L) As in Fig. 4d, the whole population was used to define bursts and the z-scored mean population activities were used to define participation of each ensemble. Co-participation was defined as a whole population burst during which multiple ensembles participated simultaneously. There were four possible combinations (from left to right: Overlap x Neutral, Overlap x Aversive, Neutral x Aversive, Overlap x Neutral x Aversive). During burst periods, there was a significant interaction between Ensemble Combination and low- vs high-shock (p = 0.01), suggesting that the patterns of co-bursting varied in low- vs high-shock mice. Post-hoc tests revealed that in low-shock mice, co-participation between all 3 ensembles was less likely to occur than the other combinations (t18 = 4.73, p = 0.0003), while in high-shock mice, co-participation between all 3 ensembles occurred no differently than the other combinations (t21 = 0.358, p = 0.72). Additionally, in the high-shock group, the Overlap ensemble preferentially co-participated with the Neutral ensemble compared to with the Aversive ensemble (t21 = 2.373, p = 0.05), whereas in the low-shock group, the Overlap ensemble participated no differently with the Neutral and Aversive ensembles (t18 = 1.196, p = 0.25) (low-shock, n = 7 mice; high-shock, n = 8 mice). M) During non-burst periods, co-participation between all 3 ensembles was less likely than the other combinations (t39 = 10.92, p = 1.98e-13); however, there was no effect of low- vs high-shock (F1,13 = 0.038, p = 0.847) and no interaction (F3,39 = 0.198, p = 0.897) (low-shock, n = 7 mice; high-shock, n = 8 mice). N) Chance levels of ensemble independent and co-bursting. Left: The chance levels of independent bursting of the Overlap ensemble was higher than Neutral or Aversive independent bursting (F2,26 = 6.61, p = 0.005). There was no difference between low- vs high-shock groups (F1,13 = 0.030, p = 0.87) and no interaction (F2,26 = 0.96, p = 0.40). Right: Chance levels of triple co-bursting was much lower than of any combination of two ensembles (F3,39 = 98.3, p = 3e-18). There was no difference between low- vs high-shock groups (F1,13 = 0.07, p = 0.79) and no interaction (F3,39 = 0.20, p = 0.90) (low-shock, n = 7 mice; high-shock, n = 8 mice). O) Ensemble independent and co-bursting normalized by chance. Left: Overlap independent bursting was higher than Neutral or Aversive independent bursting (F2,26 = 13.82, p = 0.00008). There was no difference between low- vs high-shock groups (F1,13 = 0.69, p = 0.42) and no interaction (F2,26 = 2.2, p = 0.13). Right: Overlap x Neutral co-bursting was more likely to occur than Overlap x Aversive co-bursting in high-shock mice (t7 = 3.06, p = 0.043) but not in low-shock mice (t6 = 1.25, p = 0.26) (low-shock, n = 7 mice; high-shock, n = 8 mice). P) Correlation between Aversive/Novel ensemble overlap with Novel recall freezing. Left: separate regression lines for low- vs high-shock mice. Right: one regression line for all mice. There was no correlation between Aversive/Novel ensemble overlap and Novel recall freezing (R2 = 0.005, p = 0.86) (low-shock, n = 7 mice; high-shock, n = 8 mice). Q) Cells active only during the Neutral experience and not the Aversive experience were more likely to be reactivated when mice were placed back in the Neutral context, compared to when they were placed in a Novel context (F1,12 = 24.44, p = 0.0003). There was no effect of shock amplitude (F1,12 = 3.08, p = 0.10) (low-shock, n = 6 mice; high-shock, n = 8 mice). R) Cells active during the Aversive experience and not the Neutral experience were no differently reactivated in Neutral vs Novel contexts. (Amplitude: F1,12 = 0.029, p = 0.869; Context: F1,12 = 1.39, p = 0.261; Amplitude x Context: F1,12 = 0.14, p = 0.71) (low-shock, n = 6 mice; high-shock, n = 8 mice). S) Cells active during both the initial Neutral and Aversive experiences were subsequently more likely to be reactivated in the Neutral context compared to Novel context in high-shock mice (t7 = 8.53, p = 0.00012), but not low-shock mice (t5 = 0.55, p = 0.61; Context x Amplitude: F1,12 = 10.33, p = 0.007) (low-shock, n = 6 mice; high-shock, n = 8 mice).
Extended Data Fig. 5
Extended Data Fig. 5. Characterization of inhibitory neuron tagging approach (chemotagging) to tag inhibitory neurons in vivo using Miniscope calcium imaging.
A) Schematic of calcium imaging experiment to test whether GAD+ cells could be robustly activated with hM3Dq receptor activation in inhibitory neurons. Gad2-cre mice were injected with a virus cocktail of AAV1-Syn-GCaMP6f and AAV5-DIO-hSyn-hM3Dq-mCherry into dorsal CA1 and had a lens implanted above CA1. After baseplating, recovery, and habituation, mice were injected with saline and placed in their homecage for a recording (PreBaseline), followed by exposure to a novel environment (Baseline) and then another homecage recording (PostBaseline). The following day, half the mice were administered CNO and the other half saline and were placed in their homecage for a recording (PreSession1), followed by exposure to a second novel context (Session1). The following day, mice were administered with the drug they did not receive the previous day (saline or CNO) and placed in their homecage for a recording (PreSession2), followed by exposure to a third novel context (Session2). This experiment was run one time. B) Example histology of CA1 of mice in the experiment. Green represents AAV1-Syn-GCaMP6f, red represents AAV5-DIO-hSyn-hM3Dq-mCherry, and blue represents DAPI. C) Example saline PreSession. Each row represents calcium activity of a neuron, of the top 5% of most highly active cells (in red) and the bottom 5% of most lowly active cells (in blue) during the saline PreSession. On the right is a maximum intensity projection demonstrating all the cells, with red and blue crosses representing the centres of mass of the most and least active cells (respectively) from the calcium activities on the left. D) As in Extended Data Fig. 5c, but of an example CNO PreSession. Here, it is apparent that the most active cells become highly active 5−10 min after the session begins, while the most lowly active cells become inactive 5−10 min after the session begins. E) Left: a representative cell that had heightened activity during the CNO PreSession. Right: a representative cell that had inhibited activity during the CNO PreSession. These two examples represent two extremes of cells that became highly active or inhibited. Cells highly responsive to CNO suggested that they may be putative inhibitory (i.e., GAD+) neurons, whereas cells not highly responsive to CNO suggested that they may be putative non-inhibitory (i.e., GAD-) neurons. F) Example distribution of calcium activities after saline vs CNO administration in the same mouse. In this example, it is apparent that CNO widens the distribution of cell activities, consistent with activation of inhibitory neurons and inhibition of excitatory neurons. G) Quantification of the standard deviation of activity across the population after CNO vs saline. After mice received CNO, the distribution of their population activity had a larger standard deviation, consistent with the idea that some cells become very active and others become very inactive, compared with administration of saline (t4 = 15.04, p = 0.018) (n = 5 mice). H) Quantification of how well the levels of cell activity at one point predict cell activity at a later timepoint. Left: The level of cell activity during the PreBaseline period is related to cell activity during Baseline (R2 = 0.579, slope = 0.35). Middle: Cell activity during Baseline is highly predictive of cell activity during PostBaseline (R2 = 0.813, slope = 0.53), as in Extended Data Fig. 3j. Right: Cell activity during PreBaseline is predictive of cell activity during PostBaseline (R2 = 0.756, slope = 0.49) (n = 5 mice).
Extended Data Fig. 6
Extended Data Fig. 6. The Overlap ensemble comprises the largest fraction of inhibitory neurons.
A) Schematic of calcium imaging experiment to test the breakdown of inhibitory neurons across the ensembles. Gad2-cre mice were injected with a virus cocktail of AAV1-Syn-GCaMP6f and AAV5-DIO-hSyn-hM3Dq-mCherry into dorsal CA1 and had a lens implanted above CA1. After baseplating, recovery, and habituation, mice underwent Neutral encoding, followed by high-shock Aversive encoding two days later. After each encoding session, mice underwent a 1 hr offline recording. A day after Aversive encoding, mice were injected with CNO to identify the putative GAD+ cells while recording calcium activity from all neurons (see Extended Data Fig. 5). Then, these cells were cross-registered back to the neurons active during the offline period the day before. This allowed us to ask, of the ensembles recorded during the offline period, what fraction of each ensemble was made up by inhibitory neurons. This experiment was run one time. B) Here, we computed the percent of cells that were putative inhibitory neurons in each ensemble. We sorted the cells recorded during Offline 2 based on how highly active they were in response to CNO administration on CNO day (from most highly active cells on CNO day to least highly active; see Methods for details on how this was computed). During Offline 2, we asked what fraction of each ensemble (i.e., Aversive, Neutral, Overlap, Remaining) made up the inhibitory neurons. Rather than specifying an a priori threshold for what fraction of recorded cells would comprise the inhibitory neuron population, we parametrically varied the threshold for what fraction of the population was made up of putative inhibitory neurons and computed the fraction of each ensemble that made up this population at each threshold. The line graph (left) represents the parametrically varied thresholds along the x-axis (i.e., % Cutoff of Total Cells), and the y-axis represents the fraction of each ensemble at each threshold cutoff. Anatomical data have suggested that inhibitory neurons make up about 10% of the total number of neurons in the pyramidal layer of CA1 (which is the region we recorded from) (Bezaire & Soltesz, 2013). Thus, we extracted the 10% mark from the line graph (represented by the black dashed line) and compared the fractions at this cutoff (right bar graph). Here, the Overlap ensemble comprised a larger fraction of the inhibitory neuron population than any of the other ensembles (F3,12 = 26.17, p = 0.000015) (n = 5 mice). Notably, this effect was apparent in the line graph not only at a 10% cutoff but at neighbouring cutoffs as well. C) Here, we asked a similar question as in Extended Data Fig. 6b, but instead asking what fraction of inhibitory neurons made up each ensemble. In this case, the number of cells was a fraction of the total ensemble size. In the line graph (left), we again parametrically varied the fraction of cells that were putative inhibitory neurons along the x-axis, and asked what fraction of each ensemble was comprised of inhibitory neurons. Again, we took the 10% mark—based on anatomical data—and compared the fraction of inhibitory neurons that made up each ensemble. Similar to in Extended Data Fig. 6b, the Overlap ensemble was composed more of inhibitory neurons than the other ensembles were (F3,12 = 15.29, p = 0.0002) (n = 5 mice). Collectively, this suggests that the Overlap ensemble is enriched in inhibitory neurons. D) Lack of periodicity of bursts during the offline period, as in Extended Data Fig. 3p,q (n = 5 mice). E) Decrease in locomotion around bursts during the offline period, as in Fig. 2d,e (n = 5 mice). F) Independent ensemble participation, as in Fig. 4b. Overlap ensemble participation is higher than Aversive participation (t4 = 6.1, p = 0.01) and is trending to be higher than Neutral participation (t4 = 2.55, p = 0.063). Neutral participation is higher than Aversive participation (t4 = 3.55, p = 0.036) (n = 5 mice). G) Ensemble coincident participation, as in Fig. 4e and Extended Data Fig. 4l. Overlap x Neutral participation is higher than Overlap x Aversive (F3,12 = 18.99, p = 0.0077; t4 = 12.17, p = 0.0009), replicating the previous result in Fig. 4e (n = 5 mice). H) Ensemble participation in Offline 2 bursts, as a function of the cell’s response during Inhibitory Tag, by each 5% of cells. Cells that were most active during Inhibitory Tag (leftmost points) participated more frequently in bursts than cells that responded less during Inhibitory Tag (F9,36 = 7.57, p = 0.000004) (n = 5 mice). I) SVM decoding of Neutral vs Aversive encoding context using cells active during both Neutral and Aversive encoding. Accuracy of decoding is significantly higher than shuffled controls (t4 = 10.04, p = 0.0006) (n = 5 mice). J) SVM decoding of Neutral vs Aversive encoding is no different when using 20% of cells, based on the cells’ response during Inhibitory Tag (F4,16 = 1.50, p = 0.28). This suggests that the putative inhibitory neurons hold no more or less predictive power than the rest of the population. All decoders performed better than shuffled controls (F1,4 = 64.13, p = 0.001). There is no interaction (F4,16 = 1.44, p = 0.29) (n = 5 mice).
Extended Data Fig. 7
Extended Data Fig. 7. Neutral and Aversive contexts are discriminable at encoding.
A) Left: Example raster of activity of cells during Neutral and Aversive encoding. Cells that were cross-registered during both sessions were aligned, concatenated, and labelled with the context they were associated with. Support vector machines (SVMs) were trained on this activity (see Methods for details). Middle: Example distributions of accuracy using the true data (in blue) and using shuffled label controls (in grey). The dots above the distributions represent the mean accuracy of the distribution. Right: Quantification of accuracy between True vs Shuffle in low- and high-shock mice. Accuracy of the True data was significantly higher than Shuffle in both low- and high-shock groups (F1,12 = 38.49, p = 0.000046), and there was no difference in low- and high-shock mice (F1,12 = 0.015, p = 0.22) and no interaction (F1,12 = 0.014, p = 0.23) (low-shock, n = 6 mice; high-shock, n = 8 mice). B) Left: Example of population vector correlations within and between Neutral and Aversive encoding. Cells across sessions were again aligned and concatenated, as in Extended Data Fig. 7a. Then moment-to-moment correlation matrices were constructed to compare population activity within (intra) and between (inter) encoding sessions. Right: Quantification of population vector correlations within and between sessions. Intra-session correlations were higher than Inter-session correlations (F1,12 = 6.74, p = 0.02). There was no effect of Amplitude (F1,12 = 1.50, p = 0.24) or Interaction (F1,12 = 0.65, p = 0.44). Moreover, Intra-session correlations were significantly greater than 0 in low-shock (t5 = 5.00, p = 0.016) and high-shock (t7 = 3.08, p = 0.036), whereas Inter-session correlations were not significantly greater than 0 in low-shock (t5 = 0.23, p = 0.88) or high-shock (t7 = 0.15, p = 0.88). (low-shock, n = 6 mice; high-shock, n = 8 mice). C) Ensemble overlap between Neutral and Aversive encoding in low- vs high-shock mice. There was no difference in ensemble overlap between Neutral and Aversive encoding in low- vs high-shock mice (t11.43, p = 0.13) (low-shock, n = 6 mice; high-shock, n = 8 mice).
Extended Data Fig. 8
Extended Data Fig. 8. No Shock control mice do not display co-bursting between the Overlap and Neutral ensembles.
A) Schematic of calcium imaging experiment performing retrospective memory-linking with no-shock during Aversive encoding. Mice underwent Neutral encoding followed by Aversive encoding two days later, during which they received 0 mA shocks (i.e., no shocks). In the subsequent three days, mice were tested in the Aversive context, followed by Neutral and Novel recall, counterbalanced. This experiment was run one time. B) Behaviour during Aversive encoding. Left: We measured locomotion at the same timepoints as in Extended Data Fig. 4b, where low- and high-shock mice received footshocks. As expected, mice did not display a change in locomotion during these timepoints, in contrast to low- and high-shock mice in Extended Data Fig. 4b. Right: As expected, mice did not display an increase in freezing across the Aversive encoding session, in contrast to low- and high-shock mice in Extended Data Fig. 4a. C) Locomotion during the offline periods. Locomotion gradually decreased throughout the offline period during both Offline 1 and Offline 2 (n = 6 mice). D) Freezing during recall. Left: Mice froze minimal levels during Aversive recall. Right: Mice froze no differently in Neutral vs Novel recall (t5 = 1.52, p = 0.19) (n = 6 mice). E) SVM performance during encoding. An SVM predicted Neutral vs Aversive encoding context more accurately than shuffled controls, as in Extended Data Fig. 7a (t5 = 4.77, p = 0.005) (n = 6 mice). F) Chance levels of ensemble independent and co-bursting during the offline period. Left: there were no differences in chance levels of ensemble independent participation (F2,10 = 1.07, p = 0.38). Right: there were no differences in chance levels of co-bursting of any two ensembles, and co-bursting of two ensembles was higher than co-bursting of all three (F3,15 = 20.99, p = 0.000013) (n = 6 mice). G) Ensemble independent and co-bursting normalized by chance during the offline period. Left: independent participation of the three ensembles. Overlap ensemble independent participation was higher than either Aversive (t5 = 6.31, p = 0.004) or Neutral (t5 = 3.8, p = 0.019) independent participation. Middle: Ensemble co-bursting of all combinations. Right: Replotting of co-bursting between only two ensembles. There was no difference in co-bursting between the ensemble pairs (F2,10 = 1.29, p = 0.32) (n = 6 mice).
Extended Data Fig. 9
Extended Data Fig. 9. Validation of simultaneous calcium imaging and EEG/EMG to measure ensemble reactivation across sleep states.
A) Schematic representing the protocol for calcium imaging and EEG/EMG recordings during the offline period. EEG and EMG were recorded continuously throughout the offline period. To avoid photobleaching, calcium imaging was done intermittently: calcium was recorded for 10 min, followed by 20 min of no recording, repeated 24 times, for 4 hrs worth of calcium recordings across a 12 hr period. Mice underwent the retrospective memory-linking behavioural paradigm as in Fig. 1d, with calcium imaging recordings during Neutral and Aversive encoding, as well as during Aversive, Neutral, and Novel recall. During Offline 1 and Offline 2, in contrast to in Fig. 1d, these mice underwent the recording scheme described above. B) Freezing during Aversive recall. High-shock mice froze more during Aversive recall than low-shock mice (t7 = 8.99, p = 0.020) (low-shock, n = 4 mice; high-shock, n = 5 mice). C) Freezing during Neutral vs Novel recall. High-shock mice froze more during Neutral vs Novel recall (t4 = 4.02, p = 0.03), whereas low-shock mice froze no differently in Neutral vs Novel recall (t3 = 1.08, p = 0.36) (low-shock, n = 4 mice; high-shock, n = 5 mice). D) Mice wearing a Miniscope chronically throughout the experiment display no differences in sleep duration across the 24 hr sleep/wake cycle, compared to mice with no Miniscope implant (F1,10 = 0.54, p = 0.48) (Miniscope, n = 8 mice; No Miniscope, n = 4 mice). E) Same as Extended Data Fig. 9d but broken up by sleep state. Mice wearing a Miniscope chronically show no differences in time spent in each sleep state. F) Example hypnogram demonstrating that mice display normal patterns of sleep, with more bouts of sleep during their Lights On period. G) The calcium imaging recording scheme in Extended Data Fig. 9a reliably captures the fractions of time that mice spend in each sleep/wake state. Left: Amount of time spent in each sleep state as captured during the Miniscope recordings across a 12 hr period (4hrs of total calcium recording time). Right: Amount of time spent in each sleep state across the entire 12hrs of the offline period (low-shock, n = 4 mice; high-shock, n = 5 mice). H) Example sessions demonstrating alignment of sleep and calcium data. Left: Example session where mouse awakens halfway throughout the recording. Right: Example session where mouse is mostly asleep but has three brief arousals.
Extended Data Fig. 10
Extended Data Fig. 10. Sleep structure is not modified by Neutral or Aversive encoding.
A) Schematic of experiment comparing sleep patterns before and after each encoding experience. Mice had their EEG/EMG recorded for the 24 h prior to the start of the first Neutral encoding experience, and for the 24 hrs following Neutral encoding and after Aversive encoding. B) Mice display no gross change in sleep duration across days (Pre-Neutral vs Post-Neutral vs Post-Aversive), or in low- vs high-shock mice (Low Shock, n = 4 mice; high-hock, n = 5 mice). C) When we zoom into the first 2hrs after encoding, we see that mice are awake for longer for about the first 30 min after encoding, after which sleep patterns return to pre-experiment levels (low-shock, n = 4 mice; high-shock, n = 5 mice). D) Same as Extended Data Fig. 10b but broken up for time spent in each sleep state. E) Mice display no differences in bout length of each sleep state across days (Pre-Neutral vs Post-Neutral vs Post-Aversive), or in low- vs high-shock mice (low-shock, n = 4 mice; high-shock, n = 5 mice). F) Mice display no differences in transition probabilities between sleep states across days (Pre-Neutral vs Post-Neutral vs Post-Aversive), or in low- vs high-shock mice (low-shock, n = 4 mice; high-shock, n = 5 mice).

Update of

References

    1. Reijmers, L. G., Perkins, B. L., Matsuo, N. & Mayford, M. Localization of a stable neural correlate of associative memory. Science317, 1230–1233 (2007). - PubMed
    1. Han, J. H. et al. Neuronal competition and selection during memory formation. Science316, 457–460 (2007). - PubMed
    1. Liu, X. et al. Optogenetic stimulation of a hippocampal engram activates fear memory recall. Nature484, 381–385 (2012). - PMC - PubMed
    1. Denny, C. A. et al. Hippocampal memory traces are differentially modulated by experience, time, and adult neurogenesis. Neuron83, 189–201 (2014). - PMC - PubMed
    1. Vetere, G. et al. Memory formation in the absence of experience. Nat. Neurosci.22, 933–940 (2019). - PMC - PubMed

LinkOut - more resources