. 2024 Nov 6;7(1):1450.
doi: 10.1038/s42003-024-07137-x.

Sources of variation in the serum metabolome of female participants of the HUNT2 study

Affiliations

Sources of variation in the serum metabolome of female participants of the HUNT2 study

Julia Debik et al. Commun Biol. .

Abstract

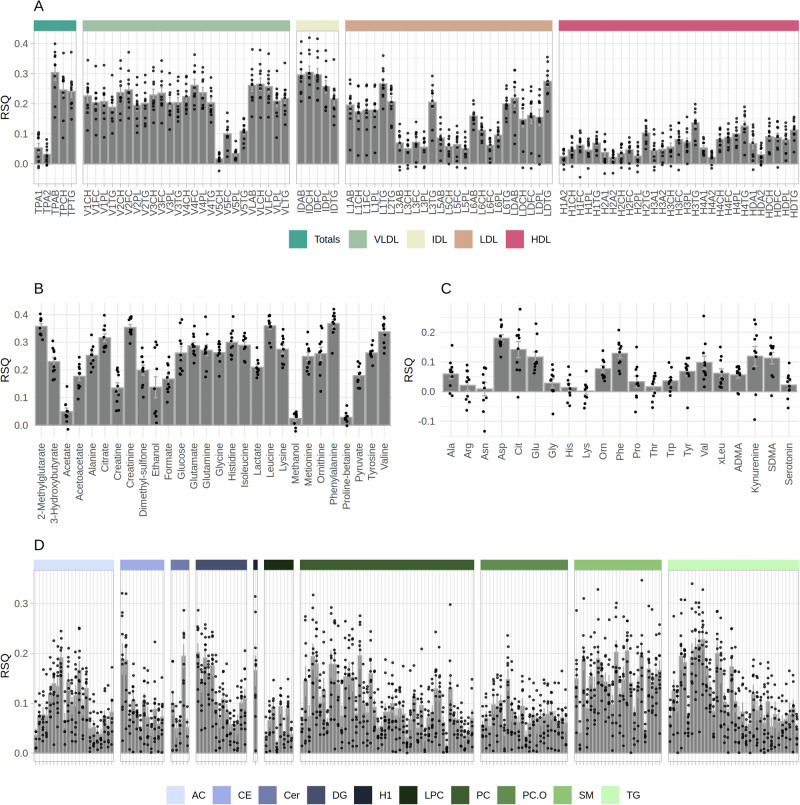
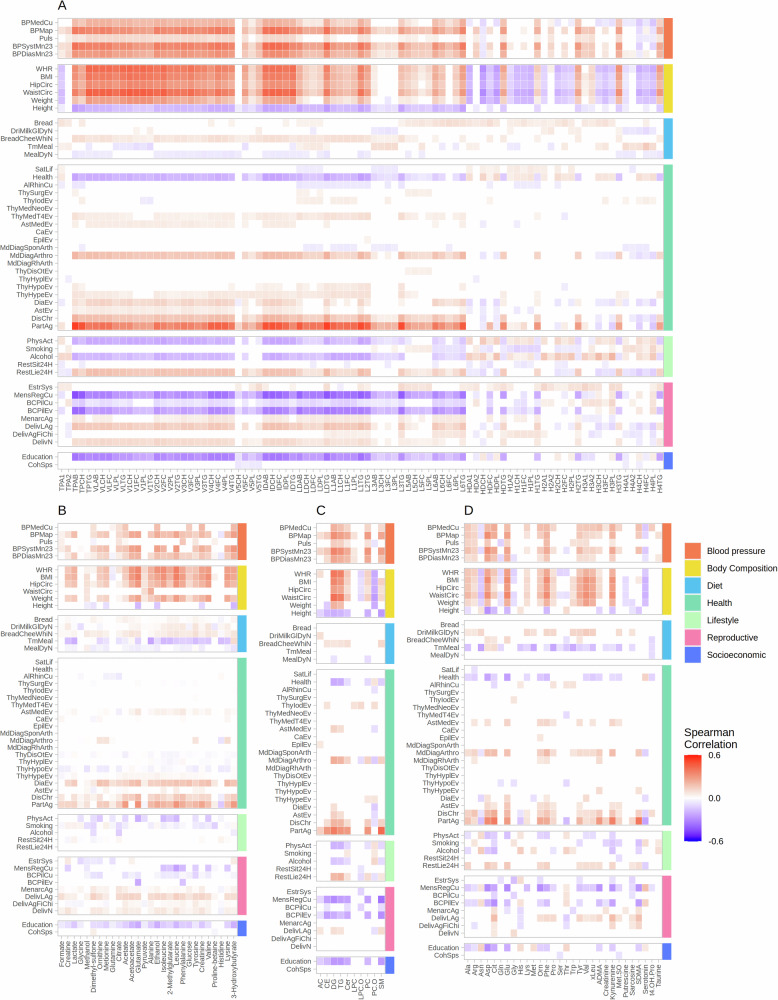
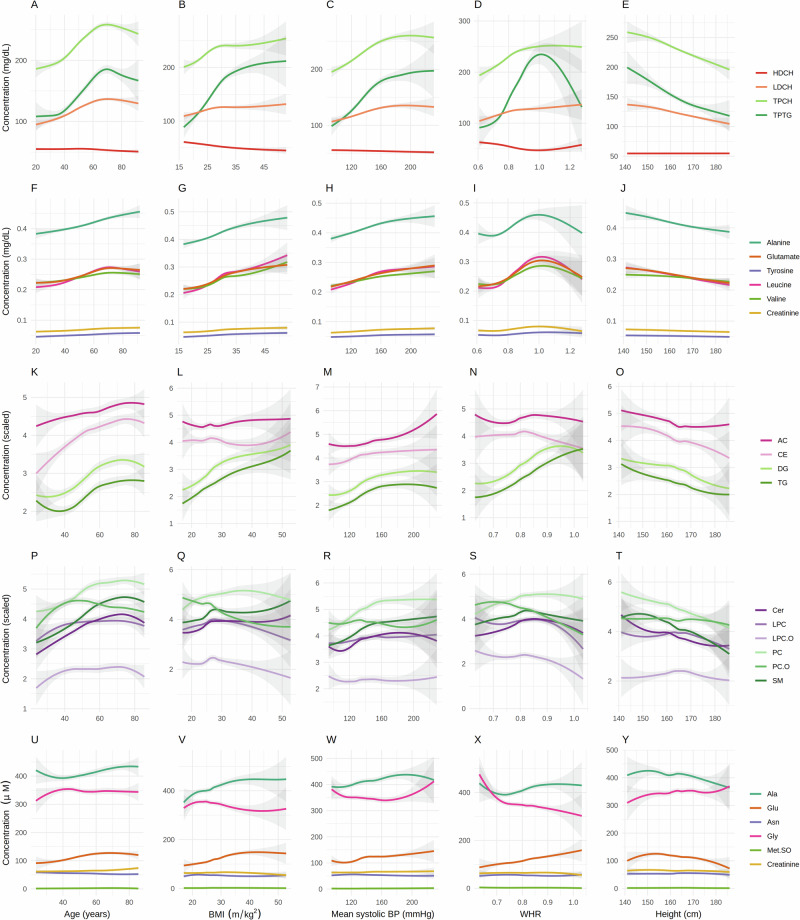
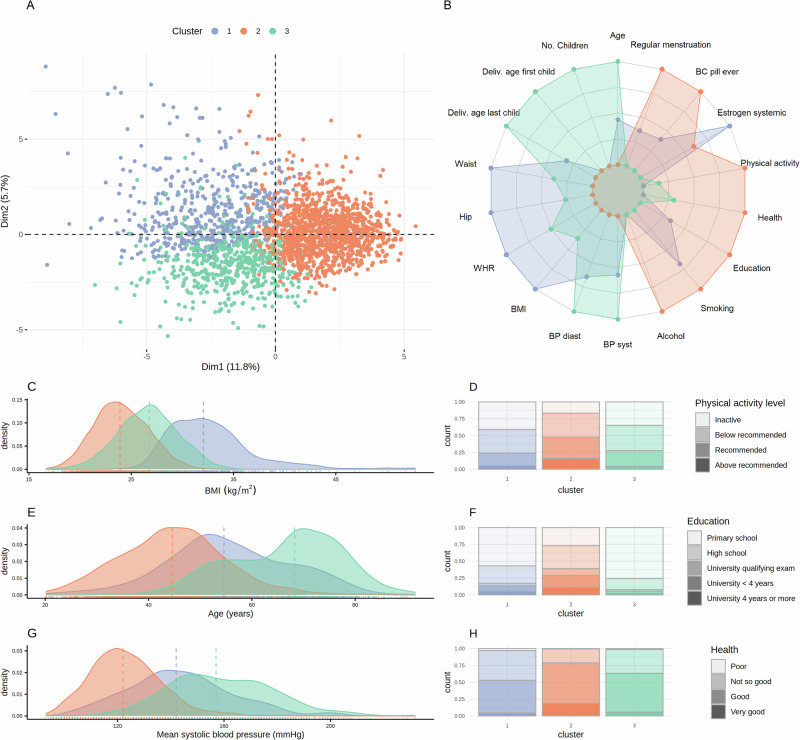
The aim of this study was to explore the intricate relationship between serum metabolomics and lifestyle factors, shedding light on their impact on health in the context of breast cancer risk. Detailed metabolic profiles of 2283 female participants in the Trøndelag Health Study (HUNT study) were obtained through nuclear magnetic resonance (NMR) spectroscopy and mass spectrometry (MS).We show that lifestyle-related variables can explain up to 30% of the variance in individual metabolites. Age and obesity were the primary factors affecting the serum metabolic profile, both associated with increased levels of triglyceride-rich very low-density lipoproteins (VLDL) and intermediate-density lipoproteins (IDL), amino acids and glycolysis-related metabolites, and decreased levels of high-density lipoproteins (HDL). Moreover, factors like hormonal changes associated with menstruation and contraceptive use or education level influence the metabolite levels.Participants were clustered into three distinct clusters based on lifestyle-related factors, revealing metabolic similarities between obese and older individuals, despite diverse lifestyle factors, suggesting accelerated metabolic aging with obesity. Our results show that metabolic associations to cancer risk may partly be explained by modifiable lifestyle factors.


Conflict of interest statement

The authors declare no competing interests.

Figures

Fig. 1
Fig. 1. Flow chart summarizing the data flow in this study.
Lifestyle variables were obtained from the HUNT2 databank, and include variables related to clinical parameters, demography, lifestyle, socio-economic factors, and anthropometric measurements. Blood samples were collected in the years 1995-97 and were stored in the HUNT biobank until metabolic profiling by NMR and MS in 2019. N and v indicate the number of individuals and number of variables at each step, respectively. NMR: nuclear magnetic resonance; MS: mass spectrometry.
Fig. 2
Fig. 2. Variance explained in individual metabolites explained by lifestyle-related variables.
Variance explained (RSQ) by lifestyle related factors in NMR-measured lipoprotein subfractions (A) and metabolites (B), and MS-measured metabolites (C) and lipids (D). MS-measured lipids (D) are ordered in the direction of an increased number of total carbons and number of double bonds, going from the left to the right. Molecules with a negative variance explained have been removed from the figures. TP: Total plasma, VLDL: Very-low-density lipoprotein, IDL: Intermediate-density lipoprotein, LDL: Low-density lipoprotein, HDL: High-density lipoprotein, CH: Cholesterol, FC: Free cholesterol, PL: Phospholipids, TG: Triglycerides, AB: Apolipoprotein-B, A1: Apolipoprotein-A1, A2: Apolipoprotein-A2; Ala: Alanine; Arg: Arginine; Asn: Asparagine; Asp: Aspartate; Cit: Citrulline; Glu: Glutamate; Gly: Glycine; His: Histidine; Lys: Lysine; Orn: Ornithine; Phe: Phenylalanine; Pro: Proline; Thr: Threonine; Trp: Tryptophan; Tyr: Tyrosine; Val: Valine; xLeu: Leucine+Isoleucine; ADMA: Asymmetric dimethylarginine; SDMA: Symmetric dimethylarginine; AC: Acylcarnities; CE: Cholesteryl esters; Cer: Ceramides; DG: Diglycerides; H1: Hexoses; LPC: Lysophosphatidylcholines; PC: Phosphatidylcholines; SM: Sphingomyelins. Error bars show the mean and standard error of the estimated RSQ values over 10-fold cross-validation (n = 10 independent model training and testing sets).
Fig. 3
Fig. 3. Correlations between metabolites and lifestyle-related variables.
Spearman correlations between lifestyle-related variables (numerical or ordinal) and (A) NMR-measured lipoprotein subfractions; (B) NMR-measured metabolites; (C) Aggregated levels of MS-measured lipids and (D) MS-measured metabolites. TP: Total plasma, VLDL: Very-low-density lipoprotein, IDL: Intermediate-density lipoprotein, LDL: Low-density lipoprotein, HDL: High-density lipoprotein, CH: Cholesterol, FC: Free cholesterol, PL: Phospholipids, TG: Triglycerides, AB: Apolipoprotein-B, A1: Apolipoprotein-A1, A2: Apolipoprotein-A2; AC: Acylcarnitines; CE: Cholesteryl esters; DG: Diglycerides; TG: Triglycerides; LPC: Lysophosphatidylcholines; Cer: Ceramides; SM: Sphingomyelins; PC: Phosphatidylcholines; Ala: alanine; Arg: arginine; Asp: aspertine; Cit: Citrulline; Gln: Glutamine; Glu: Glutamate; Gly: Glycine; His: Histidine; Lys: Lysine; Met: Methionine; Orn: Ornithine; Phe: Phenylalanine; Ser: Serine; Thr: Threonine; Trp: Tryptophan; Tyr: Tyrosine; Val: Valine; xLeu: Leucine+Isoleucine; ADMA: Asymmetric dimethylarginine; Met.SO: Methionine sulfoxide; SDMA: Symmetric dimethylarginine; t4.OH.Pro: trans-4-Hydroxyproline; Insignificant correlations are colored in white.
Fig. 4
Fig. 4. Trends in metabolite levels in selected lifestyle-related variables.
Smoothed conditional means showing the relationship between selected lifestyle-related variables and a selection of NMR-measured lipoprotein subfractions (AE); NMR-measured metabolites (FJ); Aggregated levels of MS-measured lipids and (KT) and MS-measured metabolites (UY). BMI: Body mass index; WHR: Waist-to-hip ratio HDCH: High-density lipoprotein cholesterol; LDCH: Low-density lipoprotein cholesterol; TPCH: Total cholesterol; TPTG: Total triglycerides; AC: Acylcarnitines; CE: Cholesteryl esters; DG: Diglycerides; TG: Triglycerides; Cer: Ceramides; LPC: Lysophosphatidylcholines; PC: Phosphatidylcholines; SM: Sphingomyelins; Ala: Alanine; Glu: Glutamate; Asn: Asparagine; Gly: Glycine; Met.SO: Methionine sulfoxide.
Fig. 5
Fig. 5. Characteristics of participants in the lifestyle-defined clusters of the HUNT2 participants.
(A) The three clusters of participants projected onto a PCA scores plot. Both numerical and ordinal lifestyle-related variables were included in the PCA. (B) A visual summary of the main differences between the participants in the three clusters. The axis goes from the minimum (mean of the participants in the cluster with the lowest values) to the maximum (mean of the participants in the cluster with the highest values) for each lifestyle-related variable individually. The distribution of BMI (C), age at HUNT2 (E) and mean systolic blood pressure (G) in the three clusters is shown. Median values are depicted by the vertical dashed lines. Distributions of physical activity levels (D), education (F), and self-reported health (H) varied between the three clusters. PCA: Principal component analysis. BC: Birth-control; BP: Blood pressure; WHR: Waist-to-hip ratio; BMI: Body mass index.
Fig. 6
Fig. 6. Metabolic differences among participants in the clusters of the HUNT2 participants.
Mean relative differences (%) in concentrations of NMR-measured serum lipoproteins (A) and metabolites (B) and MS-measured metabolites (C) and lipids (D) among participants of lifestyle-defined clusters 1 (blue) and 3 (green) compared to participants in cluster 2 (orange). Distributions of selected NMR-measured lipoprotein subfractions (E, I, M) and metabolites (F, J, N), and MS-measured metabolites (G, K, O) and aggregated lipids (H, L, P) in the three clusters of participants. Median values are depicted by the vertical dashed lines. TP: Total plasma, VLDL: Very-low-density lipoprotein, IDL: Intermediate-density lipoprotein, LDL: Low-density lipoprotein, HDL: High-density lipoprotein, CH: Cholesterol, FC: Free cholesterol, PL: Phospholipids, TG: Triglycerides, AB: Apolipoprotein-B, A1: Apolipoprotein-A1, A2: Apolipoprotein-A2; Ala: Alanine; Arg: Arginine; Asp: Aspartate; Cit: Citrulline; Gln: Glutamine; Glu: Glutamate; Gly: Glycine; His: Histidine; Lys: Lysine; Met: Methionine; Orn: Ornithine; Phe: Phenylalanine; Ser: Serine; Thr: Threonine; Trp: Tryptophan; Tyr: Tyrosine; Val: Valine; xLeu: Leucine+Isoleucine; ADMA: Asymmetric dimethylarginine; Met.SO: Methionine sulfoxide; SDMA: Symmetric dimethylarginine; t4.OH.Pro: trans-4-Hydroxyproline; AC: Acylcarnitines; CE: Cholesteryl esters; Cer: Ceramides; DG: Diglycerides; H1: Hexoses; LPC: Lysophosphatidylcholines; PC: Phosphatidylcholines; SM: Sphingomyelins.

References

    1. Buergel, T. et al. Metabolomic profiles predict individual multidisease outcomes. Nat. Med.28, 2309–2320 (2022). - PMC - PubMed
    1. Julkunen, H. et al. Atlas of plasma NMR biomarkers for health and disease in 118,461 individuals from the UK Biobank. Nat. Commun.14, 604 (2023). - PMC - PubMed
    1. Deelen, J. et al. A metabolic profile of all-cause mortality risk identified in an observational study of 44,168 individuals. Nat. Commun.10, 3346 (2019). - PMC - PubMed
    1. Wurtz, P. et al. Metabolite profiling and cardiovascular event risk: a prospective study of 3 population-based cohorts. Circulation131, 774–785 (2015). - PMC - PubMed
    1. Bar, N. et al. A reference map of potential determinants for the human serum metabolome. Nature588, 135–140 (2020). - PubMed

LinkOut - more resources