. 2024 Nov;635(8037):193-200.
doi: 10.1038/s41586-024-08107-3. Epub 2024 Nov 6.

Origins and impact of extrachromosomal DNA

Collaborators, Affiliations

Origins and impact of extrachromosomal DNA

Chris Bailey et al. Nature. 2024 Nov.

Abstract

Extrachromosomal DNA (ecDNA) is a major contributor to treatment resistance and poor outcome for patients with cancer1,2. Here we examine the diversity of ecDNA elements across cancer, revealing the associated tissue, genetic and mutational contexts. By analysing data from 14,778 patients with 39 tumour types from the 100,000 Genomes Project, we demonstrate that 17.1% of tumour samples contain ecDNA. We reveal a pattern highly indicative of tissue-context-based selection for ecDNAs, linking their genomic content to their tissue of origin. We show that not only is ecDNA a mechanism for amplification of driver oncogenes, but it also a mechanism that frequently amplifies immunomodulatory and inflammatory genes, such as those that modulate lymphocyte-mediated immunity and immune effector processes. Moreover, ecDNAs carrying immunomodulatory genes are associated with reduced tumour T cell infiltration. We identify ecDNAs bearing only enhancers, promoters and lncRNA elements, suggesting the combinatorial power of interactions between ecDNAs in trans. We also identify intrinsic and environmental mutational processes linked to ecDNA, including those linked to its formation, such as tobacco exposure, and progression, such as homologous recombination repair deficiency. Clinically, ecDNA detection was associated with tumour stage, more prevalent after targeted therapy and cytotoxic treatments, and associated with metastases and shorter overall survival. These results shed light on why ecDNA is a substantial clinical problem that can cooperatively drive tumour growth signals, alter transcriptional landscapes and suppress the immune system.


Conflict of interest statement

C.S. acknowledges grants from AstraZeneca, Boehringer-Ingelheim, Bristol Myers Squibb, Pfizer, Roche-Ventana, Invitae (previously Archer Dx—collaboration in minimal residual disease sequencing technologies), Ono Pharmaceutical and Personalis. C.S. is chief investigator for the AZ MeRmaiD 1 and 2 clinical trials and is the steering committee chair. C.S. is also co-chief investigator of the NHS Galleri trial financed by GRAIL and a paid member of GRAIL’s scientific advisory board (SAB). C.S. receives consultant fees from Achilles Therapeutics (also a SAB member), Bicycle Therapeutics (also a SAB member), Genentech, Medicxi, the China Innovation Centre of Roche (formerly the Roche Innovation Centre—Shanghai), Metabomed (until July 2022) and the Sarah Cannon Research Institute. C.S. has received honoraria from Amgen, AstraZeneca, Bristol Myers Squibb, GlaxoSmithKline, Illumina, MSD, Novartis, Pfizer and Roche-Ventana. C.S. has previously held stock options in Apogen Biotechnologies and GRAIL, and currently has stock options in Epic Bioscience and Bicycle Therapeutics, and has stock options and is co-founder of Achilles Therapeutics. C.S. declares patent applications on methods to detect lung cancer (PCT/US2017/028013), targeting neoantigens (PCT/EP2016/059401), identifying patient response to immune checkpoint blockade (PCT/EP2016/071471), determining HLA loss of heterozygosity (PCT/GB2018/052004), predicting survival rates of patients with cancer (PCT/GB2020/050221), identifying patients who respond to cancer treatment (PCT/GB2018/051912) and methods for lung cancer detection (US20190106751A1). C.S. is an inventor on a European patent application (PCT/GB2017/053289) relating to assay technology to detect tumour recurrence. This patent has been licensed to a commercial entity, and under their terms of employment, C.S. is due a revenue share of any revenue generated from such licence(s). N.M. has stock options in and has consulted for Achilles Therapeutics and holds European patents relating to targeting neoantigens (PCT/EP2016/059401), identifying patient response to immune checkpoint blockade (PCT/ EP2016/071471), determining HLA loss of heterozygosity (PCT/GB2018/052004) and predicting survival rates of patients with cancer (PCT/GB2020/050221). P.S.M. is a co-founder, chairs the SAB of and has equity interest in Boundless Bio. P.S.M. is also an advisor with equity for Asteroid Therapeutics and is an advisor to Sage Therapeutics. V.B. is a co-founder, consultant, SAB member and has equity interest in Boundless Bio and Abterra, and the terms of this arrangement have been reviewed and approved by the University of California, San Diego in accordance with its conflict of interest policies. H.Y.C. is a co-founder of Accent Therapeutics, Boundless Bio, Cartography Bio and Orbital Therapeutics, and is an advisor to 10X Genomics, Arsenal Biosciences, Chroma Medicine and Spring Discovery.

Figures

Fig. 1
Fig. 1. The body map of ecDNA prevalence across 39 tumour types.
a, The analysis pipeline used to process the GEL cohort (top), with representative FISH images and AmpliconArchitect structural variant (SV) views from two GEL patients (bottom). The examples show amplicons predicted to be a chromosomal amplification consistent with its FISH image (left) and an ecDNA consistent with its FISH image (right). Scale bar, 20 μm. b, Bar plot showing number of occurrences of ecDNA containing oncogenes with the colour of the bar indicating the number of cases from each tissue type. c, Body map of cancer-type-specific ecDNA prevalence. Each sub-panel shows the prevalence of ecDNA (y axis) in cancer types specific to a particular tissue type (x axis) as shown in the body map schematic. The orange dotted line represents the median ecDNA-driven amplification prevalence across the entire cohort. The error bars represent the 95% confidence interval for the population proportion. d, Stacked bar plots displaying the proportion of types of non-synonymous mutations observed in the oncogenes present on ecDNA (top) and the proportion of these non-synonymous mutations in different timing categories (bottom; Methods). Only the mutations affecting the 21 oncogenes most commonly present on ecDNA are shown. e, dN/dS analysis comparing mutations in selected oncogenes when present in chromosomal amplifications, ecDNA and in areas of the genome with no amplification. The error bars represent the 95% confidence intervals calculated using the genesetdnds from the package dNdScv. ADENO, adenocarcinoma; AST, astrocytoma; BFB, break–fusion–bridge; BLCA, bladder cancer; BRCA, breast cancer; CHO, chordoma; CHOL, cholangiocarcinoma; CNS, central nervous system; GBM, glioblastoma; GI, gastrointestinal; HPB, hepatopancreatobiliary cancer; KIRC, clear cell renal cell carcinoma; LIHC, liver hepatocellular carcinoma; LMS, leiomyosarcoma; LPS, liposarcoma; LUAD, lung adenocarcinoma; LUSC, lung squamous cell carcinoma; MELA, malignant melanoma; MFS, myxofibrosarcoma; ODG, oligodendroglioma; OPT, oropharyngeal tumour; OSA, primary conventional osteosarcoma; OVA, ovarian cancer; PAAD, pancreatic adenocarcinoma; PRAD, prostate adenocarcinoma; SCC, squamous cell carcinoma; SCLC, small cell lung cancer; STAD, stomach adenocarcinoma; TN, triple negative; UGI, upper gastrointestinal; UTER, endometrial cancer. The graphics of the Eppendorf tube in a and the body map in c were created with BioRender.com.
Fig. 2
Fig. 2. Immunomodulatory and regulatory ecDNA.
a, Schematic showing the subclasses of ecDNA used for analysis. b, Bar plots showing the proportion of patients with ecDNA carrying an oncogene defined by either the Cancer Gene Census or the Bushman cancer gene list (top) and showing the proportion of patients with each subclass of ecDNA as demonstrated in the schematic (bottom). The dashed line indicates that all ecDNAs found to carry ≥1 oncogene from the Cancer Gene Census are then further subclassified. c, Stacked bar plot showing the proportion of patients of that cancer type demonstrating ecDNA (top) and the proportion of ecDNA in that cancer type in each ecDNA subclass (bottom). d, Top: bar plot showing the total number of occurrences (y axis) of immunomodulatory genes on ecDNA (x axis). Middle: heat map showing GO terms associated with immune genes (green). Bottom: Cancer types in which the immune genes are observed to be on ecDNA; cell colour indicates the number of tumours in which they are observed. Bottom left: schematic showing proposed mechanism for immunomodulation. TH cell, T helper cell; NK cell, natural killer cell; TH, T helper. e, Violin plot showing the DNA-sequencing-inferred T cell fraction in the presence of ecDNA with oncogenes, ecDNA with immunomodulatory genes, or ecDNA with both oncogenes and immunomodulatory genes. f, Forest plot showing the OR of the increase in T cell fraction in the presence of immunomodulatory genes or oncogenic and immunomodulatory genes on ecDNA compared with oncogene-containing ecDNA, controlled for purity. The error bars represent the 95% confidence intervals of the odds ratio. CNS tumours were excluded. g, Box plots showing ecDNA copy number by ecDNA subclass. h, Bar plots showing the proportion of ecDNA categorized into the different ecDNA subclasses by tissue type (left) and the frequency of non-coding elements on the regulatory subclass of ecDNA (right). The graphics illustrating the ecDNA subclasses in a and those in the schematic in d were created with BioRender.com.
Fig. 3
Fig. 3. Correlates of genome instability and ecDNA.
a, Forest plot showing the results of a regression model that determines the odds that a tumour will have a high-impact mutation (see Supplementary Information) given the presence or absence of ecDNA or chromosomal amplifications across the entire cohort controlling for cancer type. Associations with ecDNA are represented by circles and those with chromosomal amplifications are represented by diamonds. b, Bar plot showing the proportion of tumours across the cohort with any ecDNA (blue), MDM2 ecDNA (yellow) or no ecDNA (grey) grouped by TP53 mutation status. c, Body map with panels for selected cancer types. Each panel contains a forest plot showing associations between ecDNA presence or absence with high impact tumour suppressor mutations (top); a forest plot showing associations between ecDNA presence or absence with wGII, structural variant burden and whole-genome duplication (WGD; bottom left); and a violin plot demonstrating the amplicon complexity scores for the tumours of that cancer type (bottom right). For a,c, error bars represent 95% confidence intervals for OR estimates. The graphic of the body map in c was created with BioRender.com.
Fig. 4
Fig. 4. Mutational processes and ecDNA formation.
a, Forest plot depicting the OR of an increased TMB according to the presence of ecDNA or chromosomal amplifications adjusted for purity, age and tumour type. b, Top left: the distribution of ecDNA and non-ecDNA focal amplifications in TMB windows. Top middle: forest plot showing the results of a regression model examining the associations of ecDNA and chromosomal amplifications with tumour purity, TMB, and POLD1/POLEd or MMRd status in hypermutant samples. Top right and bottom: box plots of tumour types in which the presence of ecDNA and TMB are negatively correlated. c, Forest plot showing the results of a regression model measuring the association of global SBS signatures and the presence of ecDNA in the whole cohort. For a,b,c, error bars represent 95% confidence intervals for OR estimates.
Fig. 5
Fig. 5. ecDNA and clinical outcome.
a, Forest plot showing the results of a regression model examining ecDNA presence in the context of disease stage. b, Forest plot showing the results of a regression model investigating all focal amplifications, ecDNA and non-ecDNA amplifications in the context of metastatic samples. c, Forest plot of the results of a regression analysis investigating the association of ecDNA with clinical variables adjusted for cancer type, age, sex and purity. For a,b,c, error bars represent 95% confidence intervals for OR estimates. d, Kaplan–Meier plot showing overall survival in the GEL cohort (survival data available for 14,773 patients). The error bars represent 95% confidence intervals for OR estimates. e, Forest plot showing the results of a fully adjusted Cox proportional hazards model adjusting for tumour stage, age, sex, wGII and tumour type. **, P < 0.05; ***, P < 0.001.
Extended Data Fig. 1
Extended Data Fig. 1. Overview of cohort and ecDNA characterisation methodology.
a, Schematic further demonstrating the analysis pipeline applied to the GEL cohort. Each tumour sample is subjected to whole genome sequencing, then aligned to the reference genome (hg38). This sequencing data is then analysed with CNVkit to detect areas of the genome that are amplified with high copy number. The sequencing data corresponding to these areas of amplification are then passed to as seed intervals to AmpliconArchitect which then defines a copy number and structural variant aware amplicon graph that can be decomposed into linear paths and cycles. The output from AmpliconArchitect is then passed to AmpliconClassifier which, after filtering, classifies areas of the amplicon as either breakage-fusion-bridge, ecDNA, complex non-cyclic focal amplification, or a linear focal amplification as well as performing amplicon complexity scoring. b, Schematic illustrating amplicon complexity scoring. (left) Low complexity amplicon - showing a simple graph that consists of a single segment with one cycle that explains all the amplicon copy number. (middle) Higher complexity amplicon showing a more complex graph that consists of three segments whose single cycle is only able to explain the majority of the amplicon copy number. (right) High complexity amplicon showing a graph that consists of 4 segments that can only explain the majority of the amplicon copy number with two cycles. c, Stacked bar plots for each tissue type showing the number of samples, whether treatment was received prior to biopsy, and disease stage.
Extended Data Fig. 2
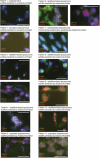
Extended Data Fig. 2. FISH of Genomics England sarcoma samples.
Images of representative fields of view from interphase FISH images for each of the 11 sarcoma tumours from the GEL cohort for which material was available. Each image is annotated with the FISH probes applied in addition to DAPI (blue) and the AmpliconArchitect prediction of the presence of either a chromosomal amplification or ecDNA. Scale bar is 20 μm.
Extended Data Fig. 3
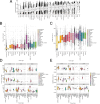
Extended Data Fig. 3. Tumour purity, ecDNA copy number, and ecDNA size.
a, Box plots showing purity estimates for each of tumour samples from the 39 cancer types in the GEL cohort. b, Box plots showing the log-transformed copy number of ecDNA grouped by tissue type. c, Box plots showing the size in megabases of ecDNA grouped by tissue type. d, Box plots of log-transformed copy number of ecDNA grouped by the oncogenes present on the ecDNA and tissue type. e, Box plots of ecDNA size in megabases grouped by the oncogenes present on the ecDNA and tissue type.
Extended Data Fig. 4
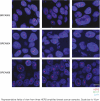
Extended Data Fig. 4. FISH of HER2+ breast cancer samples.
Images of representative fields of view from interphase FISH images for each of the 3 HER2+ breast cancers from an independent cohort for which material was available for FISH but not for WGS.
Extended Data Fig. 5
Extended Data Fig. 5. Focal amplifications and interchromosomal ecDNA.
a, (top) Boxplots of focal amplification copy number for ecDNA (red) and chromosomal amplifications (yellow) grouped by cancer type. (bottom) Violin plot of the number of ecDNA observed per tumour grouped by cancer type. b, (left) schematic demonstrating the concept of interchromosomal ecDNA. (right-top) Strip plot showing the count of interchromosomal ecDNA breakpoints for interchromosomal ecDNA (red) and non-interchromosomal ecDNA (light grey) grouped by cancer type. (right-bottom) Stacked bar plot showing the proportion of ecDNA observed for each cancer type that is interchromosomal (red) or non-interchromosomal (grey). The graphics in the schematic were created with BioRender.com. c, Heatmaps depicting chromosome pairs involved in interchromosomal ecDNA for liposarcoma, osteosarcoma, HER2+ breast cancer and luminal breast cancer.
Extended Data Fig. 6
Extended Data Fig. 6. Multi-oncogene ecDNA and multiple ecDNA per sample.
a, Bar plot showing the frequency at which one or more oncogenes are found on the same ecDNA; the yellow dotted line represents the median number of ecDNA per sample and the orange dotted line represents the mean number of ecDNA per sample. b, (left) Schematic demonstrating an ecDNA containing two or more oncogenes. (right) Heatmap showing how often pairs of oncogenes are found on the same ecDNA. Blue outlined boxes indicate potential oncogene pairs consisting of oncogenes from the same chromosome. The corresponding chromosome is labeled to the left of the blue outlined box. c, (left) Schematic demonstrating the presence of two or more oncogenes present on distinct ecDNA with in the same tumour. (middle) Pie chart showing the proportion of tumours demonstrating different oncogenes on separate ecDNA that belong to each tissue type included in the study. Grey boxes highlight specific gene pairs present in the two tissue types with the highest proportion of oncogenes present on separate ecDNA in the same tumour. (right) Heatmap showing pairs of oncogenes found on separate ecDNA in the same tumour. d, Stacked bar plot showing the proportion of oncogenes observed on ecDNA in ≥20 tumours that were found in the context of an ecDNA containing that single oncogene (yellow), in a pair of oncogenes from the same chromosome (orange), or in a pair of oncogenes from different chromosomes (brown). e, Box plots examining the copy number of pairs of oncogenes identified on distinct ecDNAs found in the same tumour (wilcoxon p value shown at the top of the plot). The graphics of the ecDNAs in b,c were created with BioRender.com.
Extended Data Fig. 7
Extended Data Fig. 7. Multi-sample ecDNA detection and ecDNA gene complement characteristics.
a, Forest plot of results of a regression model examining the detection of ecDNA in relation to the number regions sampled from the same tumour. b,Stacked bar plot showing the number of patients with ecDNA detected and multiple regions sampled from their tumour. The colours indicate whether ecDNA was detected in ≥ 1 region (but not all regions, grey) or all regions (red). c, Bar plot showing permutation testing results demonstrating an enrichment of oncogenes in focal amplifications. d, Scatterplot showing comparison of ecDNA (dark red) and chromosomal amplifications (yellow) for oncogene enrichment. The x-axis represents a sliding window that quantifies the proportion of all genes that are oncogenes at each number of recurrences in the cohort. e, Bar plots showing the mean number of oncogenes stratified by copy number. f, Bar plots showing (top) the mean number of oncogenes, (middle) the mean number of tumour suppressor genes, (bottom) the total number of genes for chromosomal amplifications and ecDNA grouped by size. Bars that are red signify ecDNA and yellow signifies chromosomal amplifications.
Extended Data Fig. 8
Extended Data Fig. 8. Oncogene frequency on ecDNA.
a, (top) Bar plot showing the frequency of amplifications of any kind (either ecDNA or chromosomal) affecting oncogenes in the GEL cohort. (middle) Box plots of copy number for oncogenes when affected by chromosomal amplifications (yellow) or ecDNA (red). (bottom) Stacked bar plot showing the proportion of amplifications for each oncogene that are chromosomal (yellow) or ecDNA (red). b, Heatmap showing oncogenes recurrently amplified (n > 18) on ecDNA by cancer type. Tissue type is indicated by the coloured bar at the top of the heatmap. The colour of each cell indicates the relative frequency of its occurrence compared to all other oncogenes on ecDNA. The total number of ecDNAs carrying a particular oncogene is displayed to the right of the heatmap before the name of the oncogene. Genes marked with an asterisk are those also present in the IntOGen database and the Cancer Gene Census. c, Scatter plots for each tissue type showing the dN/dS estimates of genes in the GEL cohort (x-axis) versus fraction of the genes subject to amplification (y-axis). Oncogenes are represented by red dots, tumour suppressor genes by yellow dots, and non-cancer genes by grey dots. “sig. amp” is an abbreviation for “significantly amplified” and “sig. dNdS” is an abbreviation for “significant by dNdSvc analysis”. Only genes significantly amplified and found significant by dN/dS analysis are annotated and are found in the top right quadrant of each subplot for a tissue type. Only tissue types with sufficient mutations and amplifications for the analysis were included.
Extended Data Fig. 9
Extended Data Fig. 9. Immunomodulatory genes and non-coding elements on ecDNA.
a, Plot showing results of an overrepresentation analysis of genes present on ecDNA that do not contain oncogenes. b, Plot showing results of an overrepresentation analysis of genes found in any focal amplification. c, Plot showing results of an overrepresentation analysis of genes found in chromosomal amplifications that do not contain oncogenes. d, Heatmap of lncRNAs found on ecDNA that do not contain protein coding genes. e, Box plot showing the copy number of enhancer-only ecDNAs present in a sample without oncogene containing ecDNA and the copy number of enhancer-only ecDNAs present in a sample that also contains a separate oncogene carrying ecDNA. f, Boxplots showing the number of non-coding elements per megabase in ecDNA with oncogenes and ecDNA with only regulatory ecDNA. g, Box plots showing comparisons of (left) the amplicon complexity, (middle) ecDNA copy number count, (right) ecDNA size in megabases in enhancer only ecDNA versus ecDNA containing oncogenes.
Extended Data Fig. 10
Extended Data Fig. 10. Mutational processes associated with focal amplifications.
dN/dS analysis of all genes across the cohort. Tumour samples were categorised by whether they were found to contain ecDNA, chromosomal amplifications, or no amplifications. dN/dS analysis was then performed in these subcategories for each cancer type. a, Stacked bar plot showing the total number of categories across all cancer types for which a gene was found to be under positive selection. Colours represent the combination of subcategories in which the gene was found to be under positive selection for a cancer type. b, Heatmap showing for each gene which cancer types it was found to be under positive selection and in which subcategories of tumour samples defined by the presence or absence of ecDNA and chromosomal amplifications. c, Box plots showing comparison of TMB between samples with ecDNA (dark red), only chromosomal amplifications (yellow), or no focal amplifications of any kind (blue). Dashed line represents the median TMB per category. d, (top) Schematic illustrating the method of comparing SBS signatures in focal amplifications, either chromosomal or ecDNA, with those in flanking regions as well as with global signatures. (bottom) Plots demonstrating SBS enrichments. e, Schematic illustrating method of timing mutations in areas of the genome amplified by ecDNA. f, Scatter plot showing relative changes in SBS signature probability pre and post ecDNA formation. g, Schematic illustrating a case with a post-temozolomide treatment SBS11 mutational signature of mutations present on ecDNA in a tumour that also has an early EGFR mutation also present on the same ecDNA. h, Bar plot showing the number of metastatic samples per cancer type and which cancer types were included in the regression model.

Similar articles

Cited by

References

    1. Verhaak, R. G. W., Bafna, V. & Mischel, P. S. Extrachromosomal oncogene amplification in tumour pathogenesis and evolution. Nat. Rev. Cancer19, 283–288 (2019). - PMC - PubMed
    1. Yan, X., Mischel, P. & Chang, H. Extrachromosomal DNA in cancer. Nat. Rev. Cancer24, 261–273 (2024). - PubMed
    1. Turner, K. M. et al. Extrachromosomal oncogene amplification drives tumour evolution and genetic heterogeneity. Nature543, 122–125 (2017). - PMC - PubMed
    1. Kim, H. et al. Extrachromosomal DNA is associated with oncogene amplification and poor outcome across multiple cancers. Nat. Genet.52, 891–897 (2020). - PMC - PubMed
    1. Lange, J. T. et al. The evolutionary dynamics of extrachromosomal DNA in human cancers. Nat. Genet.54, 1527–1533 (2022). - PMC - PubMed

MeSH terms

LinkOut - more resources