. 2024 Nov;635(8037):210-218.
doi: 10.1038/s41586-024-07802-5. Epub 2024 Nov 6.

Enhancing transcription-replication conflict targets ecDNA-positive cancers

Affiliations

Enhancing transcription-replication conflict targets ecDNA-positive cancers

Jun Tang et al. Nature. 2024 Nov.

Abstract

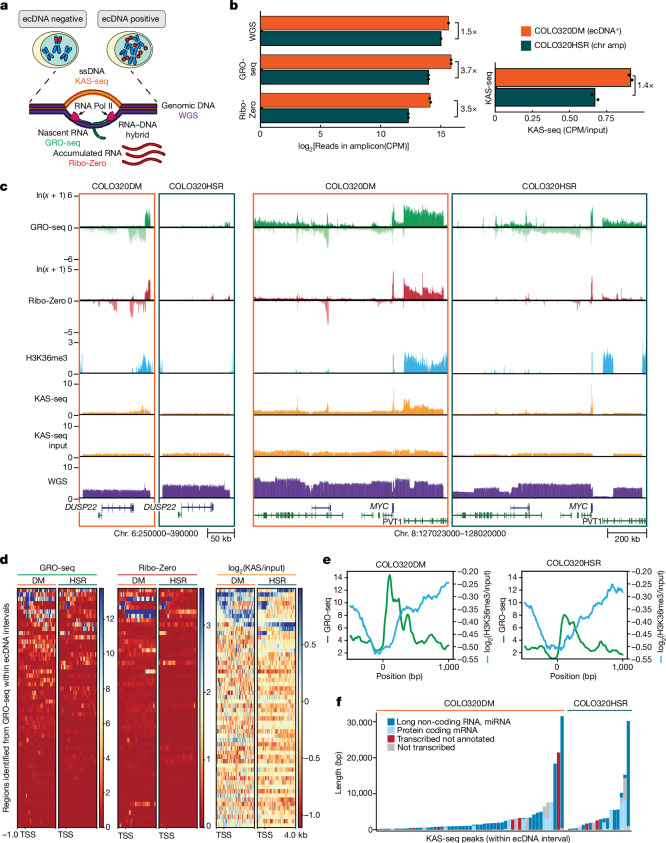
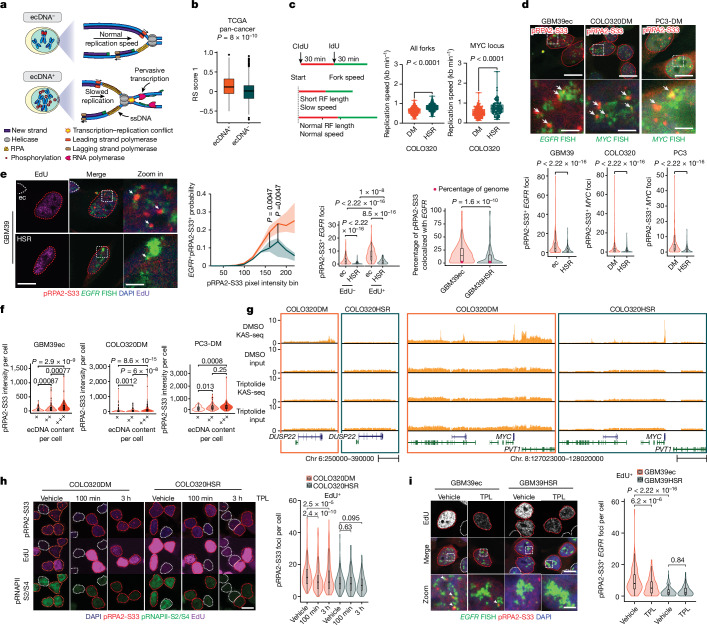
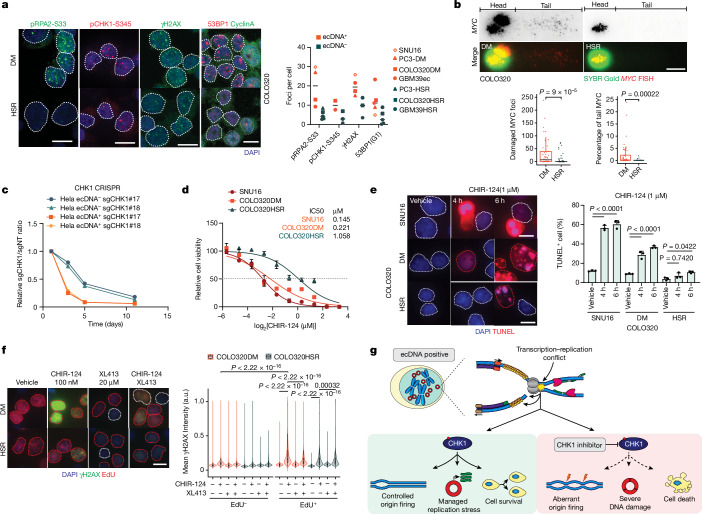
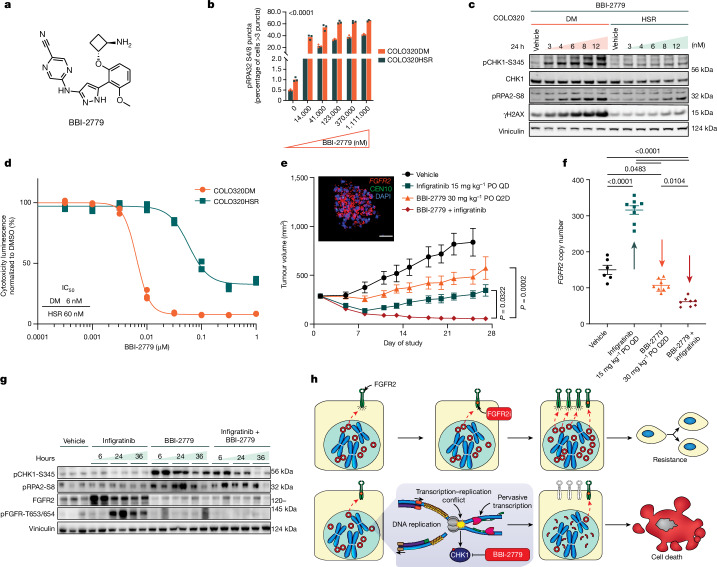
Extrachromosomal DNA (ecDNA) presents a major challenge for cancer patients. ecDNA renders tumours treatment resistant by facilitating massive oncogene transcription and rapid genome evolution, contributing to poor patient survival1-7. At present, there are no ecDNA-specific treatments. Here we show that enhancing transcription-replication conflict enables targeted elimination of ecDNA-containing cancers. Stepwise analyses of ecDNA transcription reveal pervasive RNA transcription and associated single-stranded DNA, leading to excessive transcription-replication conflicts and replication stress compared with chromosomal loci. Nucleotide incorporation on ecDNA is markedly slower, and replication stress is significantly higher in ecDNA-containing tumours regardless of cancer type or oncogene cargo. pRPA2-S33, a mediator of DNA damage repair that binds single-stranded DNA, shows elevated localization on ecDNA in a transcription-dependent manner, along with increased DNA double strand breaks, and activation of the S-phase checkpoint kinase, CHK1. Genetic or pharmacological CHK1 inhibition causes extensive and preferential tumour cell death in ecDNA-containing tumours. We advance a highly selective, potent and bioavailable oral CHK1 inhibitor, BBI-2779, that preferentially kills ecDNA-containing tumour cells. In a gastric cancer model containing FGFR2 amplified on ecDNA, BBI-2779 suppresses tumour growth and prevents ecDNA-mediated acquired resistance to the pan-FGFR inhibitor infigratinib, resulting in potent and sustained tumour regression in mice. Transcription-replication conflict emerges as a target for ecDNA-directed therapy, exploiting a synthetic lethality of excess to treat cancer.


Conflict of interest statement

H.Y.C., P.S.M. and V.B. are each a co-founder, advisor and have an equity interest in Boundless Bio. H.Y.C. is also a co-founder of Accent Therapeutics, Cartography Biosciences and Orbital Therapeutics, and an advisor of 10x Genomics, Arsenal Biosciences, Chroma Medicine, Exai Bio and Spring Discovery. S.J.B. is also an advisor and has an equity interest in Boundless Bio. S.C., E.T., S.G.M., R.H., J.P., A.S., S.M., S.T.M., A.B.P., S.K. and C.A.H. are employees of Boundless Bio. V.B. is a co-founder, consultant, SAB member and has equity interest in Abterra and Boundless Bio, and the terms of this arrangement have been reviewed and approved by the University of California, San Diego in accordance with its conflict-of-interest policies. J.L. previously provided consulting services to Boundless Bio. The remaining authors declare no competing interests.

Figures

Fig. 1
Fig. 1. Pervasive transcription on ecDNA drives ssDNA accumulation.
a, Schematic of relevant genomic assays. b, Read density of genomic assays in COLO320DM and COLO320HSR in total counts per million (CPM) within the ecDNA intervals (amplicon boundaries defined in Extended Data Fig. 1). KAS-seq read density is shown as CPM of the KAS-seq relative to CPM of the input of total DNA after fragmentation but before biotin enrichment for ssDNA signals. The mean of two biological replicates is shown for GRO-seq, Ribo-Zero and KAS-seq; a single replicate is shown for WGS. c, Genome tracks highlighting two regions within the ecDNA interval. H3K36me3 chromatin immunoprecipitation followed by sequencing (ChIP–seq) is displayed as log2 of input-normalized coverage. d, Metagene heatmap plot visualization of GRO-seq, Ribo-Zero RNA sequencing (RNA-seq) and log2 of input-normalized coverage of KAS-seq within the ecDNA interval. All plots are anchored at the transcription start site (TSS) of combined transcribed regions as identified by HOMER using both biological replicates of GRO-seq in COLO320DM and COLO320HSR. e, Metagene plot showing GRO-seq and H3K36me3 ChIP–seq coverage within the ecDNA interval. All plots are anchored at the GRO-seq TSS as identified by HOMER using both biological replicates. H3K36me3 ChIP–seq coverage is displayed as log2(H3K36me3/input). f, KAS-seq peaks from two biological replicates in the ecDNA interval annotated by transcription status according to GRO-seq data and annotation status according to Gencode v.43. One representative biological replicate for each condition is visualized for c, d and e. chr amp, chromosomal amplification; RNA Pol II, RNA polymerase II.
Fig. 2
Fig. 2. Transcription–replication conflict creates RS on ecDNAs.
a, Schematics depicting transcription–replication conflict and RS. b, RS score 1 computed in TCGA patients grouped by ecDNA amplification status (n: 232, 582). c, DNA-fibre assay combined with MYC FISH in COLO320DM and COLO320HSR cells. Replication fork (RF) progression rate was measured globally (middle) or at the MYC locus (right) (box whiskers indicate min. to max.; n: 348, 317, 143, 101). d, Replication protein A phosphorylation: pRPA2-S33 IF combined with EGFR or MYC DNA FISH to show higher RS on ecDNA (n: 370, 274, 939, 568, 209, 244). e, pRPA2-S33 IF combined with EGFR FISH with 5-ethynyl-2′-deoxyuridine (EdU) added for 30 min; nuclei were co-stained by DAPI. Left, representative images. Second left, proportion of pixels with colocalization within each pRPA2-S33 pixel intensity bin (shade indicates median ± 25% quantile range, n: 10, 6). Second right, colocalization foci number (n: 267, 194, 104, 75). Right, percentage of pRPA2-S33 colocalized with EGFR (n: 371, 269). Red dot indicates percent of genome taken up by amplicon as calculated by WGS counts. f, Comparison of RS in tumour cells with different ecDNA content grouped by total DNA FISH intensity (GBM39ec, n: 111, 148, 111; COLO320DM, n: 282, 375, 282; PC3: 63, 83, 63). g, Genome tracks highlighting two regions within the ecDNA interval in COLO320 cells treated with triptolide or vehicle. h,i, Triptolide (TPL) treatment decreased RS on ecDNA in COLO320 (h) and GBM39 (i) cells (COLO320DM/HSR cells, n: 354, 350, 269, 130, 185, 161; GBM39ec/HSR cells, n: 139, 191, 264, 222). Boxplots bi indicate centre line, median; limits, 25–75 quartiles; whiskers, 1.5× interquartile range or as otherwise specified. df,hi were presented as violin plot and boxplot. Violin plot outlines kernel probability density. P determined by two-sided Wilcoxon test except unpaired Kolmogorov–Smirnov test in Fig. 2c. Scale bar, 10 µm (d (top row), e (left), h, i (top)), 2 µm (d (bottom row), e (right), i (bottom)), 50 kb (g (left)), 200 kb (g (right)).
Fig. 3
Fig. 3. RS activated S-phase checkpoint and generated vulnerability to CHK1 inhibition in ecDNA-containing tumour cells.
a, Detection of pRPA2-S33, γH2AX, pCHK1-S345 and 53BP1/cyclin A in multiple cancer cell lines with different ecDNA amplification status. Left, representative images in COLO320DM and COLO320HSR cells. Right, mean foci number in individual cell lines. Line indicates median; every dot indicates mean foci number in each cell line. b, Comet-FISH assay in COLO320DM and COLO320HSR cells. Top, representative images. Bottom left, MYC foci number in tail. Bottom right, percentage of MYC in comet tail (two-sided Wilcoxon test, n: 47, 60, 49, 33). c, Relative cell number of Hela ecDNA+ and Hela ecDNA cells transduced with sgRNAs targeting CHK1 normalized to cells transduced with non-targeted (NT) sgRNA over time. d, Cell viability curves of SNU16, COLO320DM and COLO320HSR in response to CHIR-124 for three days (n = 4, mean ± s.d.). e, TUNEL assay in cells subjected to CHIR-124 for indicated time (mean ± s.d., ordinary one-way ANOVA with multiple comparison test, n = 3). f, γH2AX IF in COLO320DM and COLO320HSR cells treated with CHIR-124 with or without the combination of CDC7i (XL413), with EdU added for 30 min. Left, representative images; red lines mark EdU+ and white lines mark EdU nuclei. Right, mean γH2AX intensity (arbitrary units). EdU, n: 3,074, 4,246, 3,291, 4,742, 3,101, 3,770, 2,608, 2,091; EdU+, n: 2,428, 2,859, 2,909, 2,890, 3,346, 3,491, 3,232, 2,060; two-tailed Student’s t-test. g, Schematics depicting CHK1 activation in response to RS, which sensitizes ecDNA-containing tumour cells to targeted CHK1i through unscheduled replication origin firing and accumulation of excessive DNA damage, leading to cell death. Parameters for boxplots b,f and violin plot f are the same as Fig. 2 or as otherwise specified. Scale bar, 10 µm (a,e,f), 20 µm (b). a.u., arbitrary units.
Fig. 4
Fig. 4. Oral CHK1i in combination with a pan-FGFRi demonstrates synergistic antitumour activity and inhibits acquired resistance to targeted therapy manifested by ecDNA.
a, Chemical structure of BBI-2779. b,c, Dose-dependent induction of RS and associated biomarkers measured by phosphorylated RPA32 Ser8 level using IF (b) and immunoblotting (c). For b, significance determined using ordinary two-way ANOVA, n = 3. d, Differential tumour cell antiproliferation activity of BBI-2779 in COLO320DM and HSR cells (n = 3). e, Embedded FISH image of SNU16 cells demonstrating FGFR2+ ecDNA. SNU16 cells were grown as tumour xenografts in mice. After tumour establishment (approximately 285 mm3), mice were treated with vehicle, BBI-2779 (30 mg kg−1), infigratinib (15 mg kg−1) or BBI-2779 (30 mg kg−1) plus infigratinib (15 mg kg−1) for 25 days (vehicle) or 27 days (other arms). Mean tumour volumes ± s.e.m. are shown (n = 8 mice per group). f, FGFR2 copy number was evaluated by quantitative polymerase chain reaction (qPCR) on tumour DNA. Significance was determined by one-way ANOVA with Tukey’s multiple comparisons. g, Immunoblots of tumour lysates measuring elevated RS, DNA damage and abrogation of oncoprotein FGFR2 expression (n = 3/8 mice per group). h, ecDNA-amplified oncogenes are hypertranscribed, resulting in elevated RS and reliance on CHK1 to manage DNA replication to maintain oncoprotein overexpression and proliferation. CHK1i results in uncontrolled origin firing and failed cell cycle checkpoints, exacerbating RS in ecDNA-enabled tumour cells. Synthetic lethality to CHK1i in ecDNA+-oncogene-amplified tumour cells is synergistic with targeted therapy resulting in enhanced cytotoxicity. Scale bar, 10 µm. PO, oral; QD, once-daily; Q2D, every other day. Source Data
Extended Data Fig. 1
Extended Data Fig. 1. Characterization of isogenic cell line pairs.
(a-c) The structure of one dominant ecDNA detected in COLO320DM (a), GBM39ec (b) and PC3-DM (c). COLO320DM ecDNA reconstruction is adapted from Hung, et al. Nature 2021 using hg38 coordinates; GBM39ec ecDNA reconstruction is adapted from Turner, et al. Nature 2017 using hg38 coordinates; PC3-DM ecDNA was reconstructed by short-read WGS aligned to hg38, capturing the MYC-containing genome cycle identified by AmpliconArchitect. Some complexities of the PC3 DM ecDNA may not be captured from short read sequencing alone. (d) Amplicon similarity analysis of 3 near-isogenic cell line pairs as computed from whole genome sequencing data. Major oncogene copy number was extracted for individual cell line: COLO320 pairs: MYC; GBM39 pairs: EGFR; PC3: MYC. (e) Genomic intervals in COLO320 and GBM39 cells used in this study for ecDNA amplicons. (f) Representative metaphase-FISH images of PC3-DM and PC3-HSR cells confirming MYC gene amplification on ecDNA and chromosome respectively. For each clone, about 6–15 metaphase spread images were collected from a one-off validation experiment to check amplicon status. Scale bar: 10 µm (g) Amplicon structure and absolute gene copy of MYC between PC3-DM and PC3-HSR based on WGS. (h) Comparison of STR profiles between PC-3 from ATCC, PC3-DM and PC3-HSR.
Extended Data Fig. 2
Extended Data Fig. 2. Similar levels of transcription and ssDNA accumulation on normal chromosome 1 of COLO320 cell lines.
(a) Read density of genomic assays in COLO320DM and COLO320HSR in total counts per million (CPM) on chromosome 1, which is outside of ecDNA intervals. KAS-seq read density is shown as (CPM) of the KAS-seq relative to CPM of the input. The mean of two biological replicates is shown for GRO-seq, Ribo-Zero and KAS-seq; a single replicate is shown for WGS. (b) Metagene heatmap plot visualization of GRO-seq, Ribo Zero RNA-seq, log2 of input-normalized H3K36me3 ChIP-seq, and log2 of input-normalized coverage of KAS-seq within chromosome 1. All plots are anchored at the GRO-seq TSS as identified by HOMER. One representative biological replicate for each condition is visualized. (c) Stacked bar charts of read density in total counts per million (CPM) of GRO-seq and Ribo-Zero in COLO320DM and COLO320HSR across all chromosomes.
Extended Data Fig. 3
Extended Data Fig. 3. H3K36me3 and KAS-seq signals within the ecDNA interval of COLO320 cell lines.
(a) Metagene heatmap plot visualization of log2 of input-normalized H3K36me3 ChIP-seq within the ecDNA interval. Plots are anchored at the GRO-seq TSS as identified by HOMER. One representative biological replicate for each cell line is visualized. (b) Accumulative bar plots of length distributions of all KAS-seq peaks identified within the ecDNA interval classified by GRO-seq transcription status and Gencode v43 annotation. Two biological replicates were used per cell line.
Extended Data Fig. 4
Extended Data Fig. 4. RS on ecDNA with different amplification sequence in different tumour cells.
(a) RS score 2 computed in TCGA patients grouped by ecDNA amplification status (232 ecDNA positive, 582 ecDNA negative, two-sided Wilcoxon test. Boxplot parameter same as in Fig. 2b). (b) Left: Representative images of pRPA2-S33 immunofluorescence staining in 3 isogenic tumour cell line pairs. Right, pRPA2-S33 foci number in individual cells, each dot indicated one cell. (Median with 95% CI, ordinary one-way ANOVA with multiple comparisons test, n, 666, 205, 1191, 369, 244, 655, 244, 1505, 775). (c) Quantification of images in Fig. 2e, left: total pRPA2-S33 foci/cell; right: % of EGFR co-localized with pRPA2-S33. (Box plot parameters same as in Fig. 2b, Two-tailed Wilcoxon test, EdU- group: GBM39ec, n = 244, GBM39HSR, n = 143; EdU+ group: GBM39ec, n = 104, GBM39HSR, n = 72). (d) pRPA2-S33 immunofluorescence combined with MYC FISH staining in COLO320DM and COLO320HSR cells. Left: representative images. Middle: % of MYC colocalized with pRPA2-S33. Right: % of pRPA2-S33 that colocalized with MYC, red dot indicated % of genome that taken by amplicon as calculated by WGS counts in each cell line. (Data was presented as violin plot with the addition of boxplot. Violin plot outlines kernel probability density and boxplot parameters same as in Fig. 2b, Two-tailed Wilcoxon test COLO320DM, n = 939; COLO320HSR, n = 568). (e) pRPA2-S33 immunofluorescence combined with MYC FISH staining in PC3-DM and PC3-HSR cells, with EdU added 30 min before fixation. Left: representative images. 2nd left: pRPA2-S33 foci number. 2nd right: colocalized foci number between pRPA2-S33 and MYC FISH. Right: percentage of MYC co-localized with pRPA2-S33. (Box plot parameters were the same as in Fig. 2b, two-tailed Wilcoxon test, EdU+ group: PC3-DM, n = 81, PC3-HSR, n = 58; EdU- group: PC3-DM, n = 128, PC3-HSR, n = 184). (Scale bar represents 10 µm or as otherwise specified).
Extended Data Fig. 5
Extended Data Fig. 5. Transcription replication conflict drives replication stress in ecDNA containing tumour cells.
(a) Mean pRNAPolII S2/S4 fluorescence intensity (arbitrary units) was measured in datasets shown in Fig. 2h. (Box plot parameters were the same as in Fig. 2b, two-tailed Wilcoxon test, n: 354, 350, 269, 130, 185, 161). (b) Quantification of dataset shown in Fig. 2i. left, pRPA2-S33 and EGFR colocalized foci number; right, percentage of EGFR colocalized with pRPA2-S33. (Box plot parameters were the same as in Fig. 2b, two-tailed Wilcoxon test, sample size from left to right: n = 280, 256, 332, 348, 138, 189, 253, 208) (c) pRPA2-S33 IF combined with MYC FISH staining in COLO320DM and COLO320HSR cells treated with XL413 (10 µM) for indicated time, EdU was added 30 min before fixing. Left, representative images in COLO320DM cells, middle, quantification of pRPA2-S33 and MYC DNA FISH co-localized foci in EdU+ cells; right, Mean EdU intensity normalized to vehicle treated cells in each group. (Two-tailed Wilcoxon test, sample number from left to right: 1835, 1241, 1195, 2578, 990, 1068). (d) pRPA2-S33 IF combined with EGFR FISH staining in GBM39ec and GBM39HSR cells treated with XL413 (10 µM) for indicated time, EdU was added 30 min before fixing. Left, quantification of pRPA2-S33 and MYC DNA FISH co-localized foci in EdU+ cells; right, Mean EdU intensity (arbitrary units) in EdU+ cells. (Two-tailed Wilcoxon test, sample number from left to right: 431, 494, 603, 674, 820, 829). (plots c-d were presented as violin plot with the addition of boxplot. Violin plot outlines kernel probability density and boxplot parameters same as in Fig. 2b. Scale bar represents 10 µm or as otherwise specified).
Extended Data Fig. 6
Extended Data Fig. 6. Transcription within the ecDNA interval of GBM39 cell lines.
(a) Read density of genomic assays in GBM39ec and GBM39HSR within the ecDNA interval in total counts per million (CPM). The mean of two biological replicates is shown for GRO-seq, Ribo-Zero and KAS-seq; a single replicate is shown for WGS. (b) Genome tracks highlighting the GBM39 ecDNA interval. One representative biological replication for each condition is visualized. (c) Genome tracks highlighting the increased transcription at EGFR-AS1 in GBM39ec compared to GBM39HSR. One representative biological replication for each condition is visualized.
Extended Data Fig. 7
Extended Data Fig. 7. RS induces DNA lesions and activates S phase check point in ecDNA containing tumour cells.
(a) pCHK1-S345 staining in 2 isogenic cell line pairs, with EdU added for 30 min. Left, representative images, red dotted lines mark EdU+ and white dotted lines mark EdU- nuclei; right, quantification of pCHK1 foci number. (mean± SD, two tailed Mann-Whitney test, n: 97, 192, 566, 339, 267, 252, 610). For COLO320HSR the same image is shown in Fig. 3a; they are used here to compare against multiple cell lines. (b) γH2AX staining in cell line panels with or without ecDNA. Left, representative image; right, quantification of γH2AX foci number per cell. (mean± SD, Ordinary one-way ANOVA with multiple comparison test, n: 402, 362, 499, 101, 388, 418, 80) (c) 53BP1 combined with CyclinA staining in cell line panels with or without ecDNA. Left, representative image. White dotted lines mark G1 phase cells (CyclinA-). Right, quantification of 53BP1 in G1 phase cells. (mean± SD, Ordinary one-way ANOVA with multiple comparison test, n, 180, 277, 240, 146, 126, 211, 188, 163, 221, 494). For COLO320DM and COLO320HSR the same images are shown in Fig. 3a; they are used here to compare against multiple cell lines. (d) γH2AX IF combined with MYC FISH staining in COLO320DM and COLO320HSR cells. Left: representative images. Middle, γH2AX and MYC colocalized foci number, right, percentage of MYC colocalized with γH2AX. (mean± SD, two-tailed Mann-Whitney test, sample size, n, 804, 411). (e) γH2AX IF combined with EGFR FISH staining in GBM39ec and GBM39HSR cells. Left, representative image. Middle, γH2AX and EGFR colocalized foci number, right, percentage of EGFR colocalized with γH2AX. (mean± SD, two tailed Mann-Whitney test, sample size, GBM39ec, n = 1638; GBM39HSR, n = 1863). (f) Quantification of percentage of tail DNA content with the dataset shown in Fig. 3b. (Box plot parameters were same as in Fig. 2b, two-tailed Wilcoxon test, COLO320DM, n = 49, COLO320HSR, n = 33). (Scale bar represents 10 µm or specified).
Extended Data Fig. 8
Extended Data Fig. 8. ecDNA containing tumour cells are sensitive to targeted CHK1 inhibition.
(a-e) Cell viability curve of COLO320DM, COLO320HSR, GBM39ec, GBM39HSR and SNU16 in response to different chemicals targeting CHK1 or CHK2. a. CHK2i, CCT241533; b. CHK1i, GDC0575; c. CHK1i, SRA737; d, CHK1i, CHIR-124; e, CHK1i, Ly2606368. Half maximal inhibitory concentrations (IC50) for each inhibitor in individual cell lines were listed on the bottom. (sample size in a-c, n = 2; d-e, n = 4, mean ± SD) (f) FACS analysis of Annexin V staining in COLO320DM and COLO320HSR cells subjected to 1 µM CHIR-124 for indicated time. Left, gating setting and representative plots, Early apoptotic cells: Annexin V + and PI-; late apoptotic cells: Annexin V + and PI +. Right, % of apoptotic cells (mean± SEM, P values quantified by two-tailed students’ t test, n = 2.) (g) Quantification of mean EdU intensity (arbitrary units) in dataset shown in Fig. 3f. (mean± SD, P values quantified by two-tailed students’ t test. Sample size from left to right: n = 419, 284, 1085, 596, 209, 242). (h) pRPA2-S33 IF combined with MYC FISH staining in COLO320DM and COLO320HSR cells treated with 100 nM CHIR-124 for 2 h, EdU was added 30 min before fixing. Accumulation of further RS upon CHK1i was quantified by total pRPA2-S33 fluorescence intensity in EdU+ cells. COLO320DM and COLO320HSR cells were grouped into 3 subgroups with different amplicon content based on MYC DNA FISH staining. (Box plot parameters were same as in Fig. 2b, two-tailed Wilcoxon test, Two-tailed Wilcoxon test, sample number from left to right: 355, 337, 466, 315; 472, 448, 622, 420; 354, 337, 466, 315).
Extended Data Fig. 9
Extended Data Fig. 9. BBI-2779 has optimal PK exposure in mice.
Plasma concentration time curve of BBI-2779 in mouse administered either intravenously (IV) at 2 mg kg1 or orally (PO) at 30 mg/kg1. Data are mean ± s.e.m., n = 3 per group. Source Data
Extended Data Fig. 10
Extended Data Fig. 10. Targeted therapeutic resistance shaped by intracellular ecDNA -driven oncogene amplification.
(a) FGFR2 (red) FISH imaging of cells in metaphase demonstrate amplification of FGFR2 oncogene on ecDNA in SNU16 cells. Nuclear staining is illustrated using DAPI (blue). Representative FISH image from multiple independent cytogenetic analysis with similar results. Scale bar represents 10 µm. (b) Timeline of experimental overview. After 8 weeks of infigratinib treatment (EC50 dose of 25 nM), cells were assessed for infigratinib resistance. A 3-day Cell Titer Glo reveals resistance in SNU16 cells treated with infigratinib (n = 2 biologically independent samples). (c) qPCR based quantification of FGFR2 oncogene numbers after 8 weeks of infigratinib treatment showing SNU16 cells resistant to infigratinib with significant increase in FGFR2 target selection/amplification (qPCR data represents n = 1 biological sample. Multiple repeat analysis reveal similar results). (d) Western blotting illustrating enhanced expression of FGFR signaling pathways involved in therapeutic resistance (Protein data represents n = 1 biological sample. Multiple repeat analysis reveal similar results). Lane 1 (control) is from a non-contiguous portion of the gel from lanes 2 and 3 (infigratinib treated samples). Source Data

References

    1. Kim, H. et al. Extrachromosomal DNA is associated with oncogene amplification and poor outcome across multiple cancers. Nat. Genet.52, 891–897 (2020). - PMC - PubMed
    1. Turner, K. M. et al. Extrachromosomal oncogene amplification drives tumour evolution and genetic heterogeneity. Nature543, 122–125 (2017). - PMC - PubMed
    1. Luebeck, J. et al. Extrachromosomal DNA in the cancerous transformation of Barrett’s oesophagus. Nature616, 798–805 (2023). - PMC - PubMed
    1. Levan, A. & Levan, G. Have double minutes functioning centromeres? Hereditas88, 81–92 (1978). - PubMed
    1. Lange, J. T. et al. The evolutionary dynamics of extrachromosomal DNA in human cancers. Nat. Genet.54, 1527–1533 (2022). - PMC - PubMed

MeSH terms