. 2024 Dec;12(6):e1256.
doi: 10.1002/prp2.1256.

Pharmacokinetics and brain uptake of sodium selenate and selenium in naïve rats and a lateral fluid percussion injury rat model

Affiliations

Pharmacokinetics and brain uptake of sodium selenate and selenium in naïve rats and a lateral fluid percussion injury rat model

Chenxu Li et al. Pharmacol Res Perspect. 2024 Dec.

Abstract

Post-traumatic epilepsy (PTE) is a life-long complication of traumatic brain injury (TBI). The development of PTE is associated with neurological morbidity and increases the risk of mortality. An aim of EpiBioS4Rx (Epilepsy Bioinformatics Study for Antiepileptogenic Therapy) was to test potential therapies to prevent the development of PTE in the lateral fluid percussion injury (LFPI) rat model of TBI, in which rats were subjected to injury at the left parietal cortex. Sodium selenate has been reported to be antiepileptogenic post-TBI in rodent models by activating protein phosphatase 2A and reducing phosphorylated tau (p-tau) protein. We aimed to characterize the pharmacokinetics (PK) and brain uptake of sodium selenate using naïve control and LFPI rats. Rats received either a single bolus dose or a single bolus dose followed by a 7-day subcutaneous minipump infusion of sodium selenate. Sodium selenate and selenium concentrations in plasma and brain were analyzed and used for PK estimation and brain exposure assessment. Selenium concentrations rapidly increased after sodium selenate administration, demonstrating biotransformation from sodium selenate to selenium. Sodium selenate and selenium PK parameters were estimated using non-compartmental analysis. Sodium selenate clearance (CL/F) and volume of distribution (Vd/F) varied by dose and route of administration, suggesting differences in bioavailability and nonlinear pharmacokinetics at the doses tested. Brain-to-plasma partition coefficients (AUCbrain/AUCplasma) for sodium selenate and selenium were found to be 0.7-1.3 and 0.1-0.3 following single-dose injection, respectively, indicating active transport of sodium selenate across the blood-brain barrier (BBB).

Keywords: antiepileptogenesis; blood–brain barrier; pharmacokinetics; post‐traumatic epilepsy; traumatic brain injury.


Conflict of interest statement

SL Moshé is the Charles Frost Chair in Neurosurgery and Neurology and partially funded by grants from NIH U54 NS100064 (EpiBioS4Rx), RO1‐NS43209 and RO1‐NS127524, US Department of Defense (W81XWH‐22‐1‐0510, W81XWH‐22‐1‐0210), a pilot grant from the NICHD center grant (P50 HD105352) for the Rose F. Kennedy Intellectual and Developmental Disabilities Research Center (RFK‐IDDRC), and the Heffer Family and the Segal Family Foundations, the Isabelle Rapin and Harold Oaklander Child Neurology Research Fund in the Isabelle Rapin Child Neurology Division, and the Abbe Goldstein/Joshua Lurie and Laurie Marsh/Dan Levitz families. He is on the editorial board of Brain and Development, Pediatric Neurology, Annals of Neurology, MedLink, and Physiological Research. He receives compensation from MedLink for his work as Associate Editor; and royalties from books he co‐edited. AS Galanopoulou received grant support from the NINDS U54 NS100064 (EpiBioS4Rx), NINDS R01 NS127524, a pilot grant from NICHD center grant (P50 HD105352) for the Rose F. Kennedy Intellectual and Developmental Disabilities Research Center (RFK‐IDDRC), US Department of Defense (W81XWH‐22‐1‐0510, W81XWH‐22‐1‐0210), the Heffer Family and the Segal Family Foundations, the Isabelle Rapin and Harold Oaklander Child Neurology Research Fund in the Isabelle Rapin Child Neurology Division, and the Abbe Goldstein/Joshua Lurie and Laurie Marsh/Dan Levitz families. AS Galanopoulou is the Editor‐in‐Chief of Epilepsia Open and associate editor of Neurobiology of Disease and receives royalties from Elsevier, Wolters Kluwer, and Medlink for publications. TJ O'Brien is funded by grants from NINDS U54 NS100064 (EpiBioS4Rx), NINDS R01 NS127524, as well as the DOD, an Investigator Grant from the Australian Government funding agencies NHMRC (Investigator Grant APP1176426) and MRFF. His institution has received commercial funding for consultancies, research collaborations, and speaker fees from Eisai, UCB, Livanova, BioGen, Lario, ES Therapeutics and Kinosis Therapeutics. PM Casillas‐Espinosa is supported by a Future Leader Fellowship, research grants from the National Health and Medical Research Council (APP2013629), the Medical Research Future Fund (MRFF) stem cell therapy missions grant (MRF1201781) and the Department of Defense USA Epilepsy Research Program (DOD ERP and RPA grants). Outside the submitted work, PMCE has received research grants from CSIRO, Data61, Supernus Pharmaceuticals, Praxis, Eisai, and Kaoskey. PM Casillas‐Espinosa declares no conflict of interest with the current work.

Figures

FIGURE 1
FIGURE 1
Schematic representation of animal study design (Created with BioRender.com). (A): Single‐dose injection pharmacokinetics study. Naïve rats were administered either single s.c. injection of 0.04 mg/kg or 0.2 mg/kg sodium selenate or single i.p. injection of 1 mg/kg sodium selenate, followed by sample collection and analysis; (B): Single loading dose with 7‐day minipump infusion pharmacokinetics study. Naïve or LFPI rats received single s.c. injection of 0.04 mg/kg sodium selenate and a 7‐day s.c. minipump infusion of sodium selenate, followed by sample collection and analysis.
FIGURE 2
FIGURE 2
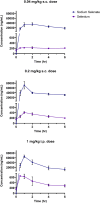
Sodium selenate and selenium plasma concentrations following single‐dose administration of sodium selenate in naïve rats. The upper line (with circles) indicates the mean (SD) sodium selenate plasma concentration following single‐dose (0.04 mg/kg s.c., or 0.2 mg/kg s.c., or 1 mg/kg i.p.) administration of sodium selenate; while the lower line (with squares) represents the mean (SD) selenium plasma concentration following single‐dose (0.04 mg/kg s.c., or 0.2 mg/kg s.c., or 1 mg/kg i.p.) administration of sodium selenate. n = 1 to 5/group/time point.
FIGURE 3
FIGURE 3
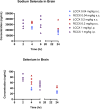
Sodium selenate and selenium brain concentrations following single‐dose administration of sodium selenate in naïve rats. In both figures, circles represent drug concentrations in the left cerebral cortex, and triangles represent drug concentrations in the right cerebral cortex. Different colors indicate drug concentrations after different dosing regimens: Blue indicates a 0.04 mg/kg s.c. dose, red indicates a 0.2 mg/kg s.c. dose, and purple indicates a 1 mg/kg i.p. dose.
FIGURE 4
FIGURE 4
Sodium selenate and selenium mean brain‐to‐plasma concentration ratios following single‐dose administration of sodium selenate in naïve rats. In both figures, circles represent brain‐to‐plasma ratios in the left cerebral cortex, and triangles represent brain‐to‐plasma ratios in the right cerebral cortex. Different colors indicate brain‐to‐plasma ratios after different dosing regimens: Blue indicates a 0.04 mg/kg s.c. dose, red indicates a 0.2 mg/kg s.c. dose, and purple indicates a 1 mg/kgi.p. dose.
FIGURE 5
FIGURE 5
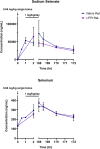
Sodium selenate and selenium concentrations in plasma following single 0.04 mg/kg s.c. loading dose and 7‐day 1 mg/kg/day s.c. drug delivery regimen in naïve or LFPI rats. In both figures, the lines with circles indicate the mean (SD) plasma concentration of either sodium selenate or selenium in naïve rats; whereas the lines with squares represent the mean (SD) plasma concentration of either sodium selenate or selenium in LFPI rats. n = 1 to 4/group/time point.
FIGURE 6
FIGURE 6
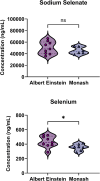
Comparisons of sodium selenate and selenium plasma concentrations following single 0.04 mg/kg s.c. loading dose and 7‐day 1 mg/kg/day s.c. drug delivery regimen in LFPI rats studied at Albert Einstein College of Medicine and Monash University. In both figures, circles represent plasma concentrations of either sodium selenate or selenium obtained from Albert Einstein College of Medicine, and triangles represent plasma concentrations of either sodium selenate or selenium obtained from Monash University. *p = .04. n = 6 to 9/group.

References

    1. Xiong Y, Mahmood A, Chopp M. Animal models of traumatic brain injury. Nat Rev Neurosci. 2013;14(2):128‐142. doi:10.1038/nrn3407 - DOI - PMC - PubMed
    1. Brady RD, Casillas‐Espinosa PM, Agoston DV, et al. Modelling traumatic brain injury and posttraumatic epilepsy in rodents. Neurobiol Dis. 2019;123:8‐19. doi:10.1016/j.nbd.2018.08.007 - DOI - PMC - PubMed
    1. Christensen J, Pedersen HS, Fenger‐Grøn M, Fann JR, Jones NC, Vestergaard M. Selective serotonin reuptake inhibitors and risk of epilepsy after traumatic brain injury—a population based cohort study. PLoS One. 2019;14(7):e0219137. doi:10.1371/journal.pone.0219137 - DOI - PMC - PubMed
    1. Christensen J, Pedersen MG, Pedersen CB, Sidenius P, Olsen J, Vestergaard M. Long‐term risk of epilepsy after traumatic brain injury in children and young adults: a population‐based cohort study. Lancet Lond Engl. 2009;373(9669):1105‐1110. doi:10.1016/S0140-6736(09)60214-2 - DOI - PubMed
    1. Ritter AC, Wagner AK, Fabio A, et al. Incidence and risk factors of posttraumatic seizures following traumatic brain injury: a traumatic brain injury model systems study. Epilepsia. 2016;57(12):1968‐1977. doi:10.1111/epi.13582 - DOI - PubMed

LinkOut - more resources