. 2024 Nov 1;16(11):evae241.
doi: 10.1093/gbe/evae241.

Characterization of Single-Cell Cis-regulatory Elements Informs Implications for Cell Differentiation

Affiliations

Characterization of Single-Cell Cis-regulatory Elements Informs Implications for Cell Differentiation

Ying-Ying Ren et al. Genome Biol Evol. .

Abstract

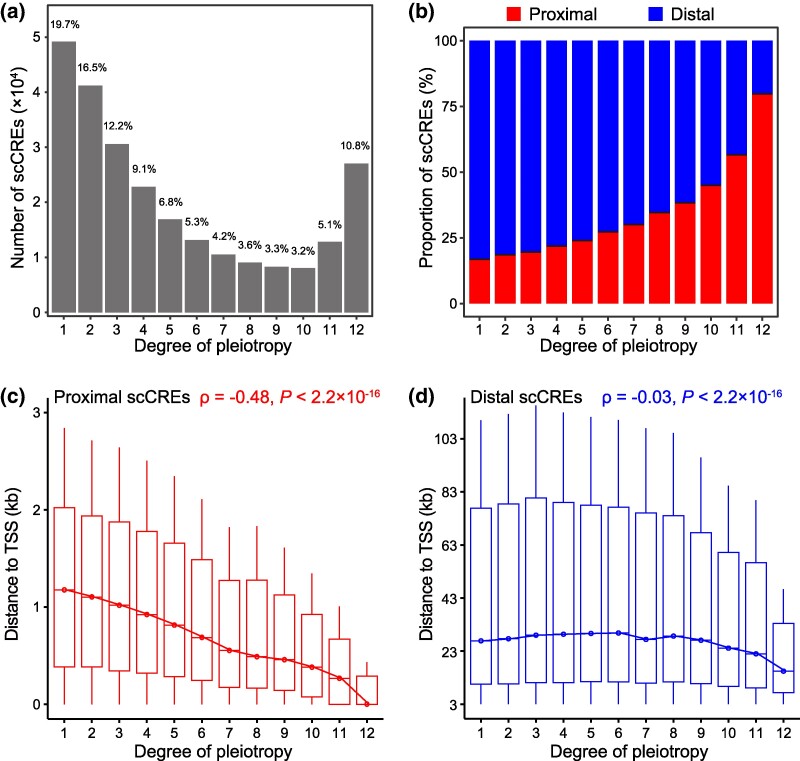
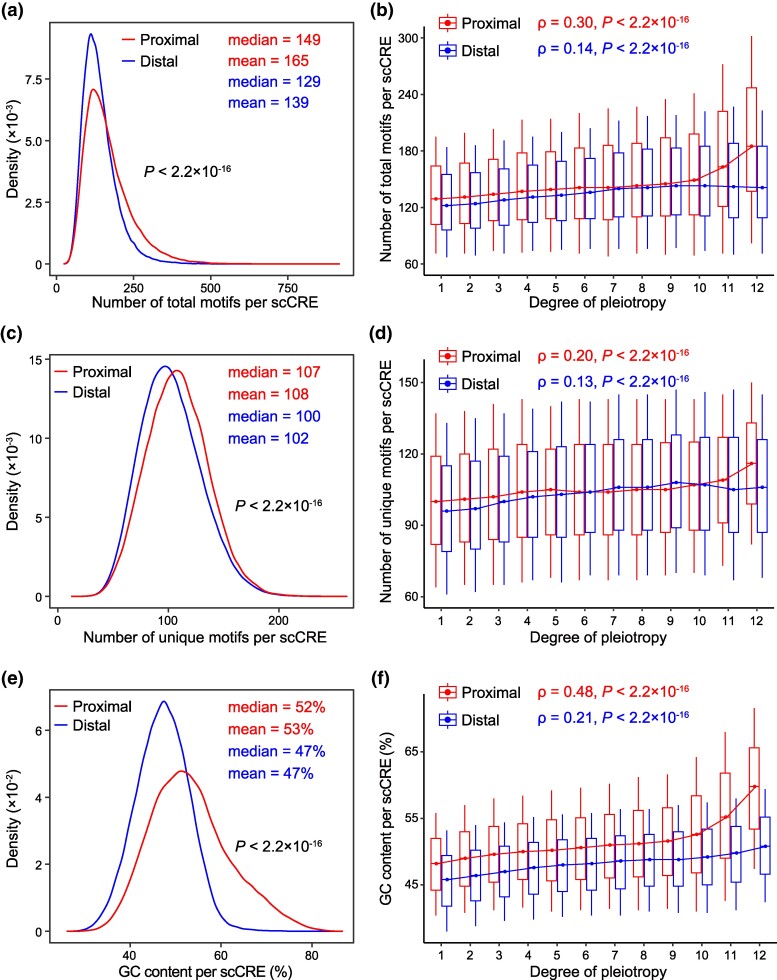
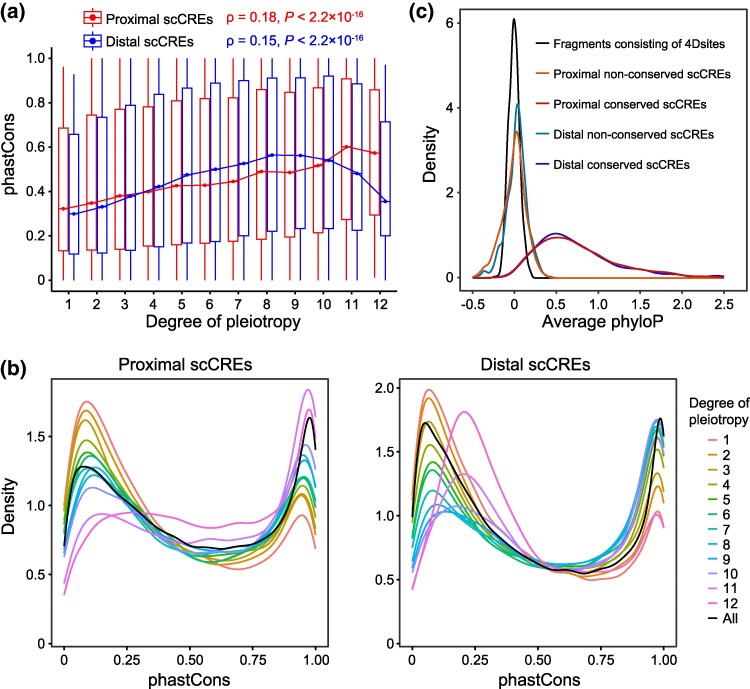
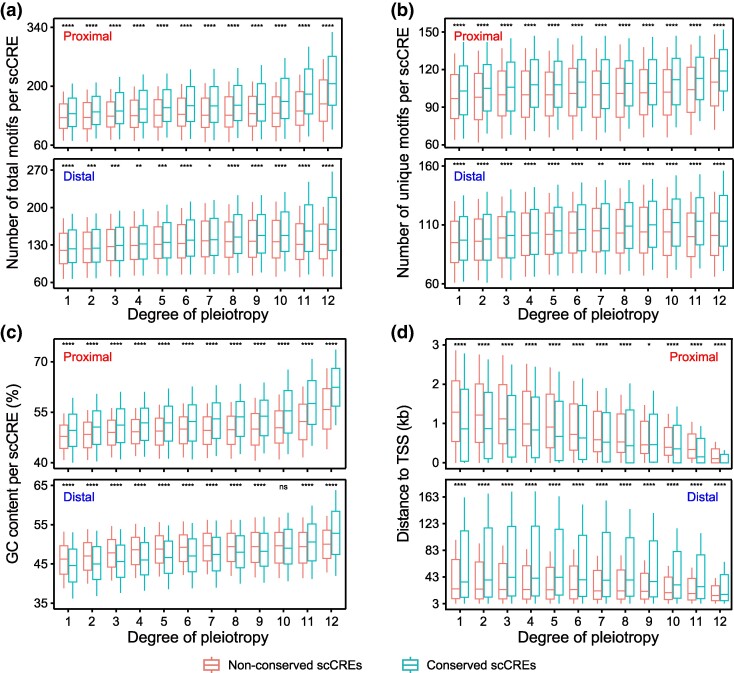
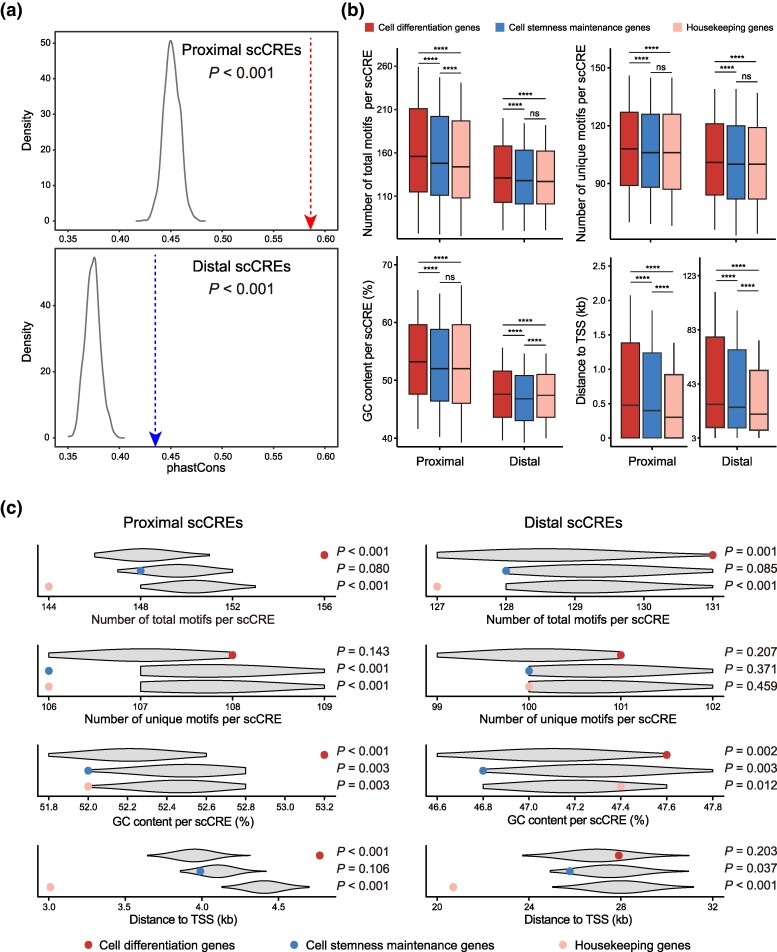
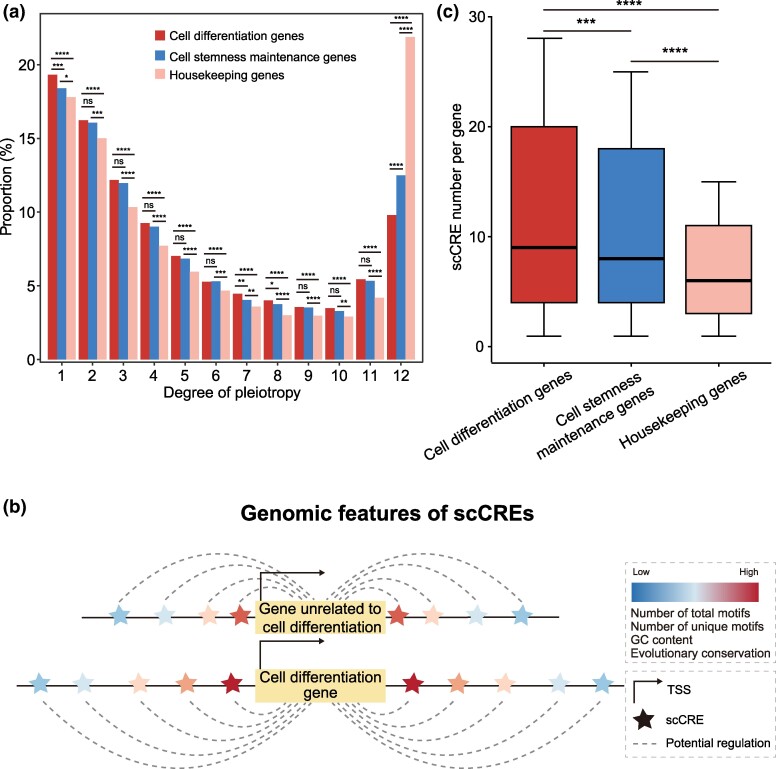
Cis-regulatory elements govern the specific patterns and dynamics of gene expression in cells during development, which are the fundamental mechanisms behind cell differentiation. However, the genomic characteristics of single-cell cis-regulatory elements closely linked to cell differentiation during development remain unclear. To explore this, we systematically analyzed ∼250,000 putative single-cell cis-regulatory elements obtained from snATAC-seq analysis of the developing mouse cerebellum. We found that over 80% of these single-cell cis-regulatory elements show pleiotropic effects, being active in 2 or more cell types. The pleiotropic degrees of proximal and distal single-cell cis-regulatory elements are positively correlated with the density and diversity of transcription factor binding motifs and GC content. There is a negative correlation between the pleiotropic degrees of single-cell cis-regulatory elements and their distances to the nearest transcription start sites, and proximal single-cell cis-regulatory elements display higher relevance strengths than distal ones. Furthermore, both proximal and distal single-cell cis-regulatory elements related to cell differentiation exhibit enhanced sequence-level evolutionary conservation, increased density and diversity of transcription factor binding motifs, elevated GC content, and greater distances from their nearest genes. Together, our findings reveal the general genomic characteristics of putative single-cell cis-regulatory elements and provide insights into the genomic and evolutionary mechanisms by which single-cell cis-regulatory elements regulate cell differentiation during development.

Keywords: CRE; cell differentiation; genomic characteristics; pleiotropy.


Conflict of interest statement

Conflict of Interest The authors declare no competing interests.

Figures

Fig. 1.
Fig. 1.
The data distribution of proximal and distal scCREs. a) The distribution of the numbers of scCREs across different degrees of pleiotropy. b) The distribution of the proportions of proximal and distal scCREs across different degrees of pleiotropy. The distances from the nearest TSSs negatively correlate with the pleiotropic degrees for proximal c) and distal d) scCREs. The Spearman correlation coefficient (ρ) and its P value are provided. In the boxplot, the lower and upper edges represent the 25th quartile (q1) and 75th quartile (q3), respectively. The horizontal line inside the box indicates the median (md). The whiskers extend to the most extreme values inside inner fences, md ± 0.5 (q3-q1).
Fig. 2.
Fig. 2.
Genomic features of scCREs classified by their degrees of pleiotropy. a) Frequency distribution of total TF binding motifs per proximal and distal scCRE. b) Positive correlations between pleiotropic degrees and the numbers of total TF binding motifs for proximal and distal scCREs. c) Frequency distribution of unique TF binding motifs per proximal and distal scCRE. d) Positive correlations between pleiotropic degrees and the numbers of unique TF binding motifs for both proximal and distal scCREs. e) Frequency distribution of the GC content per proximal and distal scCRE. f) Positive correlations between pleiotropic degrees and GC content for proximal and distal scCREs. Mean and median values are shown. The Spearman correlation coefficient (ρ) and its associated P value are provided for each correlation. In the boxplot, the lower and upper edges represent the 25th quartile (q1) and 75th quartile (q3), respectively. The horizontal line inside the box indicates the median (md). The whiskers extend to the most extreme values inside inner fences, md ± 0.5 (q3-q1).
Fig. 3.
Fig. 3.
Evolutionary conservation of scCREs with varying pleiotropic degrees. a) The phastCons values exhibit positive correlations with varying degrees of pleiotropy for both proximal and distal scCREs. The Spearman correlation coefficient (ρ) and its P value are shown. In the boxplot, the lower and upper edges of a box represent the 25th quartile (q1) and 75th quartile (q3), respectively. The horizontal line inside the box indicates the median (md). The whiskers extend to the most extreme values inside inner fences, md ± 0.5 (q3-q1). b) Density plot illustrating the distribution of phastCons scores for both proximal and distal scCREs with different degrees of pleiotropy. c) Distribution of phyloP scores is shown for conserved and nonconserved scCREs, as well as for 4Dsites.
Fig. 4.
Fig. 4.
Comparison of genomic features between conserved and nonconserved scCREs across different degrees of pleiotropy. Evolutionarily conserved scCREs have significantly more total TF binding motifs a) and unique TF binding motifs b) than nonconserved scCREs for both proximal and distal scCREs. c) Comparison of the GC content between conserved and nonconserved scCREs across different pleiotropic degrees for both proximal and distal scCREs. d) Conserved proximal scCREs exhibit a smaller distance to the nearest TSS than nonconserved proximal scCREs across different pleiotropic degrees, whereas the trend is reversed for distal scCREs. In the boxplot, the lower and upper edges of a box represent the 25th quartile (q1) and 75th quartile (q3), respectively. The horizontal line inside the box indicates the median (md). The whiskers extend to the most extreme values inside inner fences, md ± 0.5 (q3-q1). The P values are from Mann–Whitney U tests. *P < 0.05; **P < 0.01; ***P < 0.001; ****P < 0.0001. ns, not significant.
Fig. 5.
Fig. 5.
Genomic features of scCREs related to cell differentiation. a) Frequency distribution of the median phastCons scores for proximal and distal scCREs associated with genes unrelated to cell differentiation is shown for 1,000 random sets. b) Comparison of genomic features among proximal and distal scCREs related to cell differentiation, cell stemness maintenance, and housekeeping functions. The lower and upper edges of a box represent the 25th quartile (q1) and 75th quartile (q3), respectively. The horizontal line inside a box indicates the median (md). The whiskers extend to the most extreme values inside inner fences, md ± 0.5 (q3-q1). The P values are from Mann–Whitney U tests. ****P < 0.0001. ns, not significant. c) The median genomic features of proximal and distal scCREs related to cell differentiation are compared to those of proximal and distal scCREs unrelated to cell differentiation across 1,000 random sets. The dot represents the median genomic features of proximal and distal scCREs associated with cell differentiation. Similar analyses are conducted for proximal and distal scCREs related to cell stemness maintenance and housekeeping functions. The P value indicates the fraction within the distribution.
Fig. 6.
Fig. 6.
General pattern of genomic features in scCREs. a) The bar chart illustrates the variations in the proportions of scCREs related to cell differentiation, cell stemness maintenance, and housekeeping functions across different degrees of pleiotropy. b) A schematic diagram showcasing the genomic features of scCREs. The density and diversity of TF binding motifs, GC content, distance to the nearest TSS, and evolutionary conservation are typically higher for scCREs related to cell differentiation than scCREs unrelated to cell differentiation. c) Cell differentiation genes have significantly more scCREs than cell stemness maintenance genes and housekeeping genes. The P values are from Mann–Whitney U tests. *P < 0.05; **P < 0.01; ***P < 0.001; ****P < 0.0001. ns, not significant.

Similar articles

Cited by

References

    1. Calderon D, Nguyen MLT, Mezger A, Kathiria A, Müller F, Nguyen V, Lescano N, Wu B, Trombetta J, Ribado JV, et al. Landscape of stimulation-responsive chromatin across diverse human immune cells. Nat Genet. 2019:51(10):1494–1505. 10.1038/s41588-019-0505-9. - DOI - PMC - PubMed
    1. Castro-Mondragon JA, Riudavets-Puig R, Rauluseviciute I, Lemma RB, Turchi L, Blanc-Mathieu R, Lucas J, Boddie P, Khan A, Manosalva Pérez N, et al. JASPAR 2022: the 9th release of the open-access database of transcription factor binding profiles. Nucleic Acids Res. 2022:50(D1):D165–D173. 10.1093/nar/gkab1113. - DOI - PMC - PubMed
    1. Chen L, Fish AE, Capra JA. Prediction of gene regulatory enhancers across species reveals evolutionarily conserved sequence properties. PLoS Comput Biol. 2018:14(10):e1006484. 10.1371/journal.pcbi.1006484. - DOI - PMC - PubMed
    1. Cusanovich DA, Hill AJ, Aghamirzaie D, Daza RM, Pliner HA, Berletch JB, Filippova GN, Huang X, Christiansen L, DeWitt WS, et al. A single-cell atlas of in vivo mammalian chromatin accessibility. Cell. 2018:174(5):1309–1324 e1318. 10.1016/j.cell.2018.06.052. - DOI - PMC - PubMed
    1. Davidson EH. Emerging properties of animal gene regulatory networks. Nature. 2010:468(7326):911–920. 10.1038/nature09645. - DOI - PMC - PubMed

Substances

LinkOut - more resources