. 2024 Nov 6;30(1):202.
doi: 10.1186/s10020-024-00970-0.

Single cell RNA-seq reveals cellular and transcriptional heterogeneity in the splenic CD11b+Ly6Chigh monocyte population expanded in sepsis-surviving mice

Affiliations

Single cell RNA-seq reveals cellular and transcriptional heterogeneity in the splenic CD11b+Ly6Chigh monocyte population expanded in sepsis-surviving mice

Haruki Watanabe et al. Mol Med. .

Abstract

Background: Sepsis survivors exhibit immune dysregulation that contributes to poor long-term outcomes. Phenotypic and functional alterations within the myeloid compartment are believed to be a contributing factor. Here we dissect the cellular and transcriptional heterogeneity of splenic CD11b+Ly6Chigh myeloid cells that are expanded in mice that survive the cecal ligation and puncture (CLP) murine model of polymicrobial sepsis to better understand the basis of immune dysregulation in sepsis survivors.

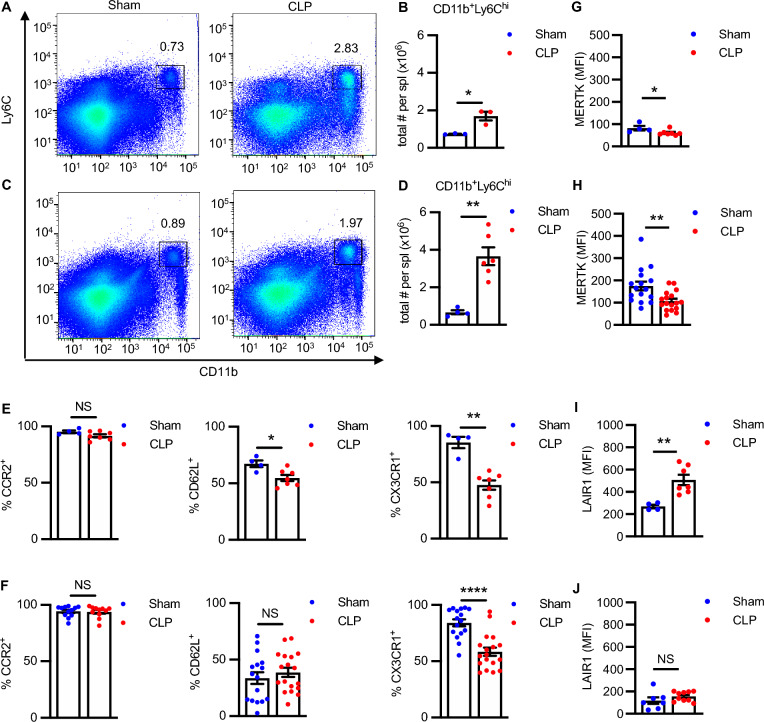
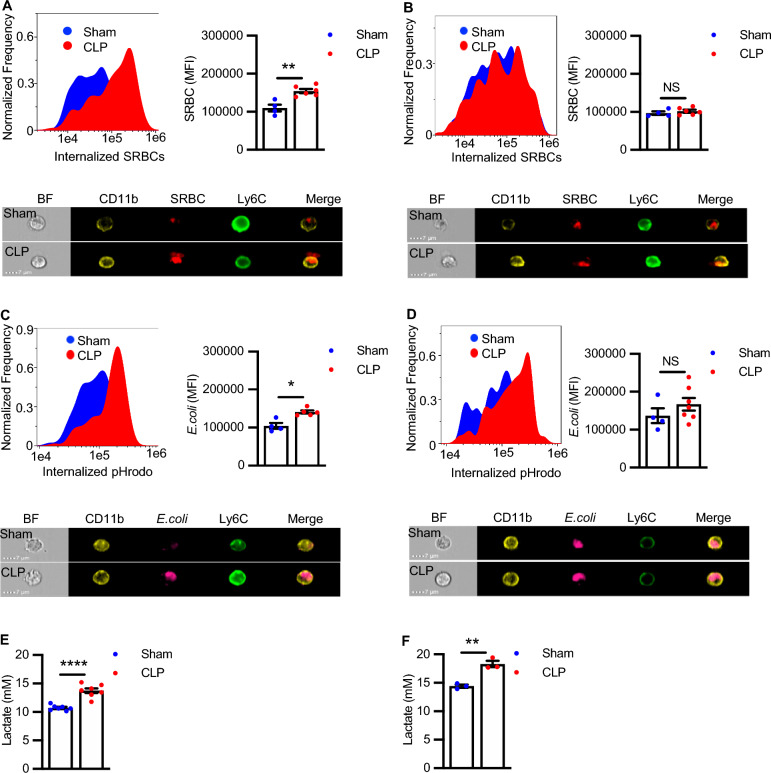
Methods: Sham or CLP surgeries were performed on C57BL/6J and BALB/c mice. Four weeks later splenic CD11b+Ly6Chigh cells from both groups were isolated for phenotypic (flow cytometry) and functional (phagocytosis and glycolysis) characterization and RNA was obtained for single-cell RNA-seq (scRNA-seq) and subsequent analysis.

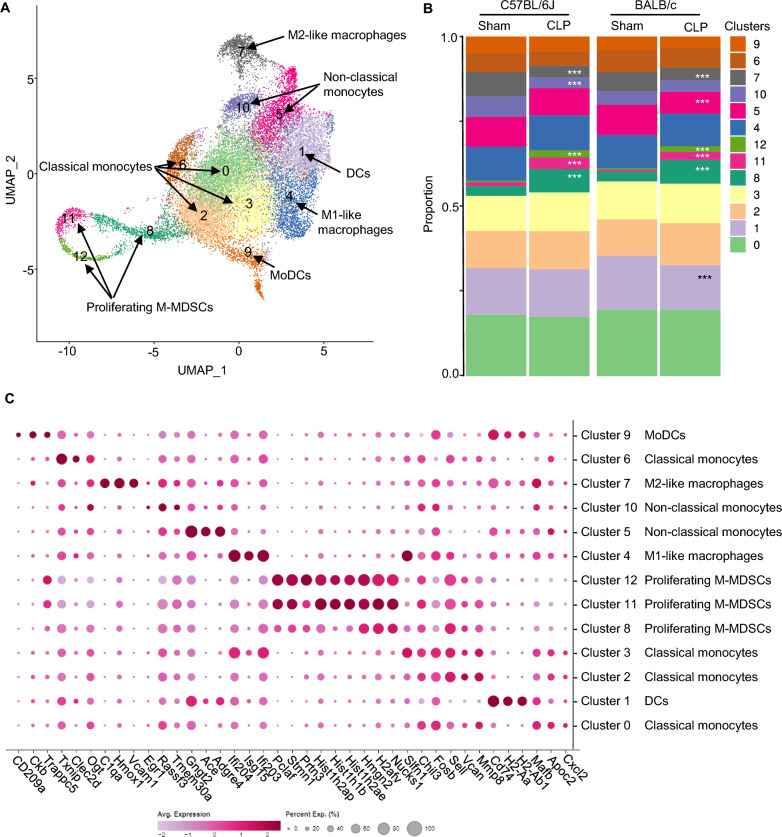
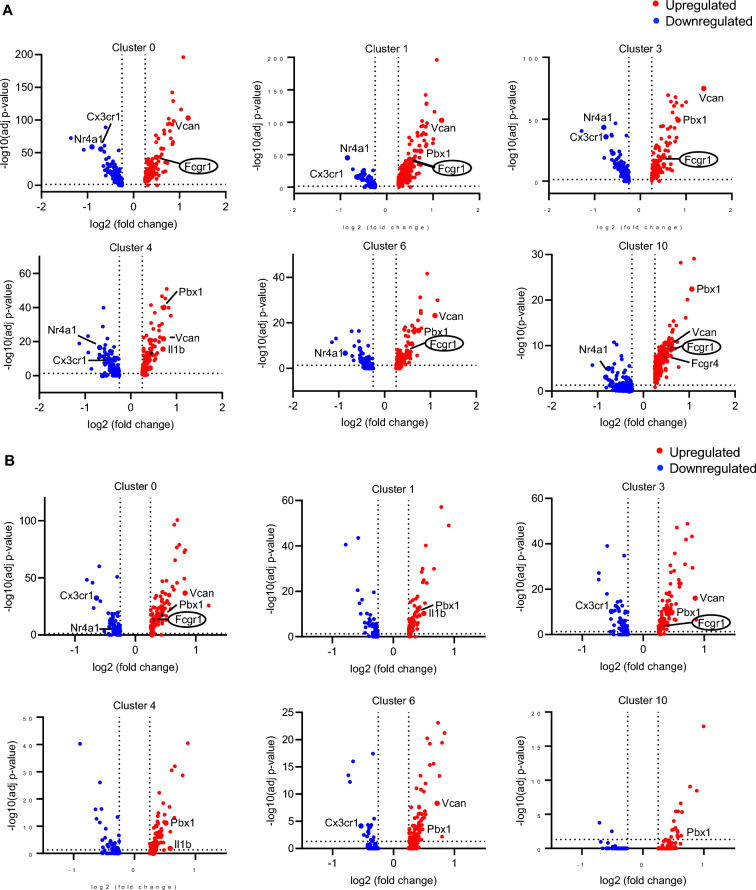
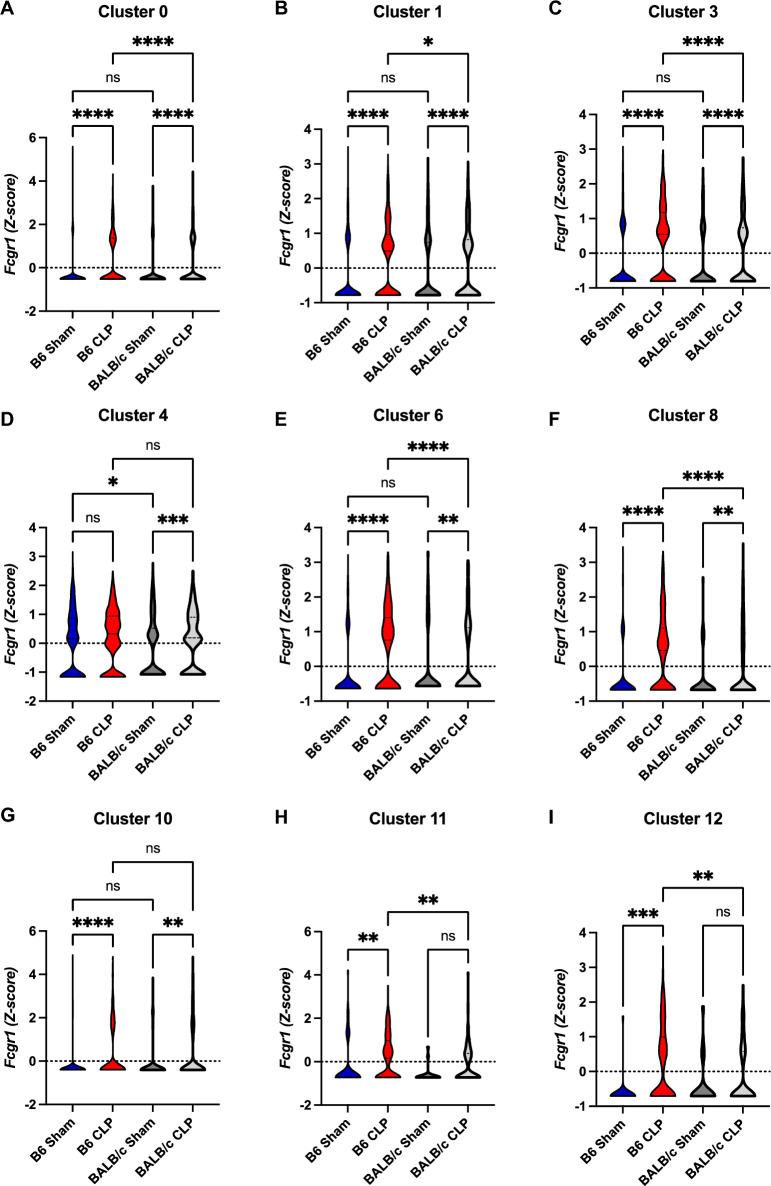
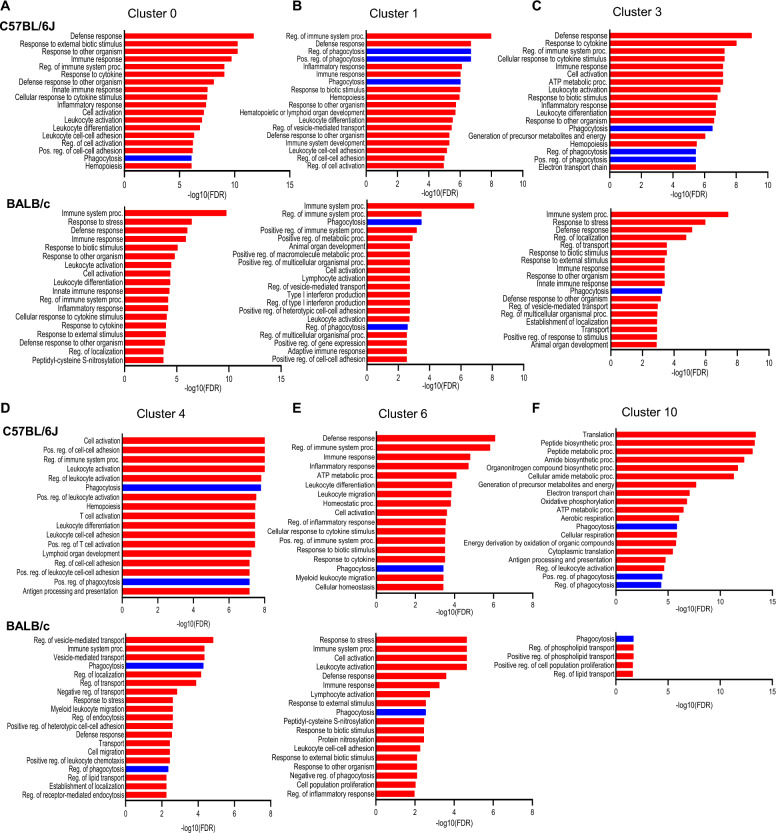
Results: CD11b+Ly6Chigh cells from sham and CLP surviving mice exhibit phenotypic and functional differences that relate to immune function, some of which are observed in both C57BL/6J and BALB/c strains and others that are not. To dissect disease-specific and strain-specific distinctions within the myeloid compartment, scRNA-seq analysis was performed on CD11b+Ly6Chigh cells from C57BL/6J and BALB/c sham and CLP mice. Uniform Manifold Approximation and Projection from both strains identified 13 distinct clusters of sorted CD11b+Ly6Chigh cells demonstrating significant transcriptional heterogeneity and expressing gene signatures corresponding to classical-monocytes, non-classical monocytes, M1- or M2-like macrophages, dendritic-like cells, monocyte-derived dendritic-like cells, and proliferating monocytic myeloid-derived suppressor cells (M-MDSCs). Frequency plots showed that the percentages of proliferating M-MDSCs (clusters 8, 11 and 12) were increased in CLP mice compared to sham mice in both strains. Pathway and UCell score analysis in CLP mice revealed that cell cycle and glycolytic pathways were upregulated in proliferating M-MDSCs in both strains. Notably, granule protease genes were upregulated in M-MDSCs from CLP mice. ScRNA-seq analyses also showed that phagocytic pathways were upregulated in multiple clusters including the classical monocyte cluster, confirming the increased phagocytic capacity in CD11b+Ly6Chigh cells from CLP mice observed in ex vivo functional assays in C57BL/6J mice.

Conclusion: The splenic CD11b+Ly6Chigh myeloid populations expanded in survivors of CLP sepsis correspond to proliferating cells that have an increased metabolic demand and gene signatures consistent with M-MDSCs, a population known to have immunosuppressive capacity.

Keywords: CD11b+Ly6Chigh; CLP; Glycolysis; Phagocytosis; Sepsis; scRNA-seq.


Conflict of interest statement

All authors are current or former staff members of The Feinstein Institutes for Medical Research. BD is on the board of Molecular Medicine and MR and MS are Associate Editors of Molecular Medicine. The authors declare that they have no other competing interests.

Figures

Fig. 1
Fig. 1
CD11b+Ly6Chigh cells from sham and CLP surviving mice exhibit disease-specific and strain-specific phenotypic differences. Splenocytes from C57BL/6 J and BALB/c mice were isolated from sham and CLP surviving mice 4 weeks post-surgery, quantified by cell counting, surface stained for the indicated surface markers, and analyzed by flow cytometry. AD Representative flow plots and quantification of CD11b+Ly6Chigh populations from (A, B) C57BL/6 J (n = 3, Sham; n = 3, CLP; *P < 0.05; Unpaired t-test) and (C, D) BALB/c mice (n = 4, Sham; n = 6, CLP). E Percent cells positive for CCR2 (n = 4, Sham; n = 7, CLP), CD62L (n = 4, Sham; n = 7, CLP), and CX3CR1 (n = 4, Sham; n = 7 CLP) expression in CD11b+Ly6Chigh populations from C57BL/6 J, and F percent cells positive for CCR2 (n = 12, Sham; n = 11, CLP), CD62L (n = 16, Sham; n = 18, CLP), and CX3CR1 (n = 16, Sham; n = 18 CLP) expression in CD11b+Ly6Chigh populations from BALB/c mice, respectively. (G, I) MFI for MERTK (n = 4, Sham; n = 7, CLP) and LAIR-1 (n = 4, Sham; n = 7 CLP) expression in CD11b+Ly6Chigh populations from C57BL/6J, and (H, J) MFI for MERTK (n = 16, Sham; n = 17, CLP) and LAIR-1 (n = 7, Sham; n = 10 CLP) expression in CD11b+Ly6Chigh populations from BALB/c mice, respectively. MFI: Median fluorescence intensity. Data are presented as mean ± SEM. Sham vs. CLP **P < 0.01; ***P < 0.001; ****P < 0.0001; NS, not significant (Mann–Whitney test)
Fig. 2
Fig. 2
CD11b+Ly6Chigh cells from sham and CLP surviving mice exhibit disease-specific and strain-specific differences in phagocytosis and glycolysis. Splenocytes from Sham and CLP (A, C, E) C57BL/6J and (B, D, F) BALB/c mice were isolated 4 weeks post-surgery, and phagocytic and glycolytic function were assessed. AB Representative histogram plots and mean fluorescent intensity (MFI) of internalized SRBCs in (A) C57BL/6J (n = 4, Sham; n = 6, CLP) and (B) BALB/c mice (n = 4 Sham, n = 6 CLP). Representative histogram plots and MFI of internalized E. coli particles in (C) C57BL/6J (n = 4, Sham; n = 5 CLP), and (D) BALB/c (n = 4, Sham; n = 7 CLP) mice. Sham vs. CLP *P < 0.05; **P < 0.01; NS, not significant (Mann–Whitney test). Representative image of internalized SRBCs for one CD11b+Ly6Chigh cell from sham and one CD11b+Ly6Chigh cell from CLP in (A) C57BL/6J and (B) BALB/c mice, respectively. Representative image of internalized E.coli particles for one CD11b+Ly6Chigh cell from sham and one CD11b+Ly6Chigh cell from CLP in (C) C57BL/6J and (D) BALB/c mice, respectively. Lactate release in cultured CD11b+Ly6Chigh cells isolated from sham and CLP (E) C57BL/6J (n = 7, Sham; n = 7, CLP) (F) BALB/c (n = 3, Sham; n = 3 CLP) mice. Results are presented mean ± SEM. Sham vs. CLP **P < 0.01, ****P < 0.0001 (Unpaired t-test)
Fig. 3
Fig. 3
CD11b+Ly6Chigh monocytes clustering in single-cell RNA-seq shows diverse phenotypes. A UMAP plot of single-cell CD11b+Ly6Chigh cells from sham and sepsis-surviving mouse (CLP) spleen. Cells are colored by unsupervised clustering of all four groups (Sham and CLP of both C56BL/6J and BALB/c strains) (sham, n = 2) and (CLP, n = 3). Corresponding (predicting) cell type annotated based on known cell-type-specific marker genes: classical monocytes (clusters 0, 2, 3, 6), dendritic-like cells (cluster 1), M1-like macrophages (cluster 4), non-classical monocytes (clusters 5, 10), M2-like macrophage (cluster 7), monocyte-derived dendritic-like cells (cluster 9), proliferating monocytic myeloid-derived suppressor cells (M-MDSCs) (clusters 8, 11, 12). B Cell-type composition plots (Frequency maps) of 13 clusters in each group. Sham vs. CLP ***P < 0.001 (Fisher Exact Test with the Bonferroni adjustment). C Dot plot of genes defining the 13 clusters of CD11b+Ly6Chigh cells from sham and sepsis-surviving mice of both C56BL/6J and BALB/c strains. The percentage of gene expression in all the cells of a specific cluster is represented by the size of the dot. The color reflects the level of expression of the gene
Fig. 4
Fig. 4
The expression of genes of the glycolysis and cell cycle pathway in clusters 8, 11 and 12 in sepsis-surviving mice are upregulated. A Violin plots and B bar graphs showing UCell score of glycolysis in Sham (n = 2) and CLP (n = 3) in C57BL/6J. UCell scores for glycolysis were calculated using genes from the REATOME pathway (R-MMU-70171 and Table S6). C Clusters 8, 11 and 12 in CLP show higher levels of glycolysis genes than sham. Sham vs. CLP ****P < 0.0001 (Mann–Whitney test)
Fig. 5
Fig. 5
Pathway analysis showed that DEGs upregulated in CLP were significantly enriched in the glycolysis, OxPhos, and DNA replication and cell cycle. A The glycolysis pathway is upregulated (highlighted in blue) in clusters 8, 11 and 12 in CLP (Hallmark) and the OxPhos pathway is upregulated (highlighted in blue) in cluster 12 in CLP (Hallmark). B Proliferation-related genes are upregulated (highlighted in blue) in clusters 8, 11 and 12 in CLP (KEGG pathway; mmu00190). The x-axis is adjusted P-value (< 0.05) log transformed in GraphPad prism
Fig. 6
Fig. 6
Fc gamma receptor-dependent enhancement of phagocytosis in sepsis- surviving C57BL/6J mice. Volcano plots of the DEGs (|fold|> 2 and FDR < 0.05) in CLP compared to sham in C57BL/6J mice (A) and in BALB/c mice (B). The y-axis is the -log10-based adjusted p-value, and the x-axis is the log fold change (logFC). Upregulated genes in CLP are colored red, down-regulated genes in CLP are colored blue, and genes of interest are labeled
Fig. 7
Fig. 7
Upregulation of Fc gamma receptors in sepsis- surviving C57BL/6J mice. AF Violin plots of Fcgr1 indicated clusters. C57BL/6J Sham vs. C57BL/6J CLP vs. BALB/c Sham vs. BALB/c CLP. *P < 0.05, **P < 0. 01, ***P < 0.001,****P < 0.0001 (one-way ANOVA)
Fig. 8
Fig. 8
Phagocytic pathways are upregulated in various clusters of CD11b+Ly6Chigh cells in C57BL/6J sepsis-surviving mice. AF GOBP enriched by upregulated DEG in each cluster. Phagocytosis and phagocytosis-related pathways are highlighted in blue

References

    1. Abbas AK, Lichtman AH, Pillai S, Baker DL, Baker A. Cellular and molecular immunology. 9th ed. Philadelphia: Elsevier; 2018. p. 325–48.
    1. Abdelfattah N, Kumar P, Wang C, Leu JS, Flynn WF, Gao R, et al. Single-cell analysis of human glioma and immune cells identifies S100A4 as an immunotherapy target. Nat Commun. 2022;13(1):767. - PMC - PubMed
    1. Akashi K, Traver D, Miyamoto T, Weissman IL. A clonogenic common myeloid progenitor that gives rise to all myeloid lineages. Nature. 2000;404(6774):193–7. - PubMed
    1. Anderson DA 3rd, Grajales-Reyes GE, Satpathy AT, Vasquez Hueichucura CE, Murphy TL, Murphy KM. Revisiting the specificity of the MHC class II transactivator CIITA in classical murine dendritic cells in vivo. Eur J Immunol. 2017;47(8):1317–23. - PMC - PubMed
    1. Arts RJ, Joosten LA, Netea MG. Immunometabolic circuits in trained immunity. Semin Immunol. 2016;28(5):425–30. - PubMed

MeSH terms