. 2024 Nov 6;25(1):57.
doi: 10.1186/s12868-024-00901-z.

APOE4 rat model of Alzheimer's disease: sex differences, genetic risk and diet

Affiliations

APOE4 rat model of Alzheimer's disease: sex differences, genetic risk and diet

Bradley Colarusso et al. BMC Neurosci. .

Abstract

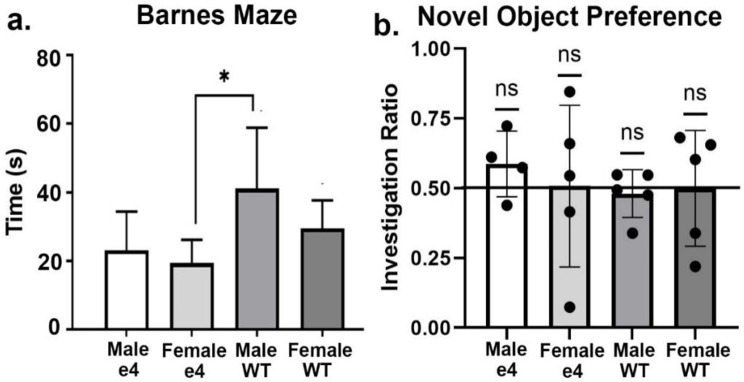
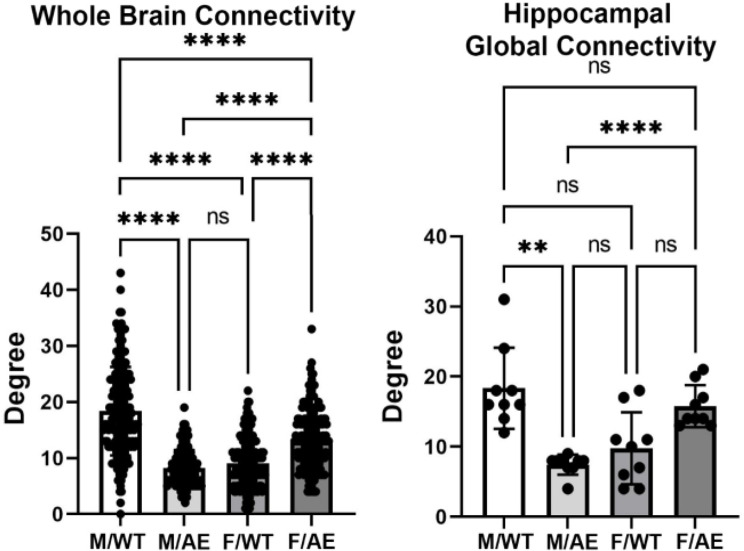
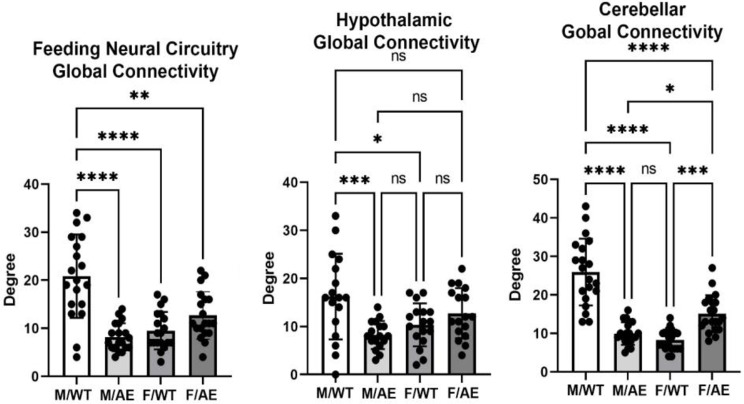
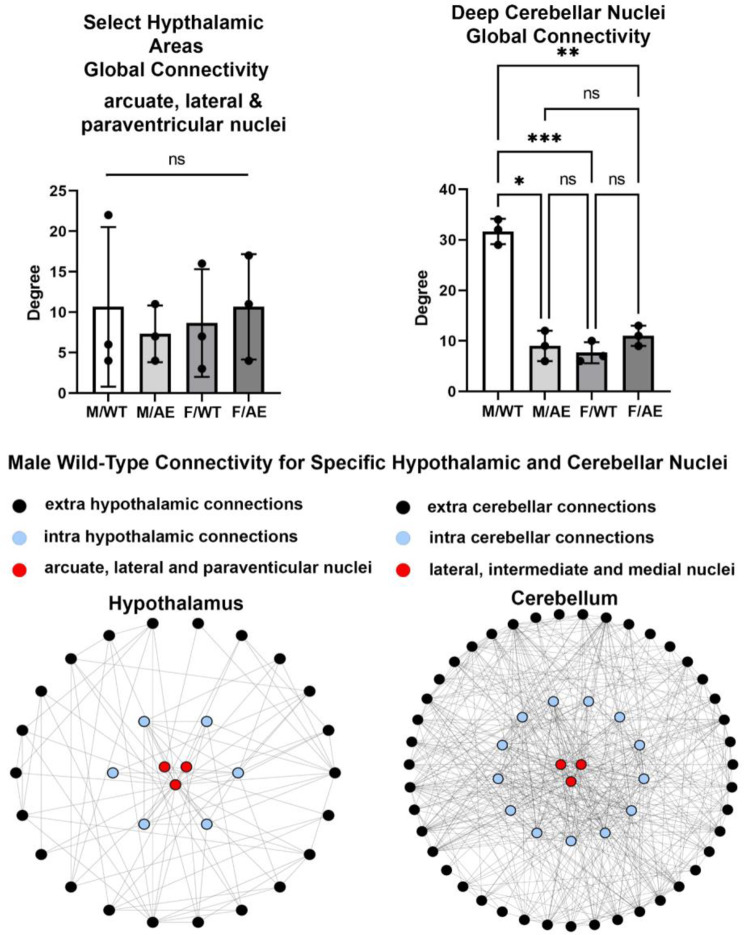
The strongest genetic risk factor for Alzheimer's disease (AD) is the ε4 allele of apolipoprotein E (ApoE ε4). A high fat diet also adds to the risk of dementia and AD. In addition, there are sex differences as women carriers have a higher risk of an earlier onset and rapid decline in memory than men. The present study looked at the effect of the genetic risk of ApoE ε4 together with a high fat/high sucrose diet (HFD/HSD) on brain function in male and female rats using magnetic resonance imaging. We hypothesized female carriers would present with deficits in cognitive behavior together with changes in functional connectivity as compared to male carriers. Four-month-old wildtype and human ApoE ε4 knock-in (TGRA8960), male and female Sprague Dawley rats were put on a HFD/HSD for four months. Afterwards they were imaged for changes in function using resting state BOLD functional connectivity. Images were registered to, and analyzed, using a 3D MRI rat atlas providing site-specific data on 173 different brain areas. Resting state functional connectivity showed male wildtype had greater connectivity between areas involved in feeding and metabolism while there were no differences between female and male carriers and wildtype females. The data were unexpected. The genetic risk was overshadowed by the diet. Male wildtype rats were most sensitive to the HFD/HSD presenting with a deficit in cognitive performance with enhanced functional connectivity in neural circuitry associated with food consumption and metabolism.

Keywords: Diffusion weighted imaging; Functional connectivity; Graph theory; High fat/high sucrose diet; MRI; Sex difference.


Conflict of interest statement

CFF has a financial interest in Ekam Imaging, a company that makes radiofrequency electronics and holders for awake animal imaging. CFF and PK have a partnership interest in Ekam Solutions a company that develops 3D MRI atlases for animal research.

Figures

Fig. 1
Fig. 1
Behavioral tests. Shown in (a) is the time in sec (mean ± SD) or latency to find the goal box. Male wildtype (M/WT) were significantly slower than female ApoE ε4 (F/e4). Data from NOP are shown in (b) as scatter plots of the investigation ratio (time spent investigating the novel object / time spent investigating both objects). Performance was compared to chance (i.e., IR = 0.5) using single-sample, two-tailed t-tests. There were no significant differences (ns) between the groups. * p < 0.05
Fig. 2
Fig. 2
Global connectivity. Shown are bar graphs for the mean ± SD number of Degrees of functional connections for the whole brain and hippocampus together with a scatter plot of all brain areas represented in each. Male wildtype (M/WT) was significantly greater than all other experimental groups while female ApoE ε4 (F/e4) was significantly greater than male ApoE ε4 (M/e4) and female wildtype (F/WT). The M/WT global network density was 0.111 and the global average degree 18.383. The M/e4 global network density was 0.049 and the average degree 8.216. The F/WT network density was 0.055 and the average degree 9.114. The F/e4 network density was 0.080 and average degree 13.341. ** p < 0.01; **** p < 0.0001. Brain areas comprising the whole brain and hippocampus can be found in the Supplementary Excel File S2
Fig. 3
Fig. 3
Global connectivity around feeding. Shown are bar graphs for the mean ± SD number of Degrees of functional connections for the feeding neural circuit, hypothalamus and cerebellum together with a scatter plot of all brain areas represented in each. Labels are the same as Fig. 2. * p < 0.05; ** p < 0.01; *** p < 0.001; **** p < 0.0001. Brain areas comprising the feeding circuit, hypothalamus and cerebellum can be found in the Supplementary Excel File S2
Fig. 4
Fig. 4
Global connectivity to select feeding nuclei. Shown are bar graphs for the mean ± SD for the number of Degrees of functional connections for the three hypothalamic and cerebellar nuclei found to be key in regulating feeding behavior in rodents together with a scatter plot of their individual values. A network maps for the male wildtype (M/WT) of each is shown below. The three red circles represent the three brain areas from each brain region. The blue circles are the intra or within connections from these three nodes to their respective brain region, i.e. hypothalamus and cerebellum. The outer black dots are the extra or outside connections from these nodes to other brain areas. Nonsignificant (ns); * p < 0.05; ** p < 0.01; *** p < 0.001

References

    1. Association As. Alzheimer’s disease facts and figures; 2022.
    1. Ungar L, Altmann A, Greicius MD, Apolipoprotein E. Gender, and Alzheimer’s disease: an overlooked, but potent and promising interaction. Brain Imaging Behav. 2014;8:262–73. - DOI - PMC - PubMed
    1. Neu SC, et al. Apolipoprotein E genotype and sex risk factors for Alzheimer Disease: a meta-analysis. JAMA Neurol. 2017;74:1178–89. - DOI - PMC - PubMed
    1. Payami H, et al. Alzheimer’s disease, apolipoprotein E4, and gender. JAMA: J Am Med Association. 1994;271:1316–7. - DOI - PubMed
    1. Poirier J, et al. Apolipoprotein E polymorphism and Alzheimer’s disease. Lancet. 1993;342:697–9. - DOI - PubMed

Substances

LinkOut - more resources