

Racial disparity in mortality from tuberculosis in the US between states with and without a history of Jim-Crow laws: an analysis of the Global Burden of Disease (GBD) and risk factors study, 1990 to 2019
- PMID: 39506669
- PMCID: PMC11542262
- DOI: 10.1186/s12889-024-20522-9
Racial disparity in mortality from tuberculosis in the US between states with and without a history of Jim-Crow laws: an analysis of the Global Burden of Disease (GBD) and risk factors study, 1990 to 2019
Abstract
Background: While TB-related mortality in the US declined four-fold from 1990 to 2019, country-level estimates of TB burden obscure within-state racial heterogeneity and changes in TB burden over time. In sixteen US Southern States and Washington DC, the effects of health inequities engendered by Jim-Crow laws enacted from the late 1800s to the 1960s have not been evaluated for TB-related mortality. We, therefore, sought to compare TB mortality rates and annualized rate of change (AROC) between 1990 and 2019 in former Jim-Crow vs. non-Jim-Crow states to help guide response efforts and inform resource prioritization to improve racial equity.
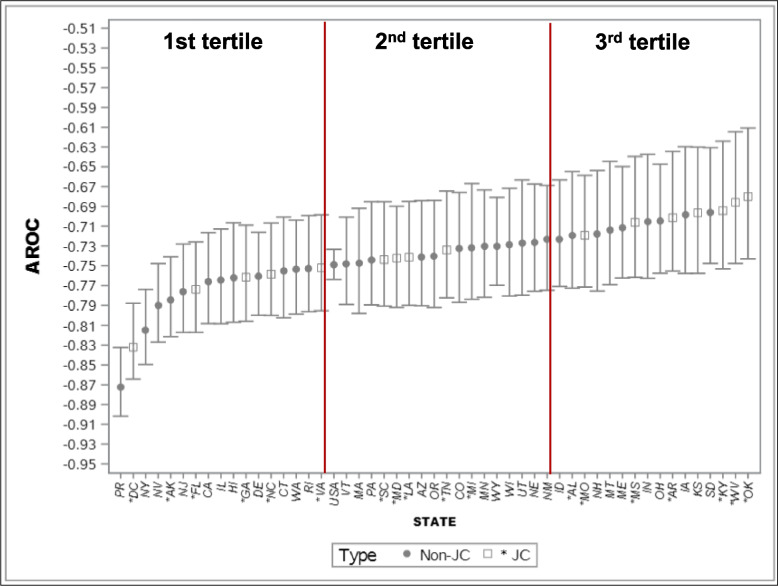
Methods: We evaluated whether TB-related mortality varied over time, from 1990 to 2019, between states that have a history of enacting Jim-Crow laws vs. states with no such history using estimates from the Global Burden of Diseases, Injuries, and Risk Factors Study 2019 (GBD 2019). TB mortality per 100,000 population and bootstrap 95% uncertainty intervals (UIs) were modeled using the Cause of Death Ensemble model (CODEm) framework with varying combinations of predictive covariates. For changes over time, we present age-standardized AROC as the percent difference in the natural logarithm of the rate in 1990 and 2019 divided by 30 (i.e., 100*[ln(2019 Rate/1990 Rate)/(30)) and the corresponding 95% UIs.
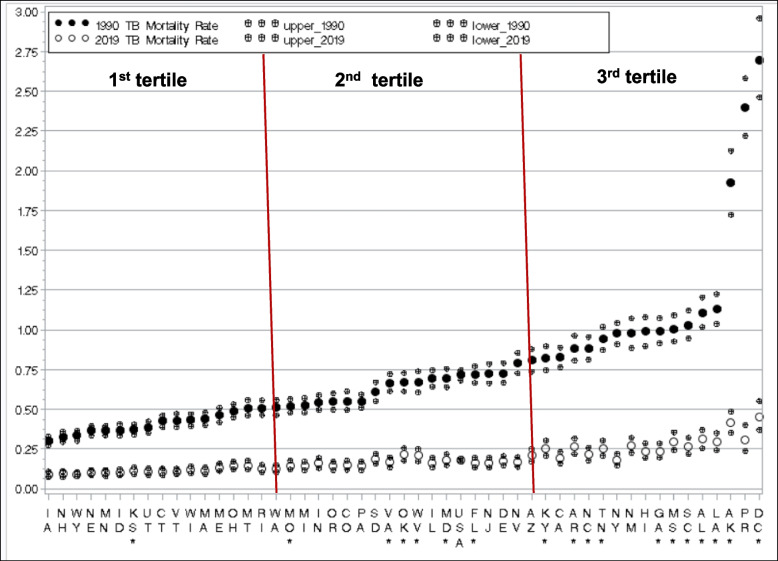
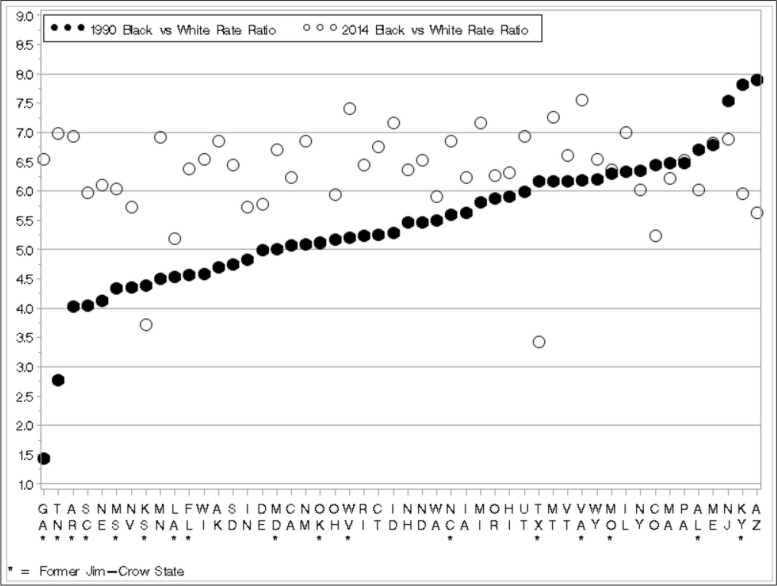
Results: TB-related mortality in all US states declined between 1990 and 2019. From 1990 to 2019, most former Jim-Crow states had higher mortality rates than states that did not enact Jim-Crow laws. The most significant decline in TB mortality was in Washington DC, with a six-fold decline from 2.69 (2.46-2.96) per 100,000 population in 1990 to 0.45(0.37-0.55) in 2019, corresponding to an AROC of -0.83% (-0.86;-0.79). The lowest decline was in Iowa, from 0.30 (0.27-0.33) to 0.09 (0.07-0.11) (AROC: -0.70% (-0.76; -0.63)). Eleven of the 16 states and Washington DC in the third tertile of TB mortality rate in 1990 (range 0.81-2.69) had a history of Jim-Crow laws, whereas none of the 17 states in the first tertile (range 0.30-0.51) had such history. Conversely, mortality decreased relatively slowly in former Jim-Crow states than in non-Jim-Crow states.
Conclusions: Even though the 1964 Civil Rights Act dismantled Jim-Crow statutes, racial inequities in TB burden experienced by past generations may still be felt in subsequent generations. Understanding the role of structural racism at the intersection of science and medicine shows the complex ways historical laws, such as Jim-Crow laws, continue to negatively impact health outcomes and warn of future dangers, such as COVID-19, to avoid.
Keywords: Changes in Tuberculosis mortality; Jim-Crow states; Tuberculosis Epidemiology in US States; Tuberculosis-related mortality in US States.
© 2024. The Author(s).
Conflict of interest statement
The authors declare no competing interests.
Figures

References
-
- Global Burden of Disease Collaborative Network. Global Burden of Disease Study 2019 Results. Seattle, United States: Institute for Health Metrics and Evaluation (IHME), 2020.Available from http://ghdx.healthdata.org/gbd-results-tool.
-
- Woodward CV. Map of Jim Crow America; 2001. https://mchekc.org/wp-content/uploads/2021/01/jim-crow-laws.pdf .
-
- GBD 2016 Causes of Death Collaborators. Global, regional, and national age-sex specific mortality for 264 causes of death, 1980–2016: a systematic analysis for the Global Burden of Disease Study 2016. Lancet. 2017 Sep 16;390(10100):1151–1210. 10.1016/S0140-6736(17)32152-9. Erratum in: Lancet. 2017 Oct 28;390(10106):e38. PMID: 28919116; PMCID: PMC5605883. - PMC - PubMed
-
- Chay K, Greenstone M. The Convergence in Black-White Infant Mortality Rates During the 1960’s. Ame Econ Rev. 2000;90:326–32.
Publication types
MeSH terms
LinkOut - more resources
Full Text Sources
Medical
Miscellaneous
