. 2024 Nov 6;25(1):1050.
doi: 10.1186/s12864-024-10986-9.

Epigenetic dynamics of partially methylated domains in human placenta and trophoblast stem cells

Affiliations

Epigenetic dynamics of partially methylated domains in human placenta and trophoblast stem cells

Hidehiro Toh et al. BMC Genomics. .

Abstract

Background: The placenta is essential for nutrient exchange and hormone production between the mother and the developing fetus and serves as an invaluable model for epigenetic research. Most epigenetic studies of the human placenta have used whole placentas from term pregnancies and have identified the presence of partially methylated domains (PMDs). However, the origin of these domains, which are typically absent in most somatic cells, remains unclear in the placental context.

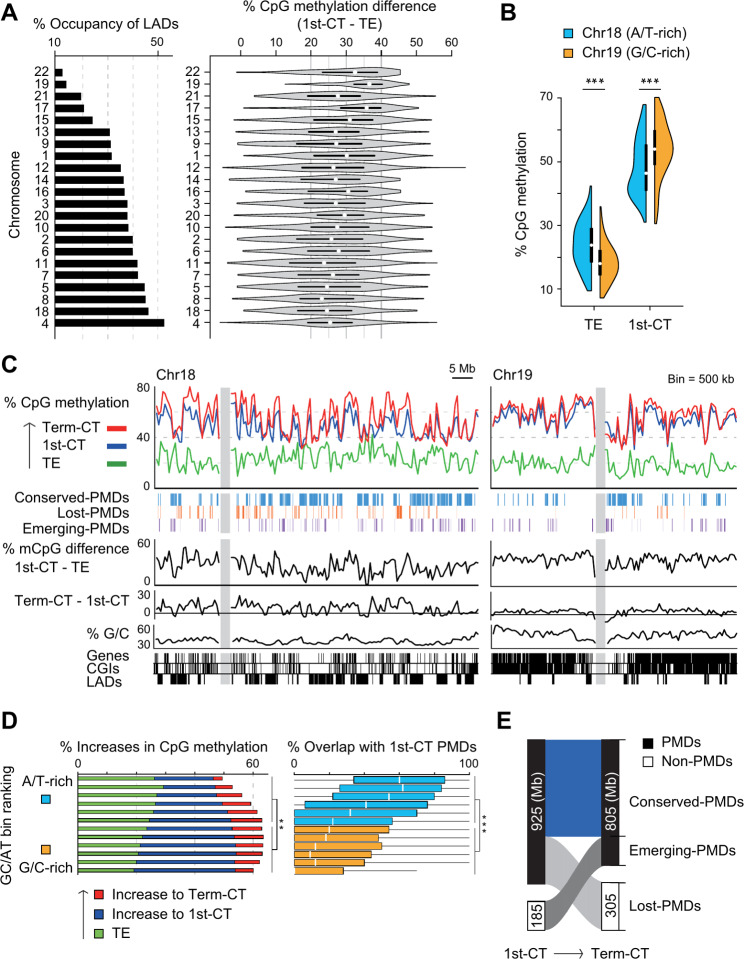
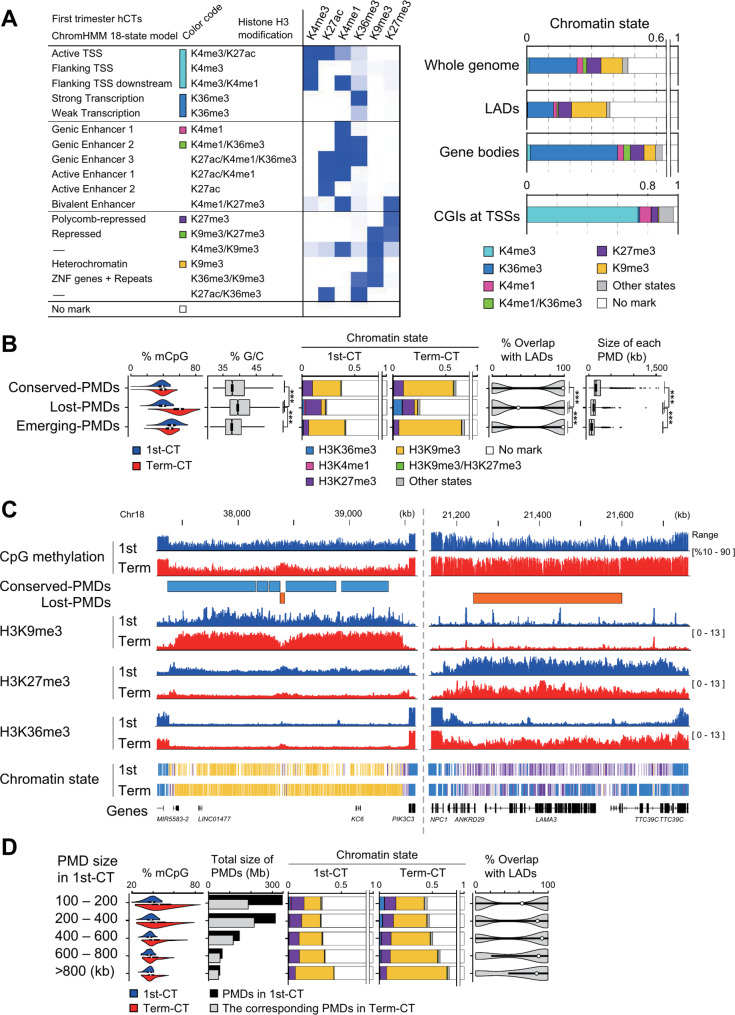
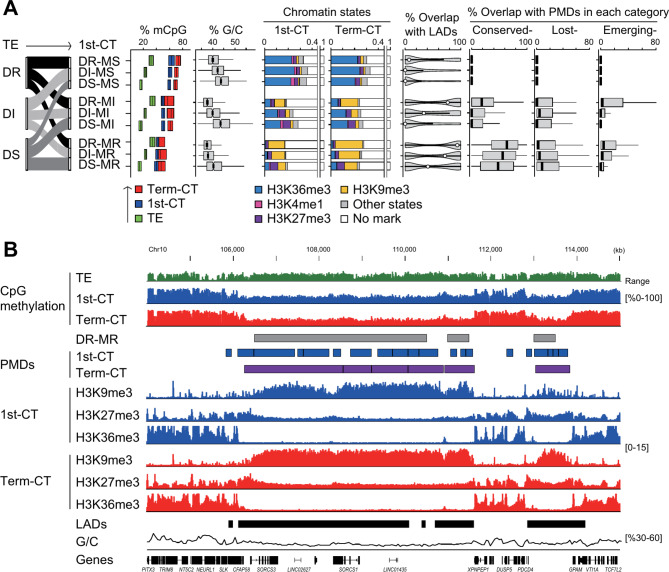
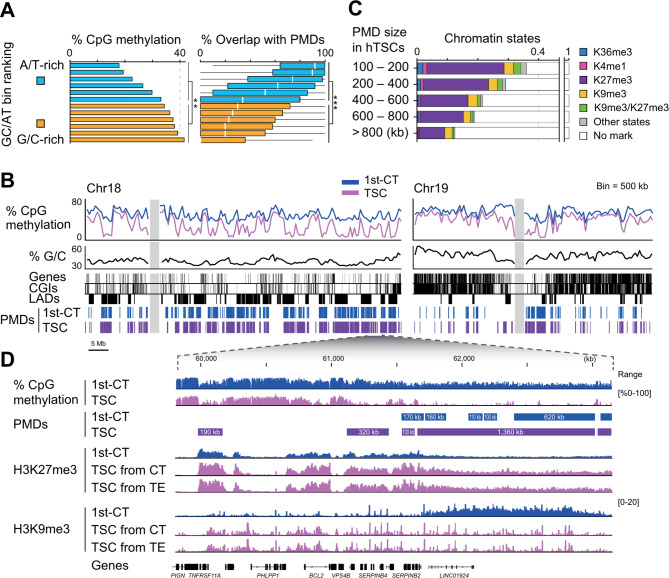
Results: Using whole-genome bisulfite sequencing and analysis of histone H3 modifications, we generated epigenetic profiles of human cytotrophoblasts during the first trimester and at term, as well as human trophoblast stem cells. Our study focused specifically on PMDs. We found that genomic regions likely to form PMDs are resistant to global DNA demethylation during trophectoderm reprogramming, and that PMDs arise through a slow methylation process within condensed chromatin near the nuclear lamina. In addition, we found significant differences in histone H3 modifications between PMDs in cytotrophoblasts and trophoblast stem cells.

Conclusions: Our findings suggest that spatiotemporal genomic features shape megabase-scale DNA methylation patterns, including PMDs, in the human placenta and highlight distinct differences in PMDs between human cytotrophoblasts and trophoblast stem cells. These findings advance our understanding of placental biology and provide a basis for further research into human development and related diseases.

Keywords: Human cytotrophoblasts; Human trophoblast stem cells; Methylomes; Partially methylated domains.


Conflict of interest statement

The authors declare no competing interests.

Figures

Fig. 1
Fig. 1
Tracking methylome dynamics and the emergence of PMDs during human placental development. (A) Correlation between position in the nucleus and DNA methylation levels. Bar plots show the LAD occupancy for each chromosome, ordered from top to bottom by decreasing LAD occupancy, with LAD data taken from Guelen et al. (2008) [33]. Violin plots illustrate the differences in methylation levels between trophectoderm and first trimester hCTs for each chromosome. TE, trophectoderm; 1st-CT, first trimester hCTs (B) The transition of DNA methylation levels from trophectoderm to first trimester hCTs. The methylation level of the 500-kb bins in Chr18 and Chr19 is shown by half-violin plots. Trophectoderm data are from Zhu et al. (2018) [30]. (C) DNA methylation levels in trophectoderm and hCTs across Chr18 and Chr19. CpG methylation levels and PMDs are shown as lines and rectangles, respectively. G/C content, RefSeq genes, CpG islands (CGIs), and LADs are shown at the bottom, and gray bars indicate centromere positions. Term-CT, term hCTs (D) Relationship between G/C content and DNA methylation levels during placental development. All non-overlapping 500 kb bins were sorted by G/C content and divided into 12 groups in order of increasing G/C content. Stacked bar graphs (left) show increases in DNA methylation levels across developmental stages. Baseline CpG methylation levels in the trophectoderm are shown in green, and additional methylation levels are shown in blue and red. Increases (indicated by blue) in methylation levels from trophectoderm to first trimester hCTs were evaluated for statistical significance. Box plots (right) show the overlap rate between PMDs in first trimester hCTs and bins for each group (E) Transitional dynamics of PMDs from first trimester to term hCTs. The numbers indicate the total PMD size (in megabases) for each category Statistical significance for changes in methylation levels and PMD overlap was assessed using the Wilcoxon rank sum test. Significance is indicated by double asterisks (**) for P < 0.005 and triple asterisks (***) for P < 0.0001 across all relevant panels
Fig. 2
Fig. 2
Epigenetic dynamics in PMDs of human cytotrophoblasts. (A) A chromatin state model specific for hCTs generated with ChromHMM. The model is based on the enrichment levels of six different histone H3 modifications, and the blue intensity in the left panel reflects the histone H3 enrichment at different chromatin states. The right panel shows the distribution of these chromatin states across the genome, as well as in LADs, gene bodies, and CpG islands (CGIs) at transcription start sites (TSSs) in first trimester hCTs. The histone H3 modifications analyzed include K4me3 (lysine 4 trimethylation), K4me1 (lysine 4 monomethylation), K9me3 (lysine 9 trimethylation), K27me3 (lysine 27 trimethylation), K36me3 (lysine 36 trimethylation), and K27ac (lysine 27 acetylation) (B) Characteristics of three PMD categories across developmental stages in hCTs. mCpG: Violin plots illustrate the distribution of CpG methylation level, highlighting changes from first trimester to term. G/C: Box plots the G/C content. Chromatin state: This panel illustrates the distribution of chromatin states for both developmental stages, using the chromatin state model from panel A for clarity. Overlap with LADs: Violin plots show the percent overlap of PMDs with LADs. Size of each PMD: Box plots illustrate the size range of PMDs. Statistical significance was assessed using the Wilcoxon rank sum test, with triple asterisks (***) indicating P < 0.0001. 1st-CT, first trimester hCTs; Term-CT, term hCTs (C) A genome browser view of regions containing conserved-PMDs (left) and lost-PMDs (right). DNA methylation levels and histone H3 modification signals for first trimester hCTs and term hCTs are shown. Plots are provided for each histone H3 modification from one of the individual biological replicates, with PMDs marked as rectangles. Three chromatin states (H3K9me3, H3K27me3, H3K36me3) in ChromHMM were shown at the bottom. The color code for chromatin states is the same as in panel A (D) Comparative analysis of PMD characteristics by size across developmental stages in hCTs. mCpG: Violin plots illustrate the distribution of CpG methylation levels, highlighting changes from first trimester to term. Total size of PMDs: Black bars illustrate the total size of PMDs during the first trimester, while lighter shaded bars indicate the total size of the corresponding PMDs at term. Chromatin states: This section shows the distribution of chromatin states in PMDs at both stages of development. The color code for chromatin states is the same as in panel B. Overlap with LADs: Violin plots show the percent overlap of PMDs with LADs
Fig. 3
Fig. 3
Characteristics of genomic regions prone to placental PMDs. (A) Dynamic epigenetic changes in 500-kb genomic bins during the phases of global DNA demethylation and methylation in the placental lineage. Bin groups are categorized based on their resistance or susceptibility to global DNA demethylation during trophectoderm reprogramming (demethylation-resistant [DR], demethylation-intermediate [DI], demethylation-susceptible [DS]) and their sensitivity to methylation during the global de novo DNA methylation phase in first trimester hCTs (methylation-susceptible [MS], methylation-intermediate [MI], methylation-resistant [MR]). Details of the bin classification methods are described in the Methods section. The first flowchart illustrates the transition of genomic bins from trophectoderm to first trimester hCTs. mCpG: Box plots show the CpG methylation levels across the three developmental stages. G/C: Box plots show the distribution of G/C content. Chromatin states: This section shows the distribution of chromatin states in bins at both stages of development. Color codes in chromatin states correspond to those defined in Fig. 2A. Overlap with LADs: Violin plots show the percent overlap of bins with LADs. Overlap with PMDs: Box plots show the percent overlap of bins with PMDs in each category. TE, trophectoderm; 1st-CT, first trimester hCTs; Term-CT, term hCTs (B) A genome browser view of regions resistant to both demethylation and methylation (DR-MR). DNA methylation levels are shown for trophectoderm, first trimester hCTs, and term hCTs. Histone H3 modification signals for first trimester hCTs and term hCTs from one of the individual biological replicates are also shown. The positions of DR-MR, PMDs, and LADs are indicated by rectangles. G/C content and RefSeq genes are shown at the bottom
Fig. 4
Fig. 4
Features of PMDs of human trophoblast stem cells. (A) PMD distribution in genomic regions with different G/C content in hTSCs. Bars (left) show total CpG methylation levels in 12 bin groups defined in Fig. 1D. Statistical significance was assessed using the exact Wilcoxon rank sum test; double asterisks (**) indicates P < 0.005. Box plots (right) show the overlap between PMDs in hTSCs and each bin group. Statistical significance was assessed using the exact Wilcoxon rank sum test; triple asterisks (***) indicate P < 0.0001 (B) Bulk CpG methylation levels in hTSCs plotted over Chr18 and Chr19. The format of the plots is consistent with Fig. 1C. PMDs are shown as blue and purple rectangles. 1st-CT, first trimester hCTs; TSC, hTSCs (C) Distribution of chromatin states within PMD groups categorized by size in hTSCs. ChromHMM was used to generate a chromatin state model for hTSCs based on the enrichment levels of six histone H3 modifications, similar to the analysis shown in Fig. 2A (D) Zoomed view of the locus containing both longer and shorter PMDs. CpG methylation levels and histone H3 modification signals are plotted for this region. PMDs are indicated by rectangles with sizes given in kilobases. CT, hCTs; TE, trophectoderm

Similar articles

References

    1. Aplin JD, Myers JE, Timms K, Westwood M. Tracking placental development in health and disease. Nat Rev Endocrinol. 2020;16:479–94. - PubMed
    1. Li X, Li ZH, Wang YX, Liu TH. A comprehensive review of human trophoblast fusion models: recent developments and challenges. Cell Death Discov. 2023;9:372. - PMC - PubMed
    1. Pastor WA, Kwon SY. Distinctive aspects of the placental epigenome and theories as to how they arise. Cell Mol Life Sci. 2022;79:569. - PMC - PubMed
    1. Hamada H, Okae H, Toh H, Chiba H, Hiura H, Shirane K, et al. Allele-specific methylome and transcriptome analysis reveals widespread imprinting in the human placenta. Am J Hum Genet. 2016;99:1045–58. - PMC - PubMed
    1. Okae H, Toh H, Sato T, Hiura H, Takahashi S, Shirane K, et al. Derivation of human trophoblast stem cells. Cell Stem Cell. 2018;22:50–63. - PubMed

LinkOut - more resources