. 2024 Nov 6;17(1):218.
doi: 10.1186/s13048-024-01538-6.

A novel ITGB8 transcript variant sustains ovarian cancer cell survival through genomic instability and altered ploidy on a mutant p53 background

Affiliations

A novel ITGB8 transcript variant sustains ovarian cancer cell survival through genomic instability and altered ploidy on a mutant p53 background

Aravindan Narayanan et al. J Ovarian Res. .

Abstract

Background: Transcript variants and protein isoforms are central to unique tissue functions and maintenance of homeostasis, in addition to being associated with aberrant states such as cancer, where their crosstalk with the mutated tumor suppressor p53 may contribute to genomic instability and chromosomal rearrangements. We previously identified several novel splice variants in ovarian cancer RNA-sequencing datasets; herein, we aimed to elucidate the biological effects of the Integrin Subunit Beta 8 variant (termed pITGB8-205).

Methods: Resolution of the full-length sequence of pITGB8-205 through rapid amplification of cDNA ends (RACE-PCR). Cell cycle analysis and karyotype studies were performed to further explore genomic instability. RNA-seq and proteomics analyses were used to identify the differential expression of the genes.

Results: This full-length study revealed a unique 5' sequence in pITGB8-205 that differed from the reported ITGB8-205 sequence, suggesting differential regulation of this novel transcript. Under a p53 mutant background, overexpression of pITGB8-205 triggered genetic instability reminiscent of oncogene-induced replicative stress with extensive abnormal mitoses and chromosomal and nuclear aberrations indicative of chromosomal instability, leading to near whole-genome duplication that imposes energy stress on cellular resources. Micronuclei and aneuploidy are striking features of pITGB8-205-overexpressing p53-mutant cells but are not enhanced in p53 wild-type (WT) cells. RNA-seq and proteomics analyses further suggested that p53 inactivation in ovarian cancer provides a permissive intracellular molecular niche for pITGB8-205 to mediate its effects on genomic instability. This observation is pivotal considering that most high-grade serous ovarian carcinoma (HGSC) tumors express mutant p53. The resulting aneuploid clones with enhanced self-renewal and survival capabilities disrupt clonal dominance under stress yet maintain a balance between replicative stress and prosurvival advantages.

Conclusion: pITGB8-205-overexpressing clones sustain ovarian tumor cell survival, achieve homeostasis and are formidable opponents of therapy.

Keywords: Aneuploidy; Genomic instability; ITGB8; Prosurvival mechanisms; p53.


Figures

Fig. 1
Fig. 1
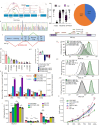
(a) ITGB8 splice graph positioning known variants and novel reads (denoted as dashed lines above and below exons, respectively); (b) Box and whisker plot representing isoform fractions of the alternative continuum of exons in the new variants; (c) pie chart showing the distribution of the number of dead and living patients expressing pITGB8-205; (d) Sanger sequencing-based validation of 133 bp ITGB8 (Exons 2, 4); (e) Novel 5’ pITGB8-205 sequences; (f) Predicted major U2-mediated spliceosome sites in pITGB8-205; (g.i) Overexpression of pITGB8-205 affects cell growth, cycling and metabolism. (a) Profiling of pITGB8-205 full length (2.4 kb) in 10 HGSC cell lines (X-axis indicates the HGSC cell lines, Y-Axis indicates the relative pITGB8-205 FL expression compared with the endogenous control; (g.ii) Screening of pITGB8-205 overexpressing (OVCAR3-OE, A4-OE) and knockdown (PEO14-KD) clones; (h) Bar graph representation of glucose consumption and lactate production (mg/dL; normalized with cell number) of OVCAR3-OE and control cells at 24, 48, 72, 96 and 120 h in culture; (i) Bar graph representing the cell cycle phases in OVCAR3-OE, A4-OE and PEO14-KD vs. control cells; (j) Histogram representing differential label quenching (cell cycling) dynamics of i-OVCAR3-OE, ii-A4-OE and iii-PEO14-KD vs. control cells (Solid lines- OVCAR3-OE/A4-OE/PEO14-KD, Dotted lines - respective controls at 0 (Green) and 96 h (black); (k) Representative doubling times of OVCAR3-OE, A4-OE and PEO14
Fig. 2
Fig. 2
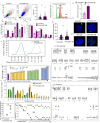
pITGB8-205 overexpression in OVACR3-OE cells triggers genomic and chromosomal instability, altered ploidy, extensive DNA damage, aneuploidy and near-whole-genome duplication. A FACS dot plot comparing cell size and granularity in OVCAR3-OE (right) with control (left) cells; (b) Bar graph comparing the cell area (mm2) of OVCAR3-OE with the respective control cells; (c) Representative FACS histogram comparing the DNA content of OVCAR3-OE with control cells (upper and lower panels, respectively); (d) Bar graph representation of quantified nuclear and chromosomal anomalies (1-lagging chromosomes, 2-anaphase bridges, 3-multinucleated cells, 4-micronuclei); (e) Bar graph representation of increased micronuclei (1), mononucleated (2), binucleate (3), trinucleate (4), and tetranucleated (5) cells in OVACR3-OE over control cells; (f-i) Graphical representation of the percentage of γ-H2AX-positive nuclei and micronuclei in OVCAR3-OE and control cell nuclei, (f-ii) Representative immunofluorescence images of phosphorylated H2AX expression in OVCAR3-OE and control cell nuclei, γ-H2AX (cyan) and nuclei (DAPI); (g-i) Graph indicating the number of γ-H2AX foci per nucleus in OVCAR3-OE vs. control cells, (g-ii) Representative immunofluorescence images of phosphorylated H2AX foci in PEO14-KD vs. control; (h) Comparison of the range of chromosome numbers in OVCAR3-OE and control cells (100 metaphases screened for each); (i) Bar graph representation of the fold change in individual chromosome copy numbers; (j) Representative karyotypes of (i) OVCAR3-OE cells and (ii) Controls; (k) Bar graph representation of translocation events; (l) Dot plot comparing several marker chromosomes in control and OVCAR3-OE cells; (m) Frequency (number of metaphases) harboring specific chromosomes in the marker fraction resolved by Ikaros 6.3
Fig. 3
Fig. 3
Effects of g-irradiation on pITGB8-205 derivative cells and their controls. (a-i) Ratios of surviving cells (irradiated: unirradiated OVCAR3 controls), (irradiated: unirradiated OVCAR3-OE), cells (irradiated: unirradiated PEO14 controls), (irradiated: unirradiated PEO14-KD); (a-ii) Relative expression of pITGB8-205 (vis-à-vis 133 bp of Exons 2 and 4) in postirradiation surviving cells at specific time points; (b-i) Box and whisker plot representation of micronuclei-containing cells in unirradiated and irradiated OVCAR3-OE and control cells as revealed through a cytokinesis-block micronucleus cytome assay; (b-ii) Bar graph showing increased nuclear size in the same cell groups; (b-iii) Line graph indicating the cell cycle perturbation in OVCAR3-OE vs. control cells after irradiation; (b-iv) Histogram representing the altered ploidy in OVCAR3-OE vs. control cells after 0 h, 20 h and 40 h (from top to bottom) after irradiation (blue– OVCAR3 control, green– OVCAR3-OE); (c) Graphical representation of reduced (i) relative mRNA expression of pITGB8-205, (ii) nuclear and chromosomal instabilities in early- and late-passage OVCAR3-OE cells; misaligned metaphases (1), lagging chromosomes (2), anaphase bridges (3), binucleated (4), trinucleated (5), tetranucleated (6), hexanucleated (7), micronuclei (8), lobed nuclei (9), blebbed nuclei (10), notched nuclei (11), ring nuclei (12), cytokinesis defects (13); (d) Bar graph representation γ-H2AX foci in OVCAR3-OE early and late passages (p < 15 and p > 30, respectively) vs. controls; e. Ratios of surviving cells (irradiated: unirradiated OVCAR3 controls) (irradiated: unirradiated OVCAR3-OE-EP) (irradiated: unirradiated OVCAR3-OE-LP)
Fig. 4
Fig. 4
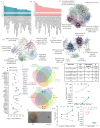
Molecular pathway perturbations driven by pITGB8-205; (a) Bar graph representing GSEA-enriched gene sets in the transcriptomics data of a-i. OVCAR3-OE and a-ii. PEO14-KD cells; (b) STRING protein interaction network of exclusive proteins in b-i. OVCAR3-OE, b-ii. PEO14KD and b-iii A4-OE; (c) Dot plot of enriched proteins for the cellular response to DNA damage stimulus and DNA damage repair in OVCAR3-OE and PEO14-KD; (d) Venn diagram representing the overlap between enriched transcripts and proteins (n = 14), in OVCAR3OE over control, from transcriptomics and proteomics data; (e) The table represents the overlap between OVCAR3-OE enriched proteins with the gene targets of different transcription factors (TFs); (f) Venn diagram representing the overlapping proteins enriched in OE and KD derivatives and their respective controls. (g-i) A4 control vs. A4-OE tumor images harvested on the 36th day after cell injection; (g-ii) Line plot indicating the A4-OE and A4 control tumor volumes at different time intervals (1st week after tumor palpation); (g-ii) Line plot representing the body weights of the mice at the indicated time intervals; (g-iv) Violin plot representing the weight of the harvested tumors

Similar articles

References

    1. Singh P, Fragoza R, Blengini CS, et al. Human MLH1/3 variants causing aneuploidy, pregnancy loss, and premature reproductive aging. Nat Commun. 2021. 10.1038/s41467-021-25028-1 - PMC - PubMed
    1. Kurosaki T, Popp MW, Maquat LE. Quality and quantity control of gene expression by nonsense-mediated mRNA decay. Nat Rev Mol Cell Biol. 2019;20:406–20. - PMC - PubMed
    1. Da Costa PJ, Menezes J, Romão L. The role of alternative splicing coupled to nonsense-mediated mRNA decay in human disease. Int J Biochem Cell Biol. 2017;91:168–75. - PubMed
    1. Marzese DM, Huynh JL, Kawas NP, Hoon DSB. Multiplatform genome-wide analysis of melanoma progression to brain metastasis. Genomics Data. 2014;2:150–2. - PMC - PubMed
    1. El Marabti E, Younis I. The Cancer Spliceome: Reprograming of Alternative Splicing in Cancer. Front Mol Biosci. 2018. 10.3389/fmolb.2018.00080 - PMC - PubMed