. 2024 Nov 6;26(1):153.
doi: 10.1186/s13058-024-01906-6.

The role of heparan sulfate in enhancing the chemotherapeutic response in triple-negative breast cancer

Affiliations

The role of heparan sulfate in enhancing the chemotherapeutic response in triple-negative breast cancer

Jasmine M Manouchehri et al. Breast Cancer Res. .

Abstract

Background: Breast cancer, one of the most common forms of cancer, is associated with the highest cancer-related mortality among women worldwide. In comparison to other types of breast cancer, patients diagnosed with the triple-negative breast cancer (TNBC) subtype have the worst outcome because current therapies do not produce long-lasting responses. Hence, innovative therapies that produce persisting responses are a critical need. We previously discovered that hyperactivating purinergic receptors (P2RXs) by increasing extracellular adenosine triphosphate (eATP) concentrations enhances TNBC cell lines' response to chemotherapy. Heparan sulfate inhibits multiple extracellular ATPases, so it is a molecule of interest in this regard. In turn, heparanase degrades polysulfated polysaccharide heparan sulfate. Importantly, previous work suggests that breast cancer and other cancers express heparanase at high levels. Hence, as heparan sulfate can inhibit extracellular ATPases to facilitate eATP accumulation, it may intensify responses to chemotherapy. We postulated that heparanase inhibitors would exacerbate chemotherapy-induced decreases in TNBC cell viability by increasing heparan sulfate in the cellular microenvironment and hence, augmenting eATP.

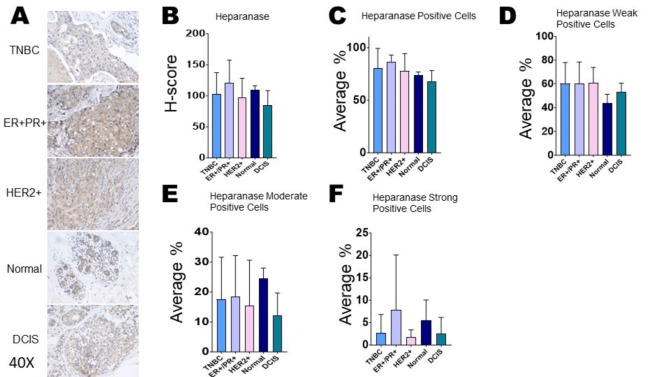
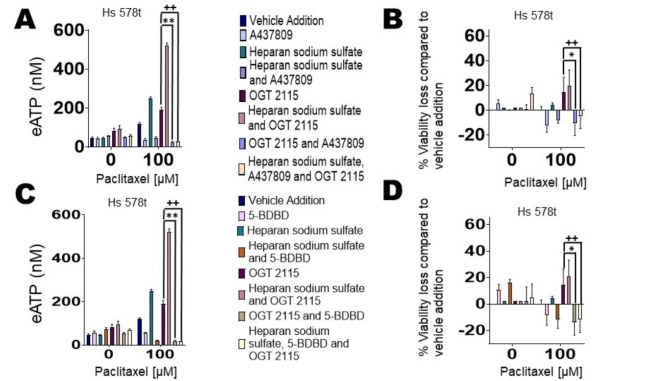
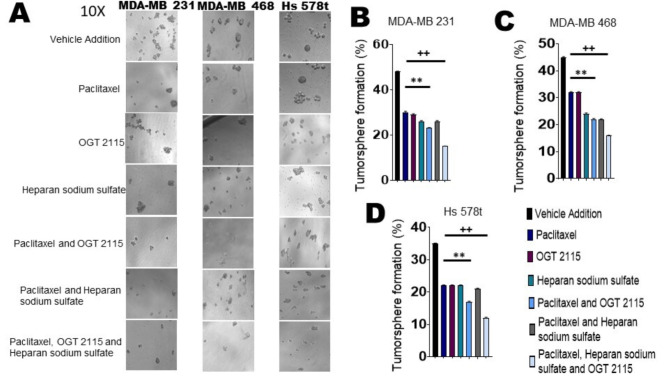
Methods: We treated TNBC cell lines MDA-MB 231, Hs 578t, and MDA-MB 468 and non-tumorigenic immortal mammary epithelial MCF-10A cells with paclitaxel (cytotoxic chemotherapeutic) with or without the heparanase inhibitor OGT 2115 and/or supplemental heparan sulfate. We evaluated cell viability and the release of eATP. Also, we compared the expression of heparanase protein in cell lines and tissues by immunoblot and immunohistochemistry, respectively. In addition, we examined breast-cancer-initiating cell populations using tumorsphere formation efficiency assays on treated cells.

Results: We found that combining heparanase inhibitor OGT 2115 with chemotherapy decreased TNBC cell viability and tumorsphere formation through increases in eATP and activation of purinergic receptors as compared to TNBC cells treated with single-agent paclitaxel.

Conclusion: Our data shows that by preventing heparan sulfate breakdown, heparanase inhibitors make TNBC cells more susceptible to chemotherapy by enhancing eATP concentrations.

Keywords: ATP; Breast cancer; Chemotherapy; Heparan sulfate; Heparanase; Purinergic signaling.


Conflict of interest statement

The authors declare no competing interests.

Figures

Fig. 1
Fig. 1
Heparanase expression in immortal mammary epithelial cells and TNBC cell lines. For the western blot analysis of heparanase, (A) Adjusted volume of cell supernatants, inversely proportionate to the total protein masses in the corresponding cell lysates were probed with heparanase antibody and densitometries analyzed using the student’s t-test to determine significance. * represents p < 0.05 and ** represents p < 0.01 when comparing expression in MCF-10A cells to the expression in TNBC cell lines. (B) Equal amounts of cell lysate from each cell line were probed. Western blots were performed on two biological replicates. The densitometric analyses of the bands were calculated. The student’s t-test was performed to determine significance. * represents p < 0.05 and ** represents p < 0.01 when comparing expression in MCF-10A cells to the expression in TNBC cell lines. (C) Extracellular heparanase expression was determined in nontumorigenic immortal mammary epithelial MCF-10A cells and TNBC MDA-MB 231, Hs 578t, and MDA-MB 468 cells by ELISAs. The standard deviation was calculated from three independent experiments performed in triplicate. The student’s t-test was performed with * representing p < 0.05 and ** representing p < 0.01, comparing expression levels in MCF-10A to those in the TNBC cell lines. (D) Heparan sulfate expression was examined in the supernatants of TNBC cells and control immortal MCF-10A cells via ELISA analysis with MDA-MB 468 expressing the most. The standard deviation was calculated from three independent experiments performed in triplicate. The student’s t-test was performed to determine the significance with * representing p < 0.05 and ** representing p < 0.01 comparing the protein expression in MCF-10A to the protein expressions in the TNBC cell lines. (E) and (F) ROC Plotter was applied to identify whether expression was different between chemotherapy responders (n = 30) and non-responders (n = 124). Low heparanase expression was not significantly predictive of TNBC patient chemotherapy response (ROC p = 0.06, Mann-Whitney p = 0.087)
Fig. 2
Fig. 2
Statistical analysis for heparanase immunohistochemistry comparing different breast cancer subtypes and normal breast tissue. For the breast cancer tissue array and slides stained for heparanase: TNBC (n = 75), ER+/PR+ (n = 18), HER2+ (n = 14), normal (n = 4), and DCIS (n = 5), (A) images were taken of heparanase-stained AMSBIO BR1202B breast cancer tissue array and normal and DCIS slides on an Evos FL Auto 2 microscope (40×). (B) A one-way ANOVA test indicated no significant difference in the H-scores of heparanase-stained cells among subtypes. A Kruskal-Wallis test indicated that there was no significant difference: (C) in the percentage of heparanase positively stained cells in the tissue sections of normal breast tissue, DCIS, and invasive breast cancer subtypes; (D) in the percentage of heparanase weakly stained cells in the tissue sections of normal breast tissue, DCIS, and invasive breast cancer subtypes; (E) in the percentage of heparanase moderately stained cells in the tissue sections of normal breast tissue, DCIS, and invasive breast cancer subtypes; (F) in the percentage of heparanase strongly stained cells in the tissue sections of normal breast tissue, DCIS, and invasive breast cancer subtypes
Fig. 3
Fig. 3
Effects of heparanase inhibitor OGT 2115 and chemotherapeutic agent paclitaxel on cell viability. Percentage loss of cell viability was measured in treated (A) nontumorigenic immortal mammary epithelial MCF-10A cells and TNBC (B) MDA-MB 231, (C) Hs 578t, and (D) MDA-MB 468 cells. The treatments applied were vehicle addition (paclitaxel, purple), heparan sodium sulfate (50 µM, teal), and OGT 2115 (20 µM, purple-red) or the combination (light blue). Heparan sodium sulfate and OGT 2115 were administered for 48 h, and paclitaxel was added for the final 6 h to replicate exposure times in patients. The standard deviation was calculated from three independent experiments performed in triplicate. One-way ANOVA with Tukey’s HSD was applied to ascertain significance. * represents p < 0.05 and ** represents p < 0.01 when comparing vehicle addition to heparan sodium sulfate, OGT 2115, or the combination
Fig. 4
Fig. 4
Heparanase inhibitor OGT 2115 and chemotherapeutic agent paclitaxel influence extracellular ATP concentrations. Extracellular ATP concentrations were measured in the supernatants of treated (A) nontumorigenic immortal mammary epithelial MCF-10 A cells and TNBC (B) MDA-MB 231, (C) Hs 578t, and (D) MDA-MB 468 cells. The treatments: vehicle addition (paclitaxel, purple), heparan sodium sulfate (50 µM, teal), and OGT 2115 (20 µM, purple-red), or the combination regimen (light blue). Heparan sodium sulfate and OGT 2115 were administered for 48 h and paclitaxel was added for the final 6 h to replicate exposure times in patients. The standard deviation was calculated from three independent experiments performed in triplicate. One-way ANOVA with Tukey’s HSD was applied to ascertain significance. * represents p < 0.05 and ** represents p < 0.01 when comparing vehicle addition to heparan sodium sulfate, OGT 2115, or the combination regimen
Fig. 5
Fig. 5
Reversal of heparanase inhibitor’s effects by P2RX4 and P2RX7 inhibitors. For (A) and (B), Hs 578t cells were treated with OGT 2115 (20 µM, 48 h), paclitaxel (100 µM, the final 6 h of the 48-hour time course to replicate exposure times in patients), heparan sodium sulfate (50 µM, 48 h), A437809 (20 µM, 6 h), or a combination of the different drug agents. The standard deviation was calculated from three independent experiments performed in triplicate. One-way ANOVA with Tukey’s HSD was applied to ascertain significance. * represents p < 0.05 and ** represents p < 0.01 when comparing paclitaxel and OGT 2115 to paclitaxel, OGT 2115 and A437809 and + + represents p < 0.01 when comparing paclitaxel, OGT 2115 and heparan sulfate to paclitaxel, OGT 2115, heparan sodium sulfate and A437809. For (C) and (D) Hs 578t cells were treated with OGT 2115 (20 µM, 48 h), paclitaxel (100 µM, final 6 h of the 48-hour time course to replicate exposure times in patients), heparan sodium sulfate (50 µM, 48 h), 5-BDBD (20 µM, 6 h), or combinations. The standard deviation was calculated from three independent experiments performed in triplicate. One-way ANOVA with Tukey’s HSD was applied to ascertain significance. * represents p < 0.05; ** represents p < 0.01 when comparing paclitaxel and OGT 2115 to paclitaxel, OGT 2115 and 5-BDBD and + + represents p < 0.01 when comparing paclitaxel, OGT 2115 and heparan sulfate to paclitaxel, OGT 2115, heparan sodium sulfate and 5-BDBD
Fig. 6
Fig. 6
Tumorsphere formation efficiency assays for treated TNBC cells. Effects of heparanase inhibitor on cancer-initiating cells were determined through the tumorsphere formation efficiency assay in which TNBC cell lines were treated with vehicle (DMSO), paclitaxel (100 µM, final 6 h of the 48-hour time course to replicate exposure times in patients), heparan sodium sulfate (50 µM, 48 h), OGT 2115 (20 µM, 48 h), or the different combinations listed. (A) Tumorsphere images obtained (10×) are displayed for each treatment of MDA-MB 231, MDA-MB 468, and Hs 578t cells with paclitaxel, OGT 2115, heparan sodium sulfate, or the different combinations. The combination regimens showed a significant decrease in tumorsphere formation when compared to the single-agent treatments of vehicle, paclitaxel, heparan sodium sulfate, or OGT 2115 treated (B) MDA-MB 231, (C) MDA-MB 468, and (D) Hs 578t cells. Three independent experiments were performed in triplicate. One-way ANOVA with Tukey’s HSD was applied to ascertain significance. ** represents p < 0.01 when comparing paclitaxel to paclitaxel and OGT 2115. ++ represents p < 0.01 when comparing paclitaxel to paclitaxel, heparan sodium sulfate, and OGT 2115

Update of

References

    1. Breast, Cancer. [https://www.who.int/cancer/prevention/diagnosis-screening/breast-cancer/en/]
    1. Dent R, Hanna WM, Trudeau M, Rawlinson E, Sun P, Narod SA. Pattern of metastatic spread in triple-negative breast cancer. Breast Cancer Res Treat. 2009;115(2):423–8. - PubMed
    1. Fisher CS, Ma CX, Gillanders WE, Aft RL, Eberlein TJ, Gao F, Margenthaler JA. Neoadjuvant chemotherapy is associated with improved survival compared with adjuvant chemotherapy in patients with triple-negative breast cancer only after complete pathologic response. Ann Surg Oncol. 2012;19(1):253–8. - PMC - PubMed
    1. Ovcaricek T, Frkovic SG, Matos E, Mozina B, Borstnar S. Triple negative breast cancer - prognostic factors and survival. Radiol Oncol. 2011;45(1):46–52. - PMC - PubMed
    1. Bakker WW, Donker RB, Timmer A, van Pampus MG, van Son WJ, Aarnoudse JG, van Goor H, Niezen-Koning KE, Navis G, Borghuis T, et al. Plasma hemopexin activity in pregnancy and preeclampsia. Hypertens Pregnancy. 2007;26(2):227–39. - PubMed

MeSH terms

LinkOut - more resources