. 2024 Nov 6;22(1):1003.
doi: 10.1186/s12967-024-05748-w.

Etrinabdione (VCE-004.8), a B55α activator, promotes angiogenesis and arteriogenesis in critical limb ischemia

Affiliations

Etrinabdione (VCE-004.8), a B55α activator, promotes angiogenesis and arteriogenesis in critical limb ischemia

Adela García-Martín et al. J Transl Med. .

Abstract

Background: Vasculogenic therapies explored for the treatment of peripheral artery disease (PAD) have encountered minimal success in clinical trials. Addressing this, B55α, an isoform of protein phosphatase 2A (PP2A), emerges as pivotal in vessel remodeling through activation of hypoxia-inducible factor 1α (HIF-1α). This study delves into the pharmacological profile of VCE-004.8 (Etrinabdione) and evaluates its efficacy in a preclinical model of critical limb ischemia, with a focus on its potential as a PP2A/B55α activator to induce angiogenesis and arteriogenesis.

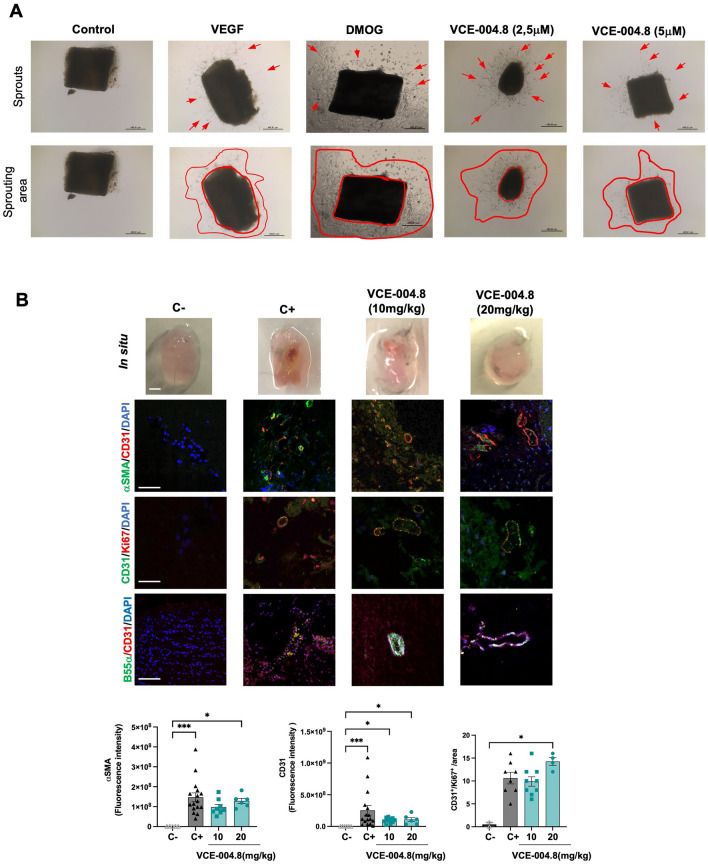
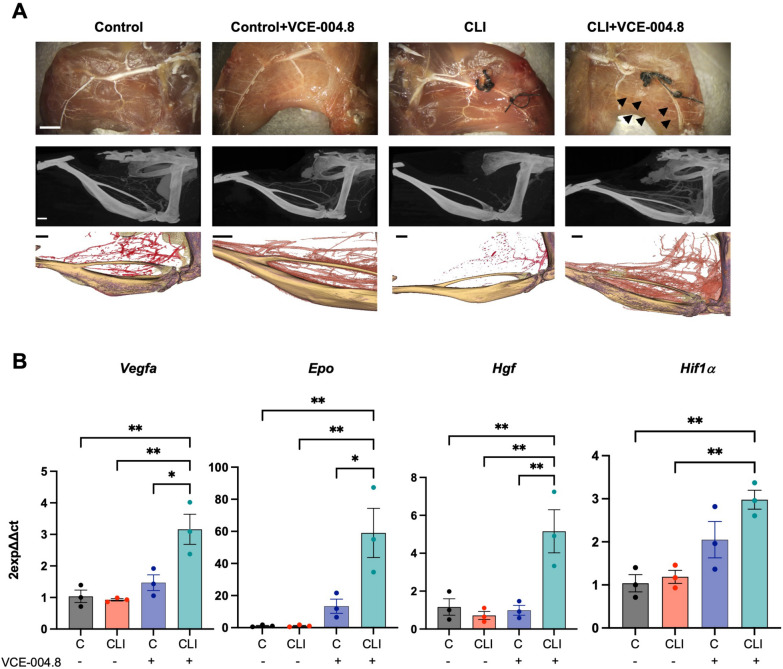
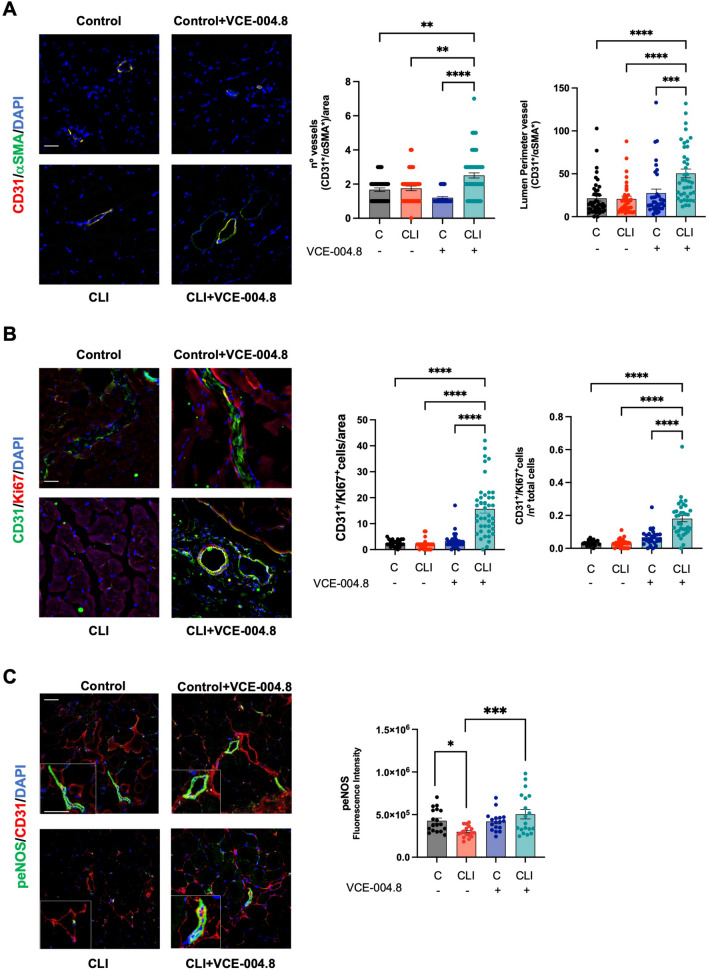
Methods: Vascular endothelial cells were used for in vitro experiments. Aorta ring assay was performed to explore sprouting activity. Matrigel plug-in assay was used to assess the angiogenic potential. Critical limb ischemia (CLI) in mice was induced by double ligation in the femoral arteria. Endothelial vascular and fibrotic biomarkers were studied by immunohistochemistry and qPCR. Arteriogenesis was investigated by microvascular casting and micro-CT. Proteomic analysis in vascular tissues was analyzed by LC-MS/MS. Ex-vivo expression of B55α and biomarkers were investigated in artery samples from PAD patients.

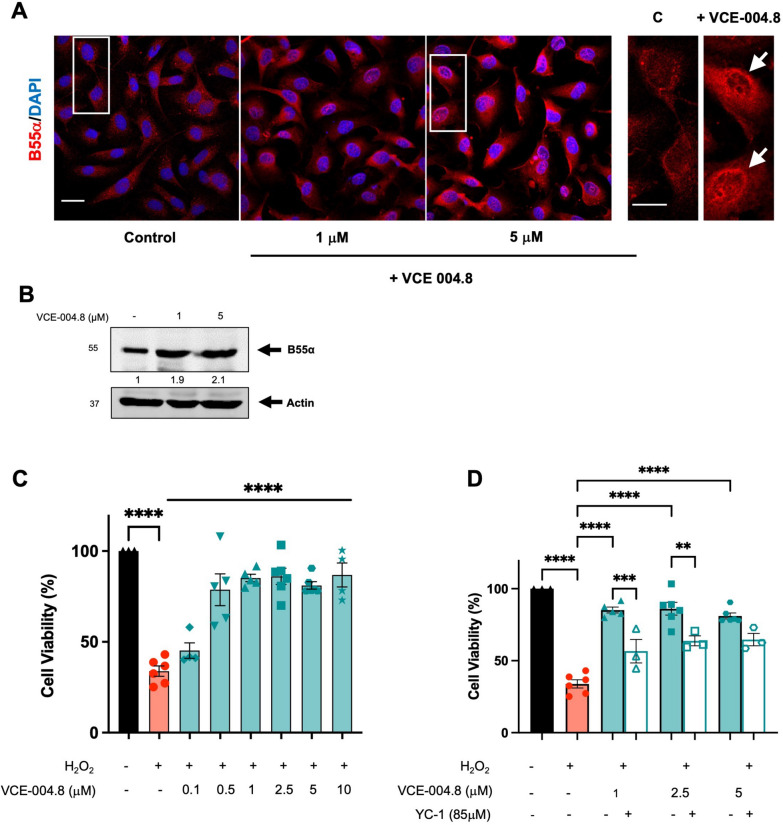
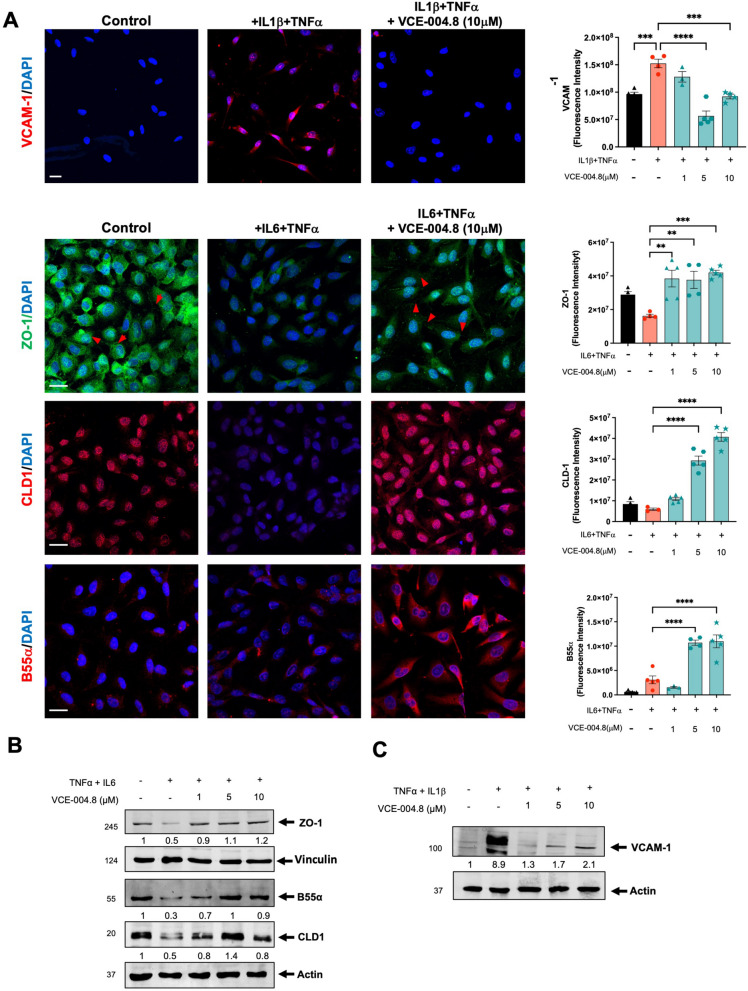
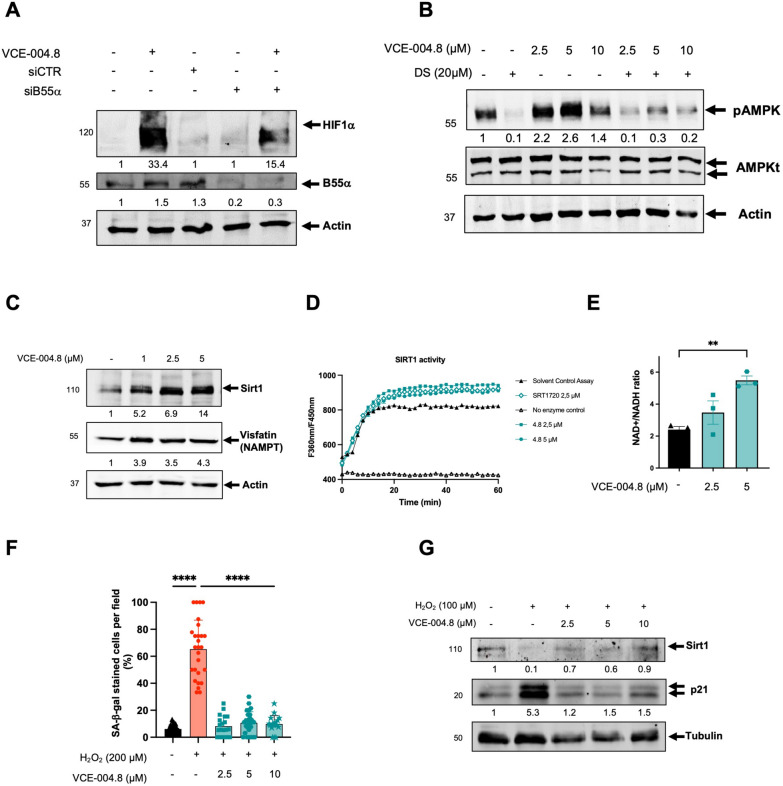
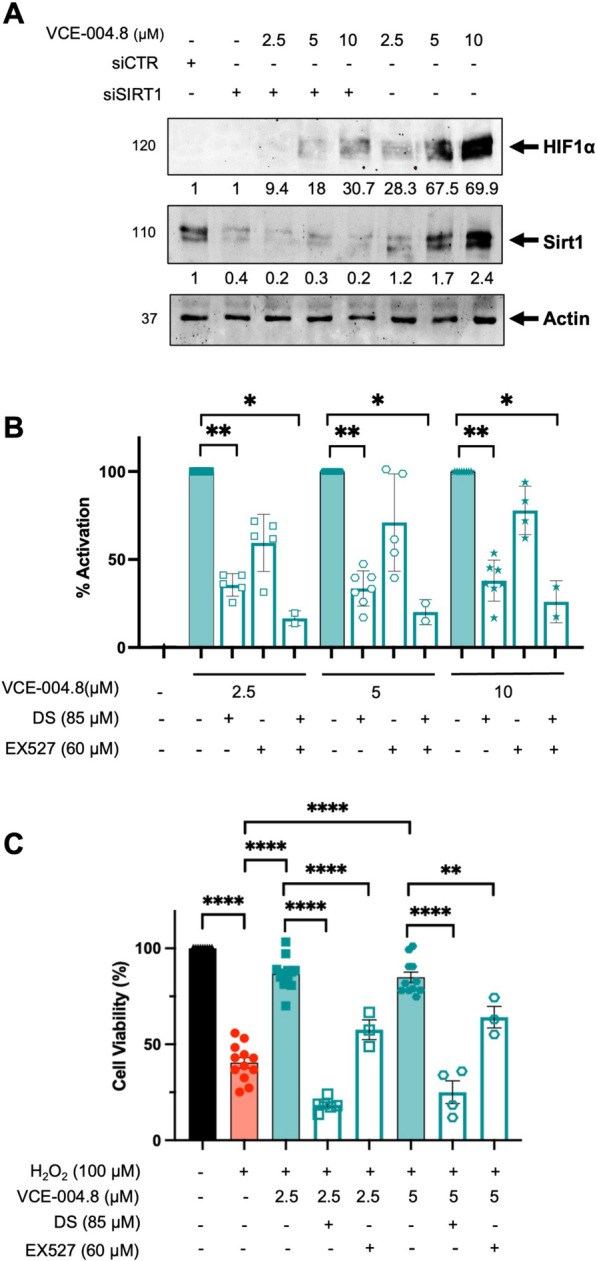
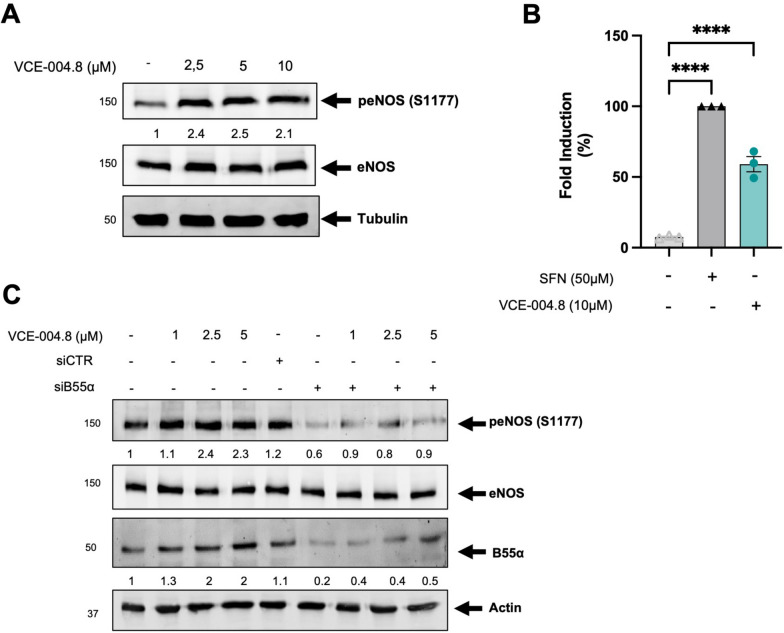
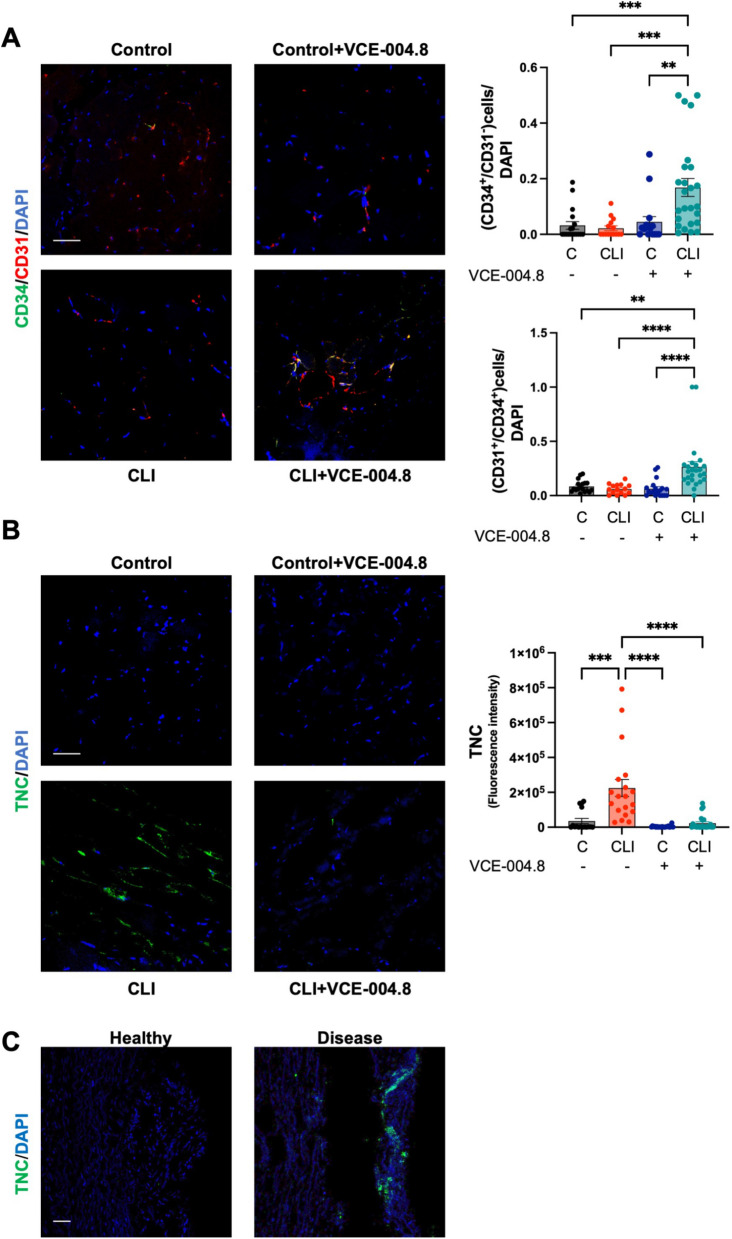
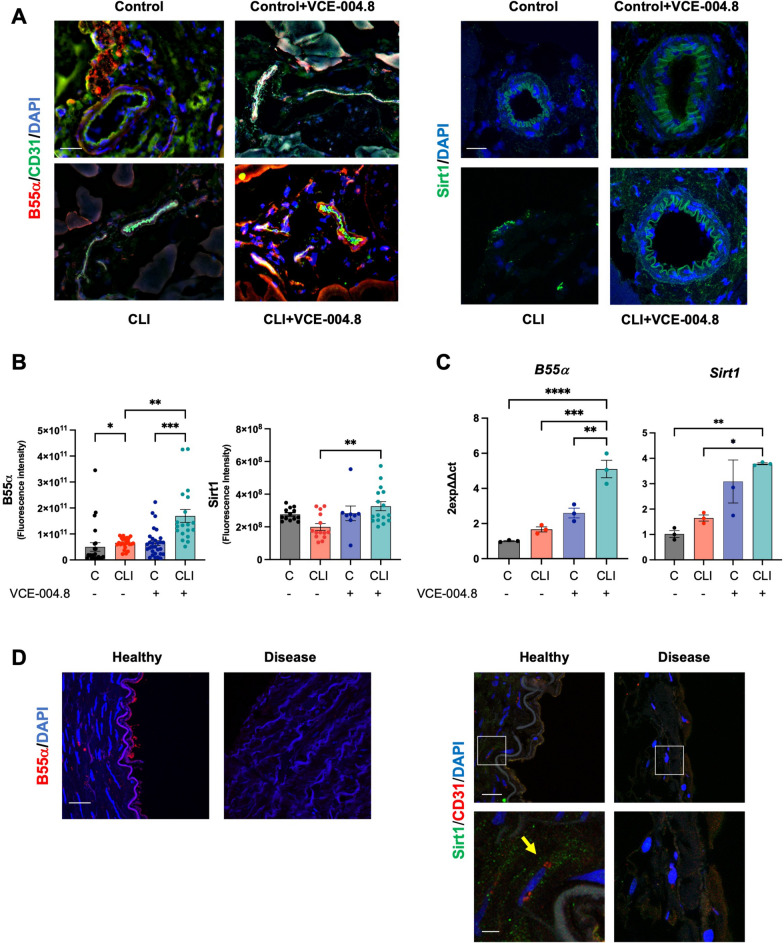
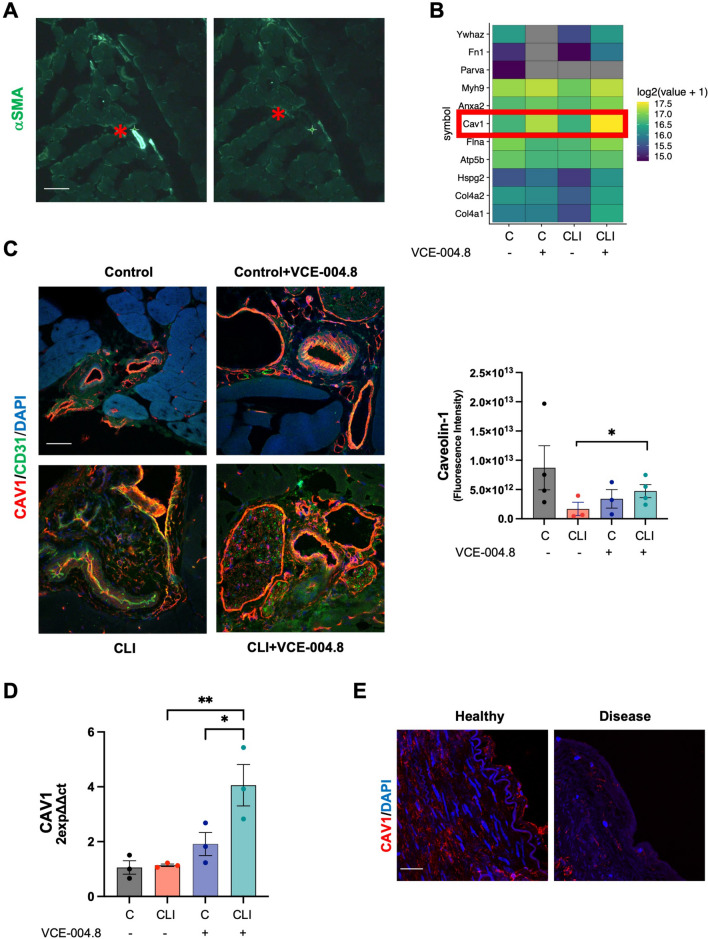
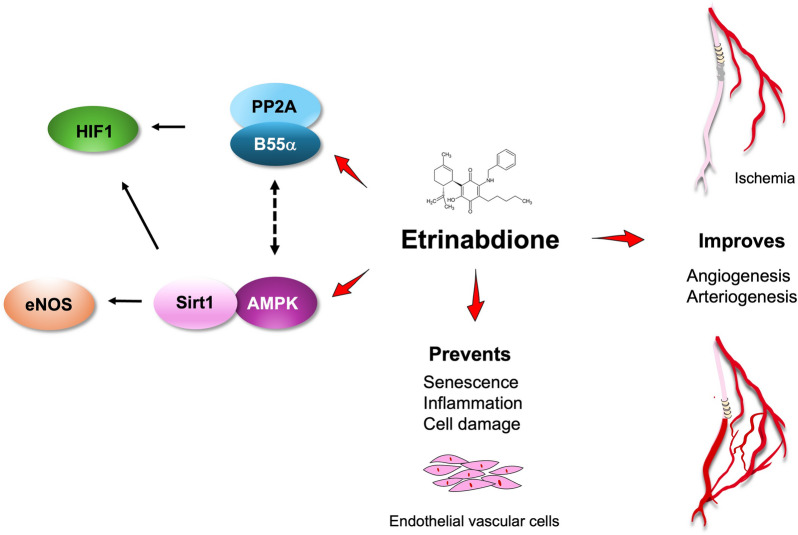
Results: VCE-004.8 exhibited the ability to induce B55α expression and activate the intersecting pathways B55α/AMPK/Sirtuin 1/eNOS and B55α/PHD2/HIF-1α. VCE-004.8 prevented OxLDL and H2O2-induced cytotoxicity, senescence, and inflammation in endothelial cells. Oral VCE-004.8 increased aorta sprouting in vitro and angiogenesis in vivo. In CLI mice VCE-004.8 improved collateral vessel formation and induced endothelial cells proliferation, angiogenic gene expression and prevented fibrosis. The expression of B55α, Caveolin 1 and Sirtuin-1 is reduced in arteries from CLI mice and PAD patient, and the expression of these markers was restored in mice treated with VCE-004.8.

Conclusions: The findings presented in this study indicate that Etrinabdione holds promise in mitigating endothelial cell damage and senescence, while concurrently fostering arteriogenesis and angiogenesis. These observations position Etrinabdione as a compelling candidate for the treatment of PAD, and potentially other cardiovascular disorders.

Keywords: Angiogenesis; Etrinabdione; HIF-1α; PPA2/B55α; Sirtuin 1; VCE-004.8; eNOS.


Conflict of interest statement

AGM, ILC, and EM have applied for a European Patent based on some of the data presented herein.

Figures

Fig. 1
Fig. 1
VCE-004.8 induces B55α/PP2A expression and activates HIF-1α in endothelial EA.hy926 cells. A Representative confocal image of B55α expression in EA.hy926 cells untreated and treated with VCE-004.8 for 24 h. Magnified region (marked by the white rectangle) shows preferential perinuclear expression of B55α as indicated by white arrows. Scale bars equivalent to 25 μm. B Effect of VCE-004.8 on EA.hy926 cells treated for 24 h. Representative western blots of three independent experiments are shown. B55α protein expression is normalized relative to actin protein expression and results were expressed relative to control defined as 1. C Effect of VCE-004.8 on cell viability. EA.hy926 cells were pre-incubated with increasing concentrations of VCE-004.8 during 1 h and then exposed to H2O2 for 24 h. Cell viability was investigated by MTT assay. The data passed the normality test performed by the Kolmogorov–Smirnov test. P value is calculated using 1-way ANOVA followed by Tukey post hoc multiple comparisons to compare between the groups (n > 4 independent experiments per group), the results are shown as mean ± SEM. D Cytoprotective activity of VCE-004.8 is partially dependent on HIF-1α activation. EA.hy926 cells were pretreated with VCE-004.8 in the absence and the presence of the HIF-1α inhibitor YC-1 and then exposed to H2O2. Cell viability was investigated by MTT assay. The data passed the normality test performed by the Shapiro–Wilk test. P value is calculated using 1-way ANOVA followed by Tukey post hoc multiple comparisons to compare between the groups (n > 3 independent experiments per group); the results are shown as means ± SEM. The results are shown as means ± SEM. P values indicated in panels, significant as **p < 0.01, ***p < 0.001, ****p < 0.0001
Fig. 2
Fig. 2
VCE-004.8 alleviates inflammation of vascular endothelial cells. A Representative image of VCAM, ZO-1, CLD1 and B55α expression in EA.hy926 cells stimulated for 24 h with proinflammatory cytokines and their quantifications. Scale bars (25 μm). The data passed the normality test performed by the Shapiro Wilk test. P value is calculated using 1-way ANOVA followed by Tukey post hoc multiple comparisons to compare between the groups (n = 3 independent experiments per group). B EA.hy926 cells preincubated with VCE-004.8 for 1 h and then treated with TNFα and IL6 for 24 h. ZO-1, CLD1 and B55α expression was analyzed by immunoblotting. Representative western blots of three independent analyses are shown. B55α and CLD1 protein expressions are normalized to actin. ZO-1 protein expression is normalized relative to vinculin. Results were expressed relative to control defined as 1. C VCAM-1 expression was analyzed by immunoblotting. Protein expression is normalized relative to actin and results were expressed relative to control defined as 1. The results are shown as mean ± SEM. P values indicated in panels, significant as **p < 0.01, ***p < 0.001 ****p < 0.0001
Fig. 3
Fig. 3
VCE-004.8 activates AMPK/Sirt1 pathway and prevents cellular senescence. A EA.hy926 cells were transfected with siB55α or scrambled siRNAs (siCTR) and 48 h later and treated with VCE-004.8 for 3 h. B55α and HIF-1α protein expression were analyzed by immunoblotting, normalized relative to actin protein and the results expressed relative to control defined as 1. B HEK-293T cells preincubated with or without DS for 30 min and stimulated for 3 h with increasing concentrations of VCE-004.8 and the steady state levels of pAMPK total AMPK and actin detected by western blot. pAMPK protein expression is normalized relative to total AMPK protein and results were expressed relative to control defined as 1. C EA.hy296 cells were stimulated with VCE-004.8 for 3 h and the expression of Sirt1 and Visfatin (NAMPT) was analyzed by western blot. Sirt1 and Visfatin (NAMPT) protein expressions are normalized to actin and results were expressed relative to control defined as 1. D VCE-004.8 induces Sirt1 activity measured by a fluorometric assay. SRT1720 was used as a positive control. Data represent the mean ± SD (n = 3). E NAD+/NADH ratio was determined in EA.hy296 cells. The data passed the normality test performed by the Shapiro–Wilk test. P value is calculated using 1-way ANOVA followed by Tukey post hoc multiple comparisons to compare between the groups (n = 3 independent experiments per group). The results are shown as means ± SEM. P value indicated in panel, significant as **p < 0.01. F VCE-004.8 prevents H2O2-induced senescence measured by SA-β-gal staining in HMEC-1 cells. The data passed the normality test performed by the D’Agostino and Pearson test. P value is calculated using 1-way ANOVA followed by Tukey post hoc multiple comparisons to compare between the groups (n > 18 represent areas of cell surface from 3 independent experiments). The results are shown as means ± SD. P values indicated in panel, significant as ****p < 0.0001. G HMEC-1 cells were incubated with VCE-004.8 and exposed to H2O2 and the expression of Sirt1, p21 and tubulin detected by western blot. Western blots are representative of 3 independent experiments. Sirt1 and p21 protein expressions are normalized relative to tubulin protein expression and results were expressed relative to control defined as 1
Fig. 4
Fig. 4
VCE-004.8 activates HIF-1α and prevents H2O2-induced cytotoxicity through AMPK/Sirt1. A HEK-293T cells were transfected with siSIRT1 or scrambled siRNA and treated with VCE-004.8 for 3 h Western blots are representative of 3 independent experiments. HIF-1α and Sirt1 protein expressions are normalized relative to actin protein and results were expressed relative to control defined as 1. B NIH-3T3-EPO-luc cells were treated with VCE-004.8 in the absence and the presence of AMPK and Sirt1 inhibitors for 6 h and luciferase activity measured and expressed as percentage of activation considering VCE-004.8 as 100% activation. Data represent the mean ± SD (n = 2–7). The significance was determined non-parametric followed by a Kruskal–Wallis test. P values indicated in panels, significant as *p < 0.05, **p < 0.01. C EA.hy926 cells were preincubated either with DS or Ex527 and treated with VCE-004.8 during 1 h before exposure to H2O2 for 24 h. Cytotoxicity was measured by the MTT method. The data passed the normality test performed by the Shapiro–Wilk test. P value is calculated using 1-way ANOVA followed by Dunnett’s post hoc multiple comparisons to compare between the groups. Data represent the mean ± SD (n = 3–12). P values indicated in panels, significant as **p < 0.01, ****p < 0.0001
Fig. 5
Fig. 5
VCE-004.8 induces eNOS phosphorylation and NO synthesis. A EA.hy926 cells were treated with VCE-004.8 for 3 h. peNOS protein expression is normalized to eNOS and results were expressed relative to control defined as 1. B VCE-004.8 induces NO production. EA.hy296 cells were seeded, preincubated with DAF-2DA and treated with sulforaphane (SFN) (50 µM) or VCE-004.8 (10 µM). The figure indicated the percentage of NO induction over untreated cells. The data passed the normality test performed by the Shapiro–Wilk test. P value is calculated using 1-way ANOVA followed by Tukey post hoc multiple comparisons to compare between the groups (n = 3 independent experiments per group). The results are shown as means ± SD. P value indicated in panel, significant as ****p < 0.0001. C VCE-004.8 induces phosphorylation in vascular endothelial cells in a B55α dependent manner. EA.hy296 cells were transfected with siB55α or scrambled siRNAs (siCTR) and 48 h later treated with VCE-004.8 for 3 h. Representative western blots of three independent experiments is shown. peNOS and B55α protein expressions are normalized to eNOS and actin respectively and the results were expressed relative to control defined as 1
Fig. 6
Fig. 6
VCE-004.8 induces angiogenesis in vitro and in vivo A Representative images of aortic ring assay. Red arrows indicate sprouts, and red lines delimit sprouting area. The scales are indicated in the images. B Macroscopic (top) (scale bar equivalent to 1 mm) and confocal images of immunofluorescence staining of Matrigel sections of double immunofluorescence staining of α-SMA (green)/CD31 (red), CD31 (green)/Ki67(red), B55α (green)/CD31(red). Scale bars equivalent to 50 μm for confocal images. For α-SMA staining quantification, the data passed the normality test performed by the Kolmogorov–Smirnov test. P value is calculated using one-way ANOVA followed by Tukey test compare between the groups (n = 3). For CD31 staining quantification, the significance was determined non-parametric followed by a Kruskal–Wallis test (n = 3). Double staining CD31/Ki67 was used to quantify vascular endothelial cells proliferation per area (CD31+/Ki67+ cells). The significance was determined non-parametric followed by a Kruskal–Wallis test (n = 3). The results are shown as mean ± SEM. P values indicated in panels, significant as *p < 0.05, **p < 0.01, ***p < 0.001
Fig. 7
Fig. 7
Effects of oral VCE-004.8 in a Critical Limb Ischemia mouse model. A Representative whole-mount images of Microfil vascular cast limbs 10 days after ischemia (upper panel) (Scale bar 2 mm), µ-CT reconstruction, and their segmentation of arterial vasculature 28 days (middle and lower panel) (Scale bar 1 mm) after femoral artery ligation. Collateral artery growth is indicated by black arrows. B Expression of Vegf-a, Epo, Hgf, and Hif1α mRNA in the gastrocnemius after 10 days of ischemia. The data passed the normality test performed by the Shapiro–Wilk test. P value is calculated using 1-way ANOVA followed by Tukey post hoc multiple comparisons to compare between the groups (n = 3 animals per group). The results are shown as means ± SEM. P value indicated in panel, significant as *p < 0.05, **p < 0.01
Fig. 8
Fig. 8
Oral VCE-004.8 enhances ischemia-induced vessel formation and vascular endothelial cells proliferation in vivo. A Double immunofluorescence confocal staining of α-SMA (green)/CD31 (red) in gastrocnemius muscles 28 days after ischemia. Quantification of the number of vessel peer area and the perimeter of the lumen vessel. As the data cannot passed the normality test. P values are calculated using a nonparametric Kruskal–Wallis test followed by Dunn multiple. The results are shown as mean ± SEM. P values indicated in panels, significant as **p < 0.01, ***p < 0.001, ****p < 0.0001. B The number of CD31+/Ki67+ positive cells per area and number of CD31+/Ki67+ cells per total cells were quantified using double immunofluorescence confocal staining of CD31 (green) and Ki67 (red) in gastrocnemius muscles 28 day after ischemia. Significance was determined by one-way ANOVA followed by Tukey’s test. The results are shown as means ± SEM (n = 3). P values indicated in panels, significant as ****p < 0.0001. C Double immunofluorescence confocal staining of peNOS (green) and CD31 (red) in gastrocnemius muscles 10 days after ligation and quantifications. Magnified region (marked by the white rectangle) shows detailed colocalization of peNOS and CD31 expression. Scale bars equivalent to 50 μm. The data do not pass the normality test performed, and the significance was determined non-parametric followed by a Kruskal–Wallis test. Values are mean ± SEM (n = 3–4). P values indicated in panels, significant as *p < 0.1, ***p < 0.001
Fig. 9
Fig. 9
Oral VCE-004.8 enhanced ischemia-induced de novo vessel and alleviated fibrosis in vivo. A Double immunofluorescence confocal staining of CD34 (green)/CD31 (red) in gastrocnemius muscles 28 days was used to calculate the number of CD34+/CD31 cells (immature endothelial vascular cells) and CD34+/CD31+ (mature endothelial vascular cells). Scale bars equivalent to 50 μm. Values are mean ± SEM (n = 3–4). In both quantifications, the significance was determined by one-way ANOVA non-parametric followed by a Kruskal–Wallis test. P values indicated in panels, significant as **p < 0.01; ***p < 0.001; ****p < 0.0001. B Immunofluorescence staining of TNC (green) in gastrocnemius muscles 28 days after ischemia and quantifications. Scale bars equivalent to 50 μm. Values are mean ± SEM (n = 3–4), and significance was determined by one-way ANOVA non-parametric followed by Kruskal–Wallis test. P values indicated in panels, significant as ***p < 0.001; ****p < 0.0001. C Representative immunofluorescence staining of TNC in cross-section of healthy and disease human arteries. Scale bars equivalent to 50 μm
Fig. 10
Fig. 10
Effects of VCE-004.8 on B55α and Sirt1 expression in vivo. A Representative double immunofluorescence confocal staining of B55α (red)/CD31 (green) (left) (scale bar equivalent to 50 µm) and immunofluorescence staining of Sirt1(green) (right) (scale bar equivalent to 20 µm) in gastrocnemius muscles 10 days after ischemia. B Quantifications of B55α (left) and Sirt1 (right). For B55α and Sirt1 quantification, the data do not pass the normality test performed, and the significance was determined non-parametric followed by a Kruskal–Wallis test. Values are mean ± SEM (n = 3–4). P values indicated in panels, significant as *p < 0.05 as **p < 0.01; ***p < 0.001. C Expression of B55α and Sirt1 mRNA in mice gastrocnemius at 10 days after femoral ligation. The data passed the normality test performed by the Shapiro–Wilk test. P value is calculated using 1-way ANOVA followed by Tukey post hoc multiple comparisons to compare between the groups (n = 3 animals per group). The results are shown as mean ± SEM. P value indicated in panel, significant as *p < 0.05; **p < 0.01; ***p < 0.001; ****p < 0.0001. D Representative immunofluorescence image of B55α (red) in cross-section of healthy and disease human arteries (left) (scale bar equivalent to 50 µm) and representative double immunofluorescence staining of Sirt1 (green) and CD31 (red) in cross-section of healthy and disease human arteries (right) (scale bar equivalent to 50 µm). Magnified region (white rectangle) showing details of Sirt1 expression (yellow arrow) (scale bar equivalent to 10 µm)
Fig. 11
Fig. 11
Oral VCE-004.8 upregulates CAV1 expression in vivo. A Overview of laser capture microdissection. Representative images vessel marked with αSMA in gastrocnemius before (left) and after (right) laser dissection indicated by red asterisk. Scale bar equivalent to 50 μm. B Heatmap showing the expression levels for the resulting list of 11 proteins. Color indicates the mean of scaled regularized log transformed expression values. Red square indicates CAV1. C Representatives images of double immunostaining of CAV1(red) and CD31 (green) in gastrocnemius 10 days after ischemia (left) and the CAV1 staining quantification (right). Scale bar equivalent to 50 μm. The significance was determined non-parametric followed by a Kruskal–Wallis test. In both quantification, values are mean ± SEM, (n = 3). P values indicated in panels, significant as *p < 0.05. D Expression of Cav1 mRNA. The data passed the normality test performed by the Shapiro–Wilk test. P value is calculated using 1-way ANOVA followed by Tukey post hoc multiple comparisons to compare between the groups test (n = 3 animals per group). The results are shown as mean ± SEM. Values indicated in panels, significant as *p < 0.05; **p < 0.01. E Representative immunofluorescence staining of CAV1 in cross-section of healthy and disease human arteries. Scale bar equivalent to 50 μm
Fig. 12
Fig. 12
Potential mechanism of action of Etrinabdione (VCE-004.8)

References

    1. Annex BH, Cooke JP. New directions in therapeutic angiogenesis and arteriogenesis in peripheral arterial disease. Circ Res. 2021;128:1944–57. - PMC - PubMed
    1. Beckman JA, Schneider PA, Conte MS. Advances in revascularization for peripheral artery disease: revascularization in PAD. Circ Res. 2021;128:1885–912. - PubMed
    1. Clark AR, Ohlmeyer M. Protein phosphatase 2A as a therapeutic target in inflammation and neurodegeneration. Pharmacol Ther. 2019;201:181–201. - PMC - PubMed
    1. Di Conza G, Trusso Cafarello S, Loroch S, Mennerich D, Deschoemaeker S, Di Matteo M, et al. The mTOR and pp2a pathways regulate PHD2 phosphorylation to fine-tune HIF1α levels and colorectal cancer cell survival under hypoxia. Cell Rep. 2017;18:1699–712. - PMC - PubMed
    1. Appelhoff RJ, Tian Y-M, Raval RR, Turley H, Harris AL, Pugh CW, et al. Differential function of the prolyl hydroxylases PHD1, PHD2, and PHD3 in the regulation of hypoxia-inducible factor. J Biol Chem. 2004;279:38458–65. - PubMed

LinkOut - more resources