. 2024 Nov 6;13(1):82.
doi: 10.1186/s40249-024-01252-x.

Global burden of zoonotic infectious diseases of poverty, 1990-2021

Affiliations

Global burden of zoonotic infectious diseases of poverty, 1990-2021

Chao Lv et al. Infect Dis Poverty. .

Abstract

Background: The zoonotic infectious diseases of poverty (zIDPs) are a group of diseases contributing to global poverty, with significant impacts on a substantial population. This study aims to describe the global, regional, and national burden of zIDPs-schistosomiasis, cystic echinococcosis, cysticercosis, and food-borne trematodiases (FBTs)-to support policy making and resource allocation for their control and elimination.

Methods: Data of zIDPs from the Global Burden of Diseases, Injuries, and Risk Factors Study (GBD) 2021 were retrieved from 1990 to 2021. The age-standardized prevalence rate (ASPR), age-standardized mortality rate (ASMR), and age-standardized disability-adjusted life-year (DALY) rate were described and the estimated annual percentage changes (EAPCs) were calculated to quantify their burden and temporal trends. Spearman correlation analysis was conducted to examine the relationship between age-standardized rates and Socio-demographic Index (SDI).

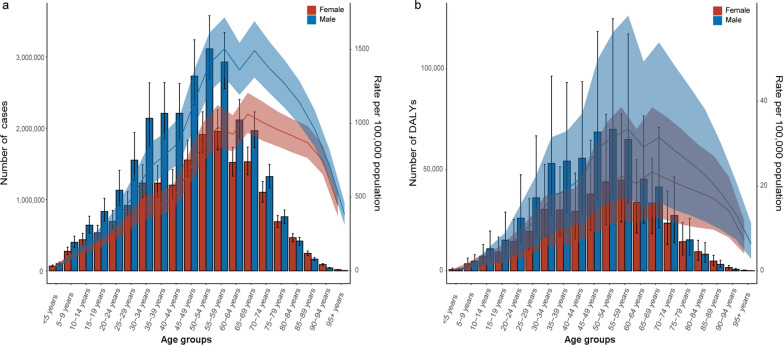
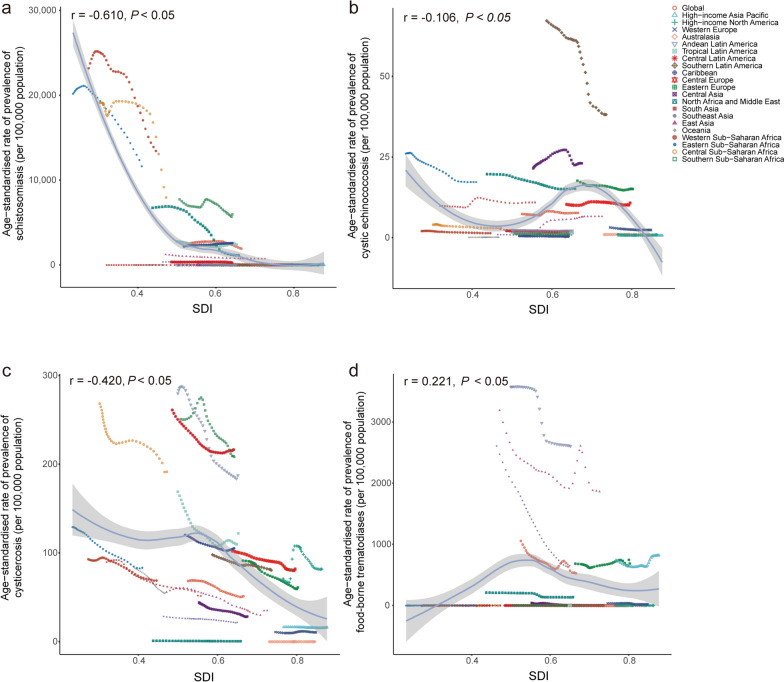
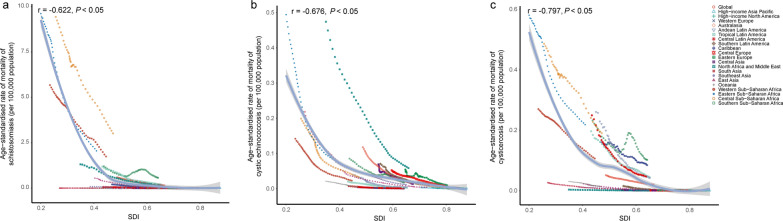
Results: In 2021, these zIDPs exhibited a certain level of ASPRs and age-standardized DALY rates, while maintaining relatively low ASMRs. Noticeably, schistosomiasis presented the highest ASPR of 1914.299 (95% UI: 1378.920, 2510.853 per 100,000 population) and an age-standardized DALY rate of 21.895 (95% UI: 12.937, 37.278 per 100,000 population) among the zIDPs. The tapestry of burden-woven predominantly through low and lower-middle SDI regions-stretched across Africa, Latin America, and parts of Asia. From 1990 to 2021, a kaleidoscopic shift was observed globally as ASPRs, ASMRs, and age-standardized DALY rates declined significantly, as reflected by the EAPC values. Negative correlations were observed between the ASPRs, ASMRs, age-standardized DALY rates of schistosomiasis (r value = - 0.610, - 0.622 and - 0.610), cystic echinococcosis (- 0.676 of ASMR, - 0.550 of age-standardized DALYs), cysticercosis (- 0.420, - 0.797 and - 0.591) and the SDI. In contrast, a slight positive correlation was noted between the ASPR, age-standardized DALY rates of FBTs and SDI with r value of 0.221 and 0.213, respectively.

Conclusion: The burden of zIDPs declined across almost all endemic regions from 1990 to 2021, yet still predominated in low and low-middle SDI regions. Substantial challenges exist to achieve the goal of control and elimination of zIDPs, and integrated approaches based on One Health need to be strengthened to improve health outcomes.

Keywords: Age-standardized rate; Cystic echinococcosis; Cysticercosis; Disability-adjusted life year; Food borne trematodiases; Global burden of disease; Prevalence; Schistosomiasis.


Conflict of interest statement

The authors declare that there are no competing interests.

Figures

Fig. 1
Fig. 1
The prevalence (a), deaths (b), and DALYs (c) of schistosomiasis for both gender and all age groups. DALYs: disability-adjusted life years. The left axis was the cases (a), deaths (b), and number of DALYs (c), and the right axis was the age-standardized rates of prevalence (a), mortality (b), and DALYs (c). The fold lines represent the change of the age-standardized rates (per 100,000 population) in different age groups. The shaded areas represent 95% uncertainty interval (UI) of the fold lines
Fig. 2
Fig. 2
The prevalence (a), deaths (b), and DALYs (c) of cystic echinococcosis for both gender and all age groups. DALYs: disability-adjusted life years. The left axis was the new cases (a), cases (b), deaths (c), and number of DALYs (d), and the right axis was the age-standardized rates of incidence (a), prevalence (b), mortality (c), and DALYs (c). The fold lines represent the change of the age-standardized rates (per 100,000 population) in different age groups. The shaded areas represent 95% uncertainty interval (UI) of the fold lines
Fig. 3
Fig. 3
The prevalence (a), deaths (b), and DALYs (c) of cysticercosis for both gender and all age groups. DALYs: disability-adjusted life years. The left axis was the cases (a), deaths (b), and number of DALYs (c), and the right axis was the age-standardized rates of prevalence (a), mortality (b), and DALYs (c). The fold lines represent the change of the age-standardized rates (per 100,000 population) in different age groups. The shaded areas represent 95% uncertainty interval (UI) of the fold lines
Fig. 4
Fig. 4
The prevalence (a), and DALYs (b) of foodborne trematodiases for both gender and all age groups. DALYs: disability-adjusted life years. The left axis was the cases (a), and number of DALYs (b), and the right axis was the age-standardized rates of prevalence (a), and DALYs (b). The fold lines represent the change of the age-standardized rates (per 100,000 population) in different age groups. The shaded areas represent 95% uncertainty interval (UI) of the fold lines
Fig. 5
Fig. 5
The change of age-standardized prevalence rates of schistosomiasis (a), cystic echinococcosis (b), cysticercosis (c), and foodborne trematodiases (d) with the raising SDI across all GBD regions from 1990 to 2021. SDI: Socio-demographic Index. Expected values, based on SDI and disease rates in all locations, are shown as a solid line; expected values based on a calculation accounting for the SDI and disease rates across all locations. The points are plotted for each region and show the observed age-standardized prevalence rates for each year from 1990 to 2021. The curve is derived from Spearman correlation analysis, with the shaded area representing the 95% confidence interval (CI). The correlation coefficient and P values were displayed in the top left corner of the image
Fig. 6
Fig. 6
The change of age-standardized mortality rates of schistosomiasis (a), cystic echinococcosis (b), cysticercosis (c) with the raising SDI across all GBD regions from 1990 to 2021. SDI: Socio-demographic Index. Expected values, based on SDI and disease rates in all locations, are shown as a solid line; expected values based on a calculation accounting for the SDI and disease rates across all locations. The points are plotted for each region and show the observed age-standardized mortality rates for each year from 1990 to 2021.The curve is derived from Spearman correlation analysis, with the shaded area representing the 95% confidence interval (CI). The correlation coefficient and P values were displayed in the top left corner of the image
Fig. 7
Fig. 7
The change of age-standardized DALYs rates of schistosomiasis (a), cystic echinococcosis (b), cysticercosis (c), and foodborne trematodiases (d) with the raising SDI across all GBD regions from 1990 to 2021. SDI: Socio-demographic Index. DALYs: disability-adjusted life years. Expected values, based on SDI and disease rates in all locations, are shown as a solid line; expected values based on a calculation accounting for the SDI and disease rates across all locations. The points are plotted for each region and show the observed age-standardized DALYs rates for each year from 1990 to 2021. The curve is derived from Spearman correlation analysis, with the shaded area representing the 95% confidence interval (CI). The correlation coefficient and P values were displayed in the top left corner of the image

Similar articles

Cited by

References

    1. Department of Economic and Social Affairs, UN. The sustainable development goals report 2021. https://digitallibrary.un.org/record/3932350. Accessed 23 June 2024.
    1. Wafula ST, Habermann T, Franke MA, May J, Puradiredja DI, Lorenz E, et al. What are the pathways between poverty and malaria in sub-Saharan Africa? A systematic review of mediation studies. Infect Dis Poverty. 2023;12(1):58. - PMC - PubMed
    1. Patikorn C, Cho JY, Higashi J, Huang XX, Chaiyakunapruk N. Financial hardship among patients suffering from neglected tropical diseases: a systematic review and meta-analysis of global literature. PLoS Negl Trop Dis. 2024;18(5): e0012086. - PMC - PubMed
    1. Prüss-Ustün A, Wolf J, Bartram J, Clasen T, Cumming O, Freeman MC, et al. Burden of disease from inadequate water, sanitation and hygiene for selected adverse health outcomes: an updated analysis with a focus on low- and middle-income countries. Int J Hyg Environ Health. 2019;222(5):765–77. - PMC - PubMed
    1. Wolf J, Hunter PR, Freeman MC, Cumming O, Clasen T, Bartram J, et al. Impact of drinking water, sanitation and handwashing with soap on childhood diarrhoeal disease: updated meta-analysis and meta-regression. Trop Med Int Health. 2018;23(5):508–25. - PubMed

LinkOut - more resources