. 2024 Nov 6;57(1):79.
doi: 10.1186/s40659-024-00554-6.

The sodium/ascorbic acid co-transporter SVCT2 distributes in a striated membrane-enriched domain at the M-band level in slow-twitch skeletal muscle fibers

Affiliations

The sodium/ascorbic acid co-transporter SVCT2 distributes in a striated membrane-enriched domain at the M-band level in slow-twitch skeletal muscle fibers

Daniel Sandoval et al. Biol Res. .

Abstract

Background: Vitamin C plays key roles in cellular homeostasis, functioning as a potent antioxidant and a positive regulator of cell differentiation. In skeletal muscle, the vitamin C/sodium co-transporter SVCT2 is preferentially expressed in oxidative slow fibers. SVCT2 is up-regulated during the early fusion of primary myoblasts and decreases during initial myotube growth, indicating the relevance of vitamin C uptake via SVCT2 for early skeletal muscle differentiation and fiber-type definition. However, our understanding of SVCT2 expression and function in adult skeletal muscles is still limited.

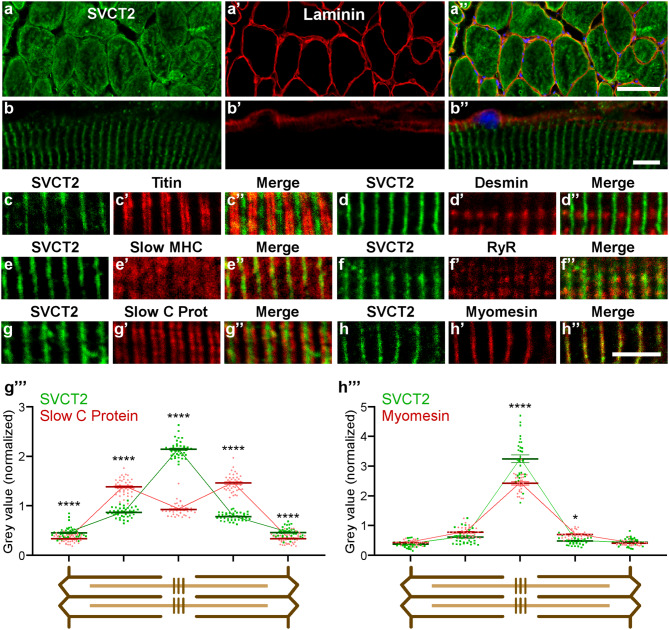
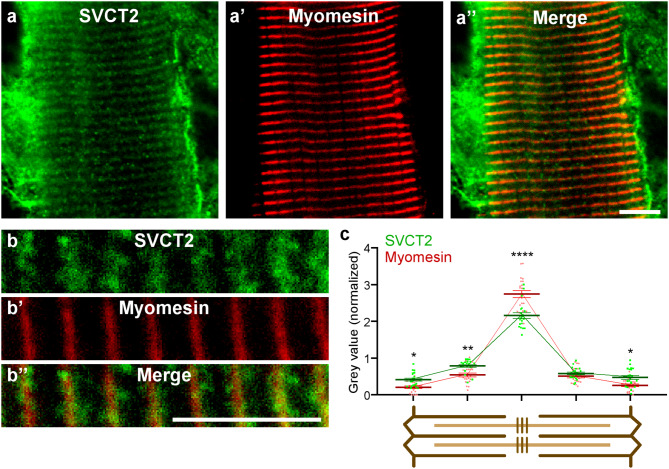
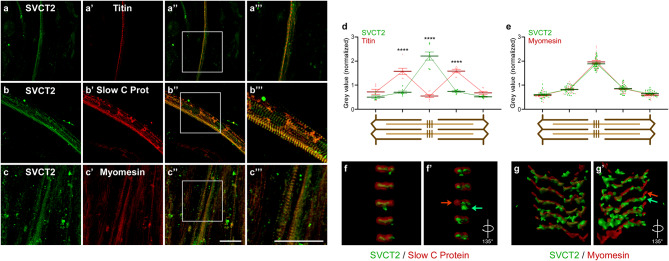
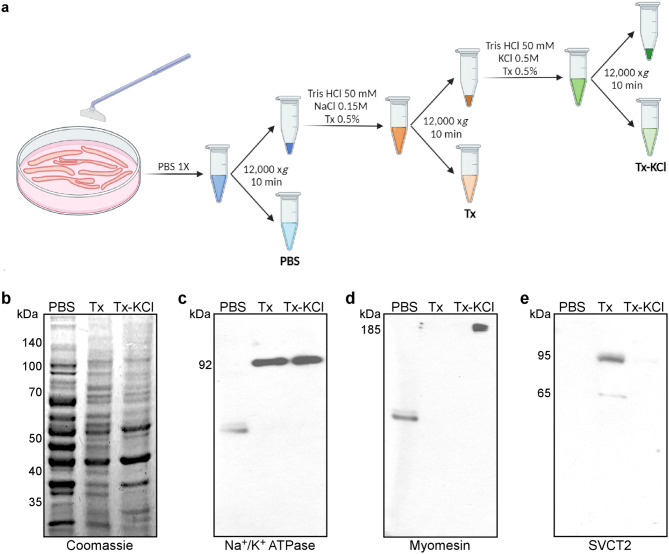
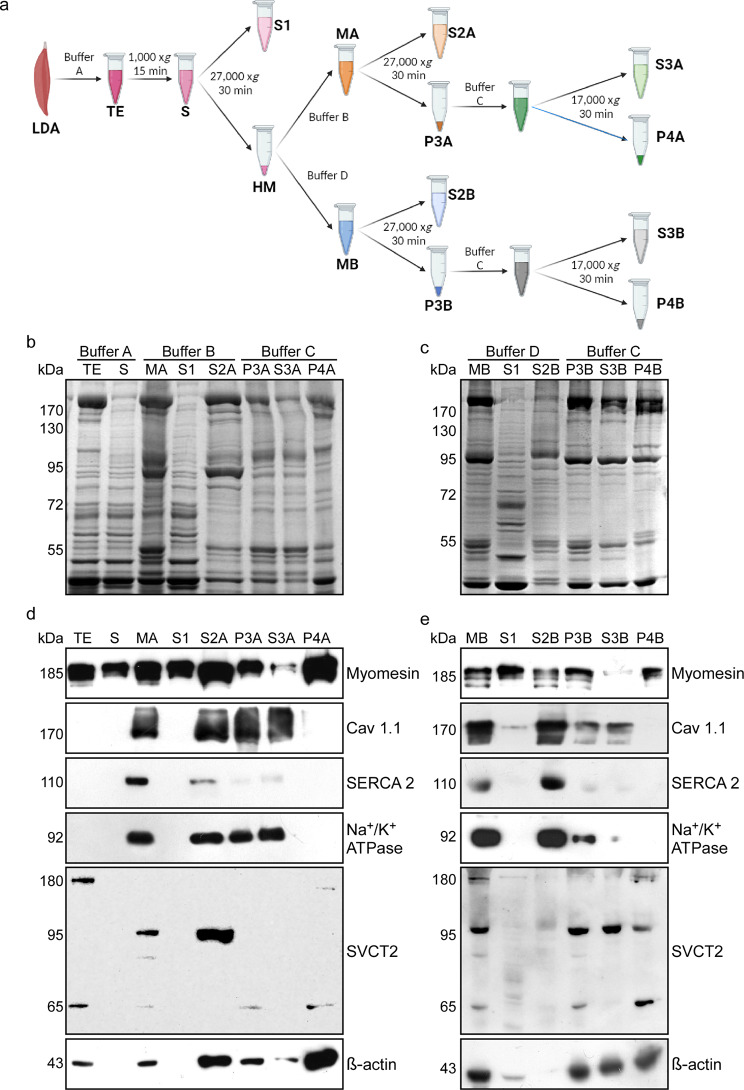
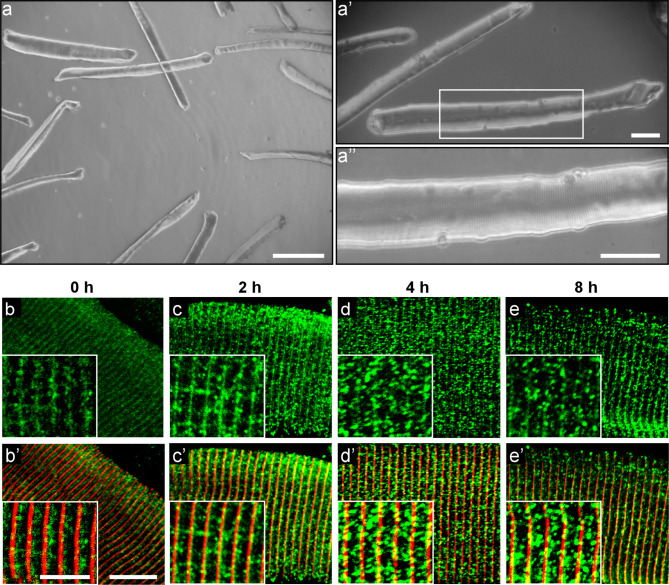
Results: In this study, we demonstrate that SVCT2 exhibits an intracellular distribution in chicken slow skeletal muscles, following a highly organized striated pattern. A similar distribution was observed in human muscle samples, chicken cultured myotubes, and isolated mouse myofibers. Immunohistochemical analyses, combined with biochemical cell fractionation experiments, reveal a strong co-localization of SVCT2 with intracellular detergent-soluble membrane fractions at the central sarcomeric M-band, where it co-solubilizes with sarcoplasmic reticulum proteins. Remarkably, electrical stimulation of cultured myofibers induces the redistribution of SVCT2 into a vesicular pattern.

Conclusions: Our results provide novel insights into the dynamic roles of SVCT2 in different intracellular compartments in response to functional demands.

Keywords: M-band; SVCT2; Sarcoplasmic reticulum; Skeletal muscle; Vitamin C.


Conflict of interest statement

The authors declare that they have no competing interests.

Figures

Fig. 1
Fig. 1
SVCT2 is distributed intracellularly in a transverse striated pattern in adult chicken muscle. Cross sections (a-a’’) and longitudinal sections (b-b’’) of 20 μm from adult chicken LDA muscles were stained using antibodies against SVCT2 (green) and laminin (red). Nuclei were counterstained with DAPI (blue). Representative images obtained by confocal microscopy show the intracellular SVCT2 distribution pattern. Scale bar = 50 μm. (c-h’’) Longitudinal cryosections of adult chicken LDA muscles were co-incubated with an anti-SVCT2 antibody (green) together with antibodies against titin (c-c’’), desmin (d-d’’), slow MHC (e-e’’), ryanodine receptor (RyR) (f-f’’), slow C protein (g-g’’), and myomesin (h-h’’) (in red) to investigate the intracellular distribution of SVCT2. Scale bar = 5 μm. (g’’’ and h’’’) Quantification of fluorescence intensities (expressed as gray values normalized to their mean intensity) throughout the sarcomeres (schemes below plots) evidence the differential distribution between SVCT2 and slow C protein (g’’’), as well as the close codistribution of SVCT2 and myomesin (h’’’) at the M-band level. Plots represent the mean ± SEM of > 30 sarcomeres (dots) from 3 different immunohistochemical staining. * p < 0.05; ****p < 0.0001, Anova
Fig. 2
Fig. 2
SVCT2 localizes to intracellular membrane domains in human oxidative skeletal muscle fibers. (a-a’’, b-b’’) Longitudinal cryosections of the human lumbar multifidus (transversospinal) muscle were co-incubated with primary antibodies against SVCT2 (green) and myomesin (red), as the representative confocal images are shown. Scale bar = 5 μm. (b’’’) Fluorescence signal for SVCT2 (green) and myomesin (red) were analyzed. Scale bar = 5 μm. (c) Quantification of fluorescence intensities throughout the sarcomeres (scheme below plot) evidence the close codistribution of SVCT2 and myomesin at the M-band level. Plots represent the mean ± SEM of > 15 sarcomeres (dots) from 3 different immunohistochemical staining. * p < 0.05; **p < 0.01; ****p < 0.0001, Anova
Fig. 3
Fig. 3
SVCT2 distributes in a striated intracellular pattern in primary cultures of chicken myotubes. (a-c’’’) Primary cultures of chicken myotubes were differentiated for 4 days and co-stained with anti-SVCT2 (green) along with antibodies against titin (a-a’’’), slow C protein (b-b’’’), or myomesin (c-c’’’). Magnified images from the squared regions show colocalization. Scale bar = 30 μm. (d-e) Quantification of fluorescence intensities throughout the sarcomeres (schemes below plots) evidence the differential distribution between SVCT2 and titin (d), as well as the close codistribution of SVCT2 and myomesin (e) at the M-band level. Plots represent the mean ± SEM of 7 (titin) and > 20 sarcomeres (myomesin; dots) from 3 different immunohistochemical staining. ****p < 0.0001, Anova. (f-g’) A z-stack of images obtained through confocal microscopy was processed to obtain the 3D representation of SVCT2 and slow C protein (f-f’) or SVCT2 and myomesin (g-g’) distribution. Straight (f, g) and rotated (f’, g’) images show that the distribution of SVCT2 at the M-band level occupies a different localization in the z plane than sarcomeric proteins
Fig. 4
Fig. 4
SVCT2 distributes in a membrane-enriched fraction in primary cultures of chicken myotubes. (a) Flow chart. Protein extracts enriched in cytosolic proteins (PBS), in membrane proteins (Tx), as well as in extracellular matrix and nuclear proteins (Tx-KCl) were obtained from chicken myotubes at day 4 of differentiation. (b) All steps of fractionation were separated by PAGE and stained with Coomassie Blue. (c-e) Western blots were performed using antibodies directed against Na+/K+ ATPase (d), myomesin (e), and SVCT2 (f) proteins
Fig. 5
Fig. 5
Subcellular ionic strength- and detergent-based fractionation reveals SVCT2 enrichment in a fraction containing SR proteins. (a) Flow chart. Protein extracts derived from adult chicken muscles were initially homogenized in buffer A (total extract, TE) and centrifuged. The resulting supernatant (S) underwent a subsequent centrifugation step, leading to the separation of a pellet containing heavy microsomes and a supernatant (S1). The heavy microsome fraction was further resuspended in either buffer B (MA lane) or buffer D (MB lane) followed by centrifugation, resulting in two distinct supernatants (S2A and S2B, respectively) and pellets that were separately resuspended in buffer C (P3A and P3B, respectively). Lastly, P3A and P3B were centrifuged, resulting in two supernatants (S3A and S3B) and two final pellets (P4A and P4B). (b, c) Representative electrophoretic migration of skeletal muscle protein fractions obtained through ionic strength and detergent treatment analyzed in 10% w/v acrylamide gel stained with Coomassie Blue. (d, e) Representative Western blot analyses using primary antibodies against myomesin, Cav1.1, SERCA2, Na+/K+ ATPase, SVCT2, and β-actin
Fig. 6
Fig. 6
SVCT2 alters its intracellular distribution in skeletal muscle fibers in response to electrical stimulation at 20 Hz. (a-a’’) Phase-contrast images of cultured skeletal muscle fibers isolated from the FDB muscle of adult mice and magnifications. Scale bar = 200 μm (a) and 50 μm (a’, a’’). (b-e’) Representative images of isolated fibers from adult mouse FDB muscles electrically stimulated with 270 pulses at low frequency of 20 Hz at 0 (b-b’), 2 (c-c’), 4 (d-d’), and 8 h (e-e’). The fibers were fixed and immunocytochemistry to SVCT2 (green) and myomesin (red) were performed. Scale bar = 10 μm and 5 μm (insets)

References

    1. Jackson MJ, Pye D, Palomero J. The production of reactive oxygen and nitrogen species by skeletal muscle. J Appl Physiol (1985). 2007;102(4):1664–70. - PubMed
    1. Moylan JS, Reid MB. Oxidative stress, chronic disease, and muscle wasting. Muscle Nerve. 2007;35(4):411–29. - PubMed
    1. Powers SK, Kavazis AN, DeRuisseau KC. Mechanisms of disuse muscle atrophy: role of oxidative stress. Am J Physiol Regul Integr Comp Physiol. 2005;288(2):R337–44. - PubMed
    1. Pellegrino MA, Desaphy JF, Brocca L, Pierno S, Camerino DC, Bottinelli R. Redox homeostasis, oxidative stress and disuse muscle atrophy. J Physiol. 2011;589(Pt 9):2147–60. - PMC - PubMed
    1. Powers SK, Duarte J, Kavazis AN, Talbert EE. Reactive oxygen species are signalling molecules for skeletal muscle adaptation. Exp Physiol. 2010;95(1):1–9. - PMC - PubMed

Substances

LinkOut - more resources