Multicenter Study
. 2025 May 1;110(5):1126-1140.
doi: 10.3324/haematol.2024.285805. Epub 2024 Nov 7.

Outcomes with intensive treatment for acute myeloid leukemia: an analysis of two decades of data from the HARMONY Alliance

Affiliations
Multicenter Study

Outcomes with intensive treatment for acute myeloid leukemia: an analysis of two decades of data from the HARMONY Alliance

Marta Anna Sobas et al. Haematologica. .

Abstract

Since 2017, targeted therapies combined with conventional intensive chemotherapy have started to improve outcomes of patients with acute myeloid leukemia (AML). However, even before these innovations, outcomes with intensive chemotherapy had improved, which has not yet been extensively studied. Thus, we used a large pan-European multicenter dataset of the HARMONY Alliance to evaluate treatment-time dependent outcomes over two decades. In 5,359 AML patients, we compared the impact of intensive induction therapy on outcome over four consecutive 5-year calendar periods from 1997 to 2016. During that time, the 5-year survival of AML patients improved significantly, also across different genetic risk groups. In particular, the 60-day mortality rate dropped from 13.0% to 4.7% over time. The independent effect of calendar periods on outcome was confirmed in multivariate models. Improvements were documented both for patients <60 and ≥60 years old, and in those treated with and without consolidating allogeneic hematopoietic stem cell transplantation (alloHCT). While survival of AML elderly patients remains poor, patients ≥60 years old overall have a 20% survival benefit at 5 years if they receive an alloHCT. While further outcome improvement in intensively treated AML patients will likely be driven by targeted treatment approaches, this pan-European HARMONY dataset can serve as a multicenter comparator for future studies.


Figures

Figure 1.
Figure 1.
Homogeneous distribution of European LeukemiaNet 2017 categories and stable proportions of molecular abnormalities over calendar periods. (A) Pie charts showing the proportions of patients in each calendar period according to ELN 2017 classification: favorable (green), intermediate (blue) and adverse (red) risk categories. Absolute patient numbers are shown. (B) Comparative illustration of the main molecular abnormalities across the same four calendar periods. Absolute numbers of detected genes are represented by blue bars. Gray bars indicate missing sample information on the presence or absence of the mutation. Genes are shown in decreasing order, starting with the most frequently detected gene at the top.
Figure 2.
Figure 2.
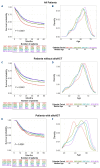
Overall survival of intensively treated acute myeloid leukemia patients over calendar periods. (A) Comparison of 5-year overall survival (OS) of all patients (N=5,359) with acute myeloid leukemia (AML) stratified per calendar periods. Kaplan-Meier OS curve, strata compared using the log-rank test. (B) Comparison of density plots of age distributions under a smoothed curve and medians at diagnosis over calendar periods. The age distribution of AML patients remains stable over the calendar periods. (C) Comparison of 5-year OS of intensively treated AML patients who did not subsequently undergo allogeneic hematopoietic stem cell transplantation (alloHCT) in first complete remission (N=2,589) stratified per calendar period. Kaplan-Meier OS curve, strata compared using the log-rank test. (D) Comparison of density plots of age distributions under a smoothed curve and medians at diagnosis over calendar periods. (E) Comparison of 5-year OS of AML patients with consolidating alloHCT (N=1,770) stratified per calendar period. Kaplan-Meier OS curve, strata compared using the log-rank test. (F) Age distribution of AML patients with alloHCT shifts over observation periods towards higher age. Comparison of density plots of age distributions under a smoothed curve and medians at diagnosis over calendar periods. Calendar periods are indicated under each figure: 1997-2001 red, 2002-2006 light green, 2007-2011 blue, 2012-2016 violet.
Figure 3.
Figure 3.
Relapse-free survival after first complete remission of intensively treated acute myeloid leukemia patients over calendar periods. (A) Comparison of 5-year relapse-free survival (RFS) of patients with acute myeloid leukemia (AML) in first complete remission (CR1) (N=3,377) stratified per calendar period. Kaplan-Meier curve, strata compared using the log-rank test. (B) Comparison of 5-year cumulative incidence of relapse of AML patients from achievement of CR1. (C) Comparison of 5-year RFS of AML patients in CR1 without alloHCT (N=1,808 ) stratified per calendar period. Kaplan-Meier curve, comparison of strata with log-rank test. (D) Comparison of 5-year cumulative incidence of relapse of CR1 AML patients who did not undergo allogeneic hematopoietic cell transplantation (alloHCT) over calendar periods. (E) Comparison of 5-year RFS of intensively treated CR1 AML patients who subsequently underwent alloHCT (N=1,569) stratified per calendar group. Kaplan-Meier curve, strata compared using the log-rank test. (F) Comparison of 5-year cumulative incidence of relapse of CR1 AML patients treated with alloHCT. Calendar periods are indicated under each figure: 1997-2001 red, 2002-2006 light green, 2007-2011 blue, 2012-2016 violet.
Figure 4.
Figure 4.
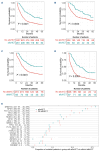
Changes in overall survival stratified according to European LeukemiaNet 2017 risk groups and use of consolidating allogeneic hematopoietic cell transplantation. The improvement in overall survival (OS) is dependent on European LeukemiaNet (ELN) risk group and the use of consolidating allogeneic hematopoietic cell transplantation (alloHCT). (A, B) Kaplan-Meier OS curves of ELN 2017 favorable-risk patients comparing those who did not receive alloHCT (A) and those who did receive alloHCT (B) stratified according to calendar periods derived from the time-point of initial diagnosis as in Figure 2. (C, D) OS of ELN 2017 intermediate-risk patients who did not undergo alloHCT (C) compared to those who did receive alloHCT (D). (E, F) OS of ELN 2017 adverse-risk patients who did not undergo alloHCT (E) and those who did (F). Strata are compared with the log-rank test. Calendar periods are indicated under each figure: 1997-2001 red, 2002-2006 light green, 20072011 blue, 2012-2016 violet.
Figure 5.
Figure 5.
Multivariate analysis confirms a significant independent impact of calendar periods on outcome of intensively treated acute myeloid leukemia patients. Multivariate Cox regression analysis including the covariates age, sex, four treatment periods (1997-2001, 2002-2006, 2007-2011 and 2012-2016), three European LeukemiaNet (ELN) 2017 risk groups (favorable, intermediate, adverse), bone marrow (BM) myeloid blast count at acute myeloid leukemia (AML) diagnosis and logarithmic (log)white blood cell count (WBC) at AML diagnosis. Age is measured as a continuous risk factor, its hazard corresponds to a 1-year increase. The BM blast count and logWBC are also considered as continuous variables; all other variables are treated as categorical variables. ***P<0.001.
Figure 6.
Figure 6.
Comparison of overall survival and genetic features of intensively treated acute myeloid leukemia patients aged ≥60 years according to performance of allogeneic hematopoietic cell transplantation. (A-D) Comparison of intensively treated acute myeloid leukemia patients ≥60 years old receiving allogeneic hematopoietic cell transplantation (alloHCT) (blue line) versus no alloHCT (red line). Kaplan-Meier overall survival curves. The landmark for analysis was set after the median time from diagnosis to alloHCT (143 days): patients in both groups who were censored or dead before the landmark were not considered for analysis. The curves were compared with the log-rank test. (A) All patients ≥60 years old. (B) European LeukemiaNet (ELN) favorable-risk patients ≥60 years old. (C) ELN intermediate-risk patients ≥60 years old. (D) ELN adverse-risk patients ≥60 years old. (E) Genomic landscape of acute myeloid leukemia patients ≥60 years old. Comparison of the proportions of the most frequent gene mutations between patients ≥60 years who did or did not receive alloHCT. Absolute numbers and percentages are shown.

References

    1. Yates JW, Wallace HJ, Ellison RR, Holland JF. Cytosine arabinoside (NSC-63878) and daunorubicin (NSC-83142) therapy in acute nonlymphocytic leukemia. Cancer Chemother Rep. 1973;57(4):485-488. - PubMed
    1. Mayer RJ, Davis RB, Schiffer CA, et al. . Intensive postremission chemotherapy in adults with acute myeloid leukemia. Cancer and Leukemia Group B. N Engl J Med. 1994;331(14):896-903. - PubMed
    1. Koreth J, Schlenk R, Kopecky KJ, et al. . Allogeneic stem cell transplantation for acute myeloid leukemia in first complete remission: systematic review and meta-analysis of prospective clinical trials. JAMA. 2009;301(22):2349-2361. - PMC - PubMed
    1. Cornelissen JJ, Gratwohl A, Schlenk RF, et al. . The European LeukemiaNet AML Working Party consensus statement on allogeneic HSCT for patients with AML in remission: an integrated-risk adapted approach. Nat Rev Clin Oncol. 2012;9(10):579-590. - PubMed
    1. Döhner H, Estey EH, Amadori S, et al. . Diagnosis and management of acute myeloid leukemia in adults: recommendations from an international expert panel, on behalf of the European LeukemiaNet. Blood. 2010;115(3):453-474. - PubMed

Publication types

LinkOut - more resources