. 2024 Oct 11;27(11):111134.
doi: 10.1016/j.isci.2024.111134. eCollection 2024 Nov 15.

A multiorgan map of metabolic, signaling, and inflammatory pathways that coordinately control fasting glycemia in mice

Affiliations

A multiorgan map of metabolic, signaling, and inflammatory pathways that coordinately control fasting glycemia in mice

Florence Mehl et al. iScience. .

Abstract

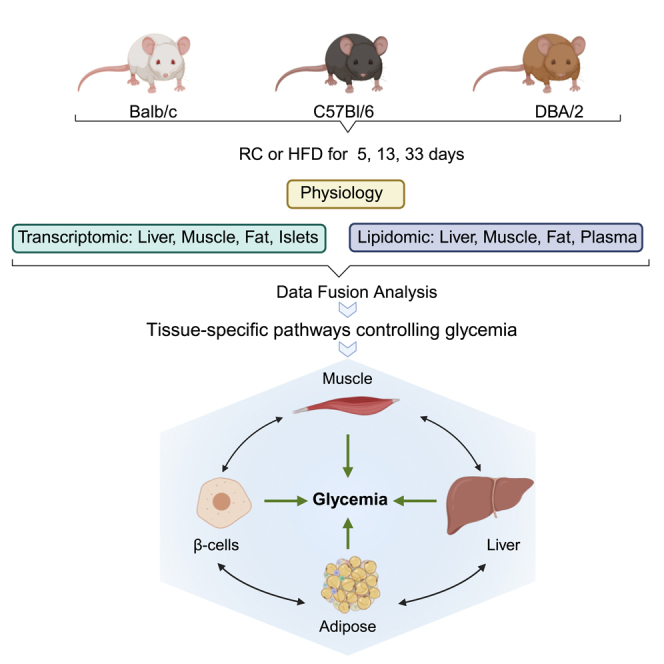
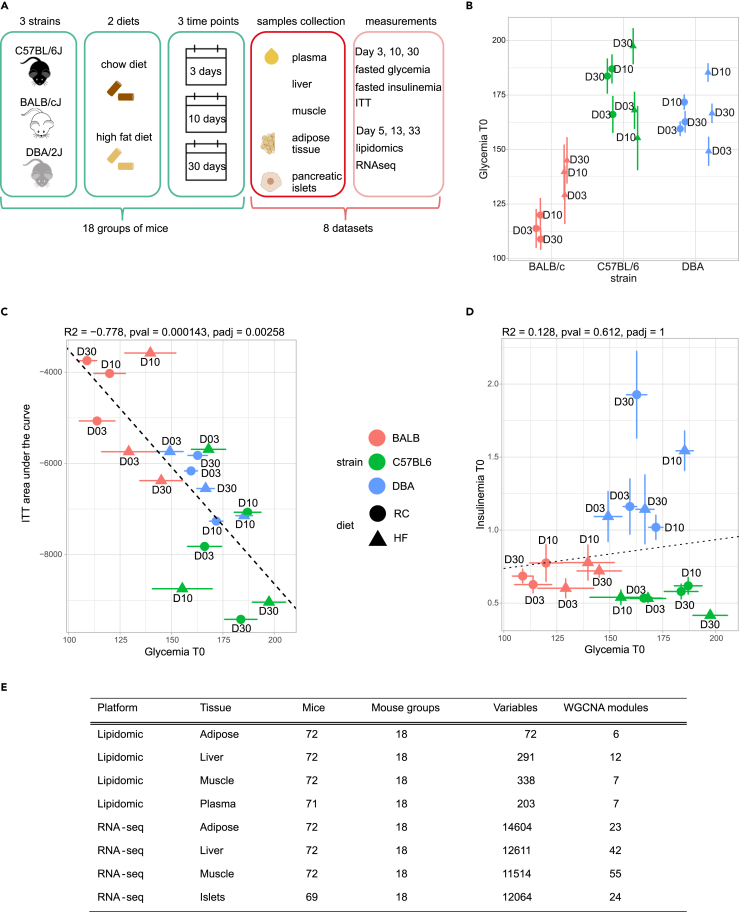
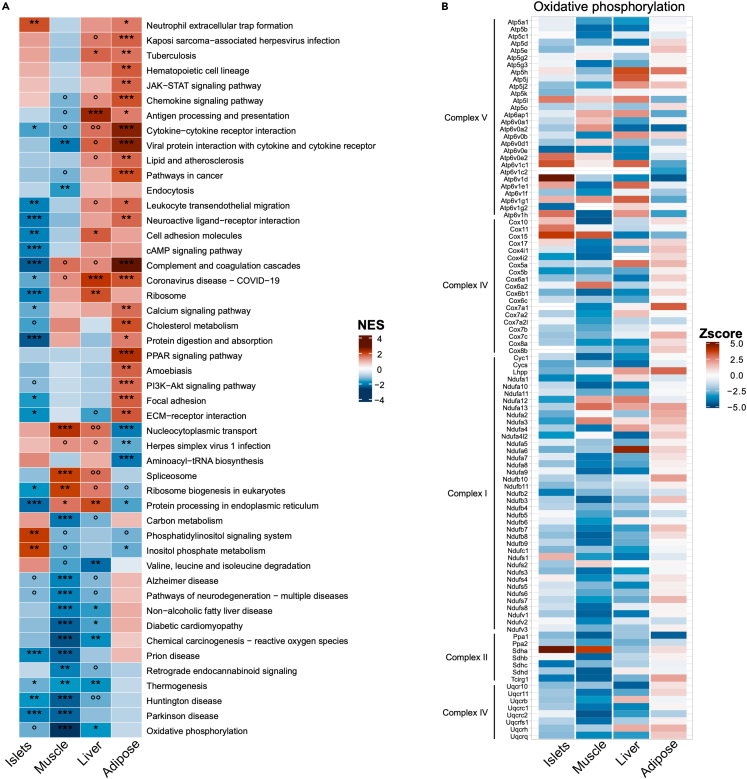
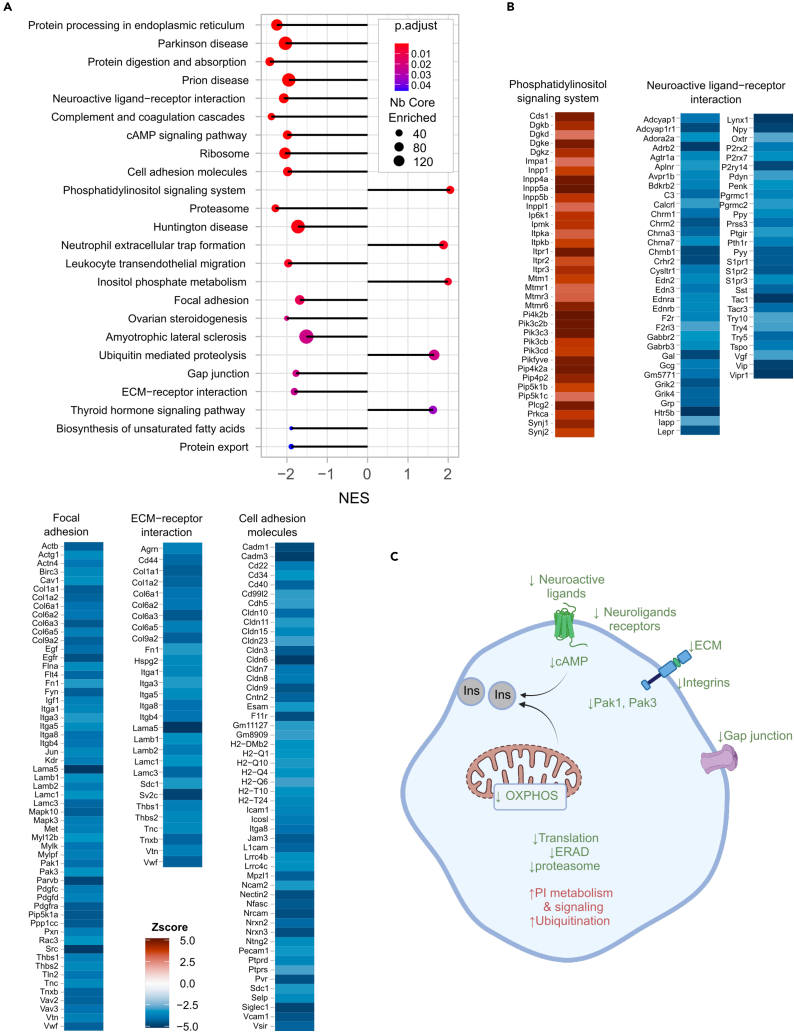
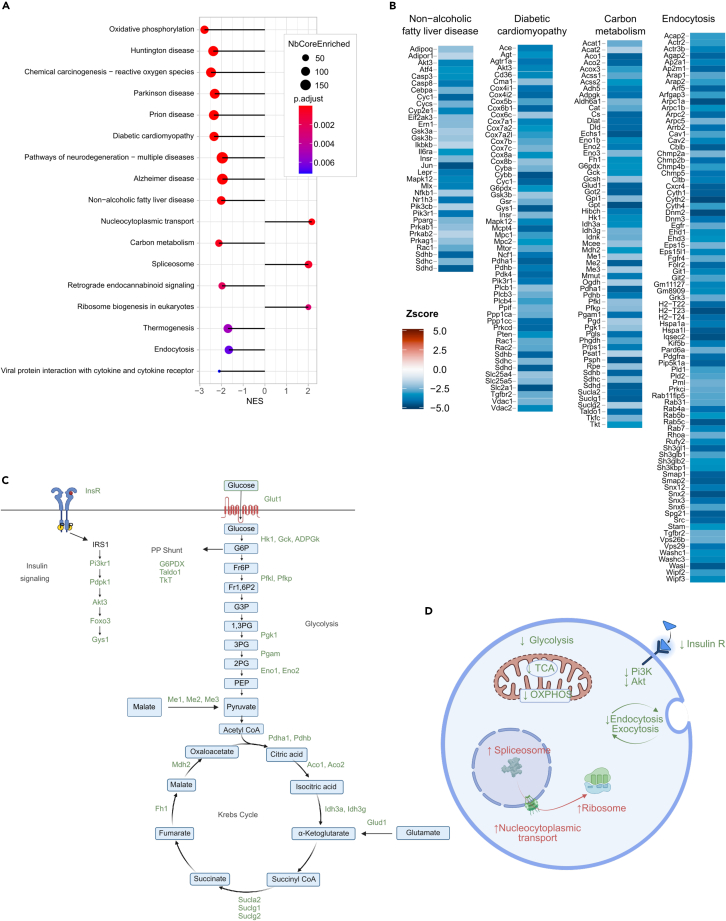
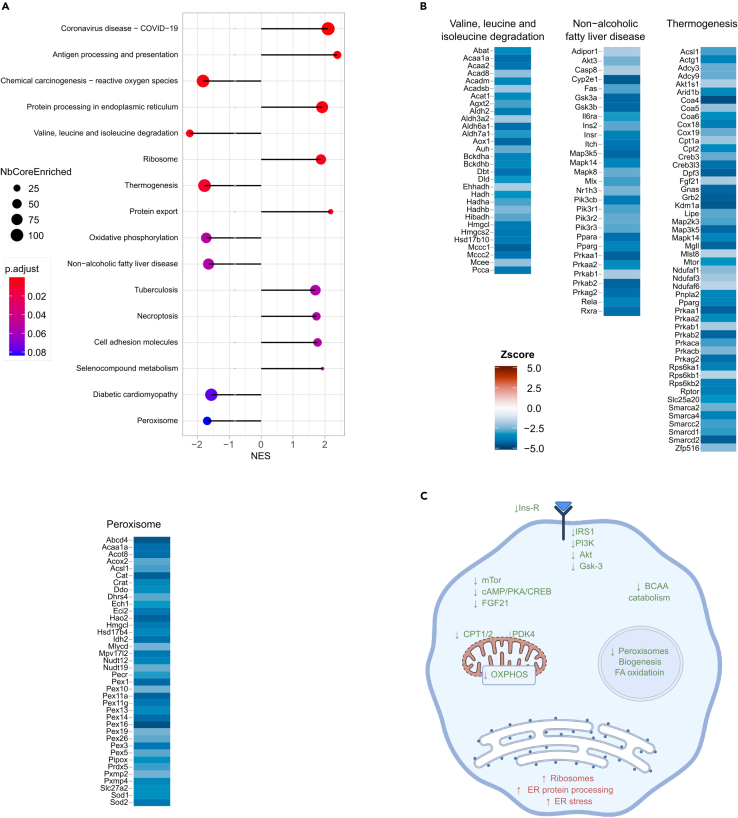
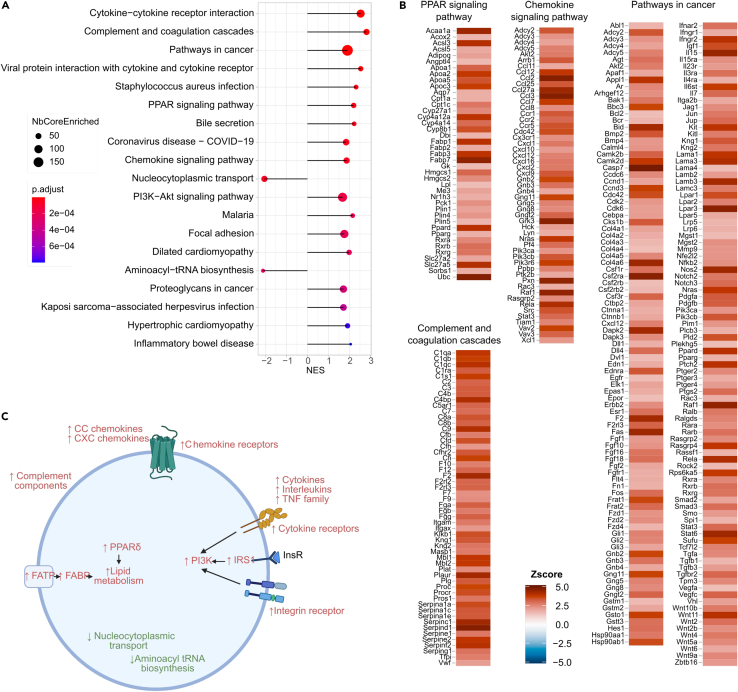
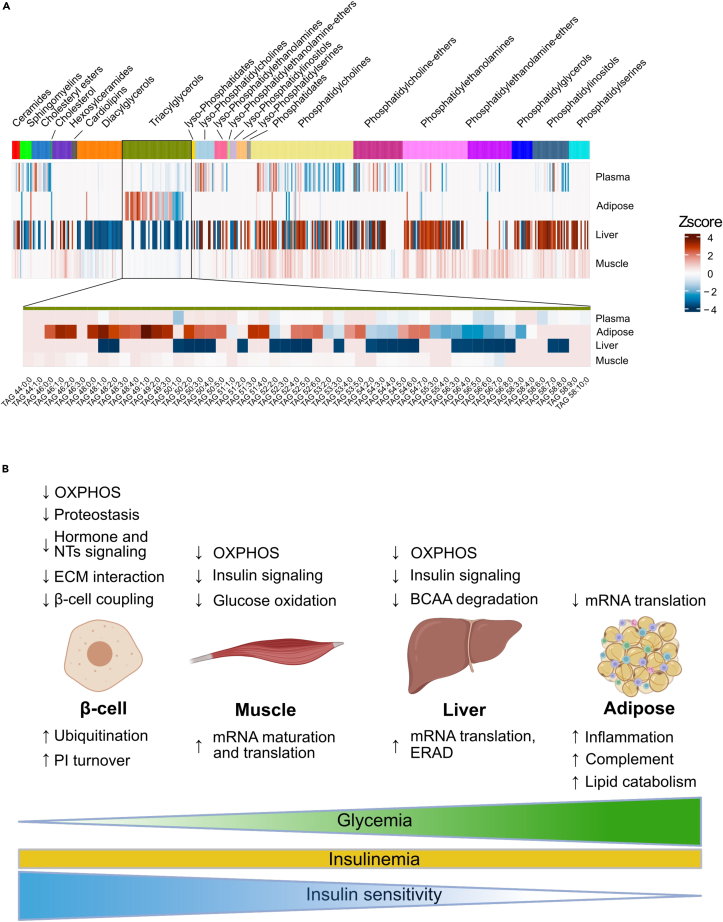
To identify the pathways that are coordinately regulated in pancreatic β cells, muscle, liver, and fat to control fasting glycemia we fed C57Bl/6, DBA/2, and Balb/c mice a regular chow or a high fat diet for 5, 13, and 33 days. Physiological, transcriptomic and lipidomic data were used in a data fusion approach to identify organ-specific pathways linked to fasting glycemia across all conditions investigated. In pancreatic islets, constant insulinemia despite higher glycemic levels was associated with reduced expression of hormone and neurotransmitter receptors, OXPHOS, cadherins, integrins, and gap junction mRNAs. Higher glycemia and insulin resistance were associated, in muscle, with decreased insulin signaling, glycolytic, Krebs' cycle, OXPHOS, and endo/exocytosis mRNAs; in hepatocytes, with reduced insulin signaling, branched chain amino acid catabolism and OXPHOS mRNAs; in adipose tissue, with increased innate immunity and lipid catabolism mRNAs. These data provide a resource for further studies of interorgan communication in glucose homeostasis.

Keywords: Bioinformatics; Omics; Physiology; Transcriptomics.


Conflict of interest statement

M.G., C.K., and K.S. are employees of Lipotype GmbH.

Figures

None
Graphical abstract
Figure 1
Figure 1
Experimental design, mouse physiology and multi-omics analysis (A) Scheme of the experimental design. (B) Five-hour fasted glycemia in Balb/c, C57Bl/6 and DBA/2 mice fed an RC or HFD. Each data point represents the mean ± SEM (n = 10–12 mice) glycemic level of the mice at 3, 10, and 30 days of diet feeding. Circles: RC fed mice; triangles: HFD fed mice. (C) Correlation between 5-h fasted glycemia and the area under baseline of an insulin tolerance test. Each data point represents the mean ± SEM (n = 10–12 mice) for each time point, strain and feeding condition. (D) Correlation between basal insulinemia and basal glycemia indicating no significant correlation. Each data point represents the mean ± SEM (n = 10–12 mice) for each time point, strain and feeding condition. (E) Summary table of the number of mice, mouse groups, variables, and WGCNA modules for each each omics platform used and tissue analyzed.
Figure 2
Figure 2
Heatmap of KEGG terms regulated in each tissue (A) Heatmap of normalized enrichment scores (NES) of 48 KEGG pathways across the four tissues. Pathways were selected if significantly enriched (adjusted p value ≤0.01) in at least one tissue. ∗ adjusted p value <0.05, ∗∗ adjusted p value <0.01, ∗∗∗ adjusted p value <0.001, ° p value <0.05, °° p value <0.01, °°° p value <0.001, no symbol p value >0.05. (B) Heatmap of the expression (Z-scores) of the OXPHOS mRNAs comprising the Oxidative phosphorylation KEGG term across the four investigated tissues.
Figure 3
Figure 3
Pathways regulated with glycemia in pancreatic islets (A) Plot showing the major KEGG pathways regulated with glycemia in pancreatic islets. The negative and positive NES values indicate, respectively, down- or up-expression of the indicated terms with glycemia. The colors indicate the p values of the enrichment score, and the size of the dots, the number of genes in each term. (B) Illustration of the mRNAs that comprise selected KEGG terms with the color indication of their Z score value. (C) Scheme of the major pathways down- (green) and up- (red) regulated with glycemia and that are involved in the control of β cell function.
Figure 4
Figure 4
Pathways regulated with glycemia in soleus muscle (A) Plot showing the major KEGG pathways regulated with glycemia in muscle. (B) Illustration of the mRNAs that comprise selected KEGG terms with the color indication of their Z score value. (C) Scheme of the insulin signaling pathway, and of the glycolytic, pentose phosphate, and Krebs’ cycle pathways with, in green, the mRNAs whose expression is downregulated with glycemia. (D) Scheme of the major down and upregulated pathways that are involved in the control of muscle function.
Figure 5
Figure 5
Pathways regulated with glycemia in liver (A) Plot showing the major KEGG pathways regulated with glycemia in liver. (B) Illustration of the mRNAs that comprise selected KEGG terms with the color indication of their Z score value. (C) Scheme of the major pathways down and upregulated with glycemia and that are involved in the control liver function.
Figure 6
Figure 6
Pathways regulated with glycemia in visceral adipose tissue (A) Plot showing the major KEGG pathways regulated with glycemia in visceral adipose tissue. (B) Illustration of the mRNAs that comprise selected KEGG terms with the color indication of their Z score value. (C) Scheme of the major pathways down and upregulated with glycemia and that are involved in the control of adipose tissue function and inflammation.
Figure 7
Figure 7
Lipidomic data and summary scheme (A) Top: heatmap of the lipid species that are up or downregulated with glycemia in the indicated tissues. Bottom: heatmap displaying the structure of the individual TAGs in each organ. Relative abundance is expressed as Z-scores. (B) Summary of the tissue-specific changes in signaling and metabolic pathways that are coordinately regulated with fasting glycemia (for discussion see text).

References

    1. Merrins M.J., Corkey B.E., Kibbey R.G., Prentki M. Metabolic cycles and signals for insulin secretion. Cell Metabol. 2022;34:947–968. doi: 10.1016/j.cmet.2022.06.003. - DOI - PMC - PubMed
    1. Mayendraraj A., Rosenkilde M.M., Gasbjerg L.S. GLP-1 and GIP receptor signaling in beta cells - A review of receptor interactions and co-stimulation. Peptides. 2022;151 doi: 10.1016/j.peptides.2022.170749. - DOI - PubMed
    1. Ahrén B. Autonomic regulation of islet hormone secretion--implications for health and disease. Diabetologia. 2000;43:393–410. doi: 10.1007/s001250051322. - DOI - PubMed
    1. Langlois A., Dumond A., Vion J., Pinget M., Bouzakri K. Crosstalk Communications Between Islets Cells and Insulin Target Tissue: The Hidden Face of Iceberg. Front. Endocrinol. 2022;13 doi: 10.3389/fendo.2022.836344. - DOI - PMC - PubMed
    1. Gerst F., Wagner R., Oquendo M.B., Siegel-Axel D., Fritsche A., Heni M., Staiger H., Häring H.U., Ullrich S. What role do fat cells play in pancreatic tissue? Mol. Metab. 2019;25:1–10. doi: 10.1016/j.molmet.2019.05.001. - DOI - PMC - PubMed

LinkOut - more resources