. 2024 Oct 23:11:1481363.
doi: 10.3389/fnut.2024.1481363. eCollection 2024.

Plant-based diet and risk of all-cause mortality: a systematic review and meta-analysis

Affiliations

Plant-based diet and risk of all-cause mortality: a systematic review and meta-analysis

Junwen Tan et al. Front Nutr. .

Abstract

Objective: A systematic analysis was conducted to determine the relationship between a plant-based diet and all-cause mortality.

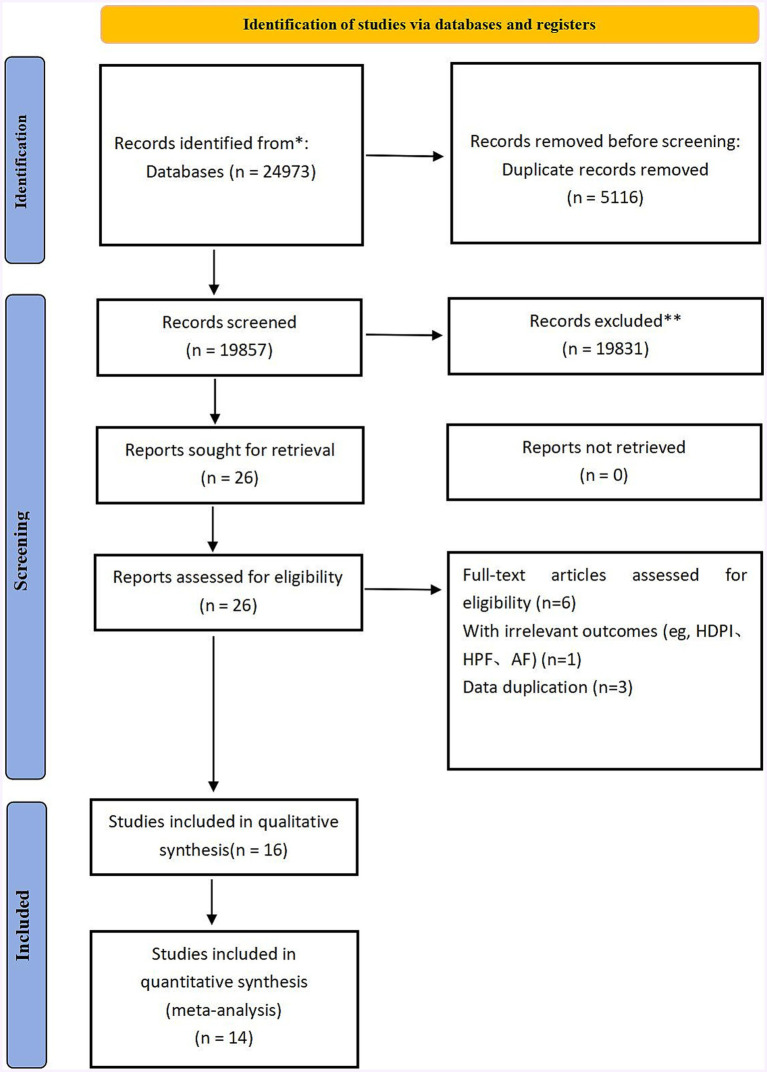
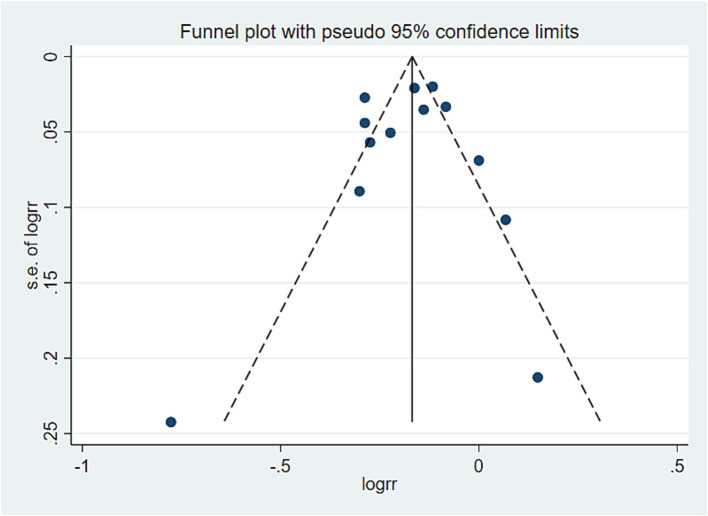
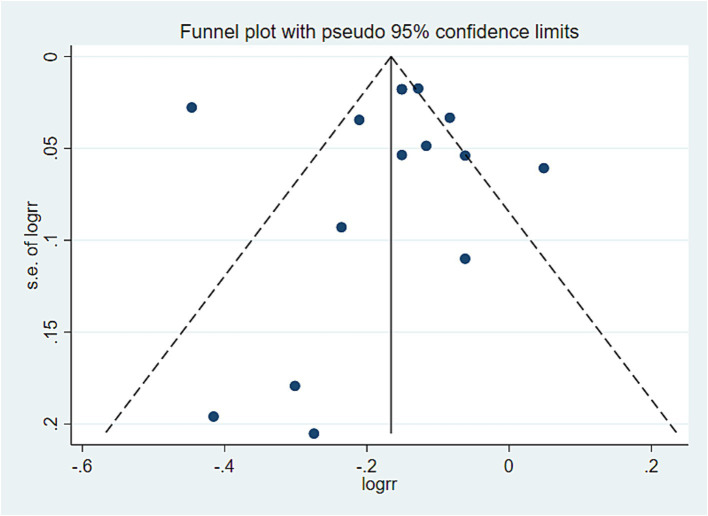
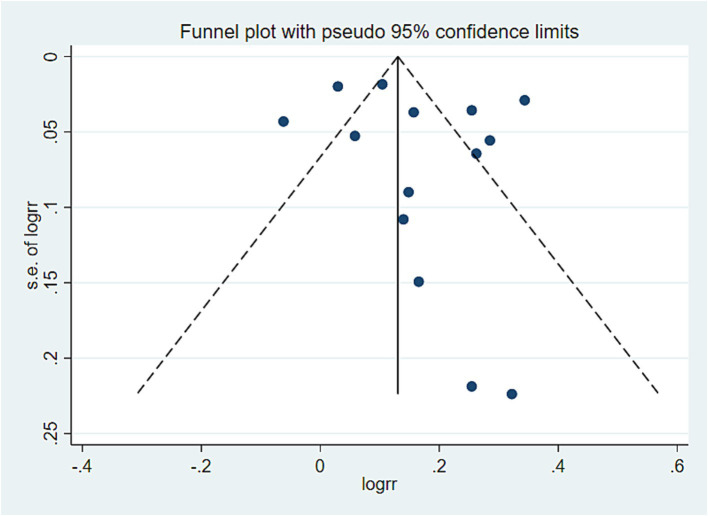
Methods: The PubMed, Embase and Web of Science databases were searched. Two authors selected English documents from the database. Then the other two authors extracted the data and evaluated the Newcastle-Ottawa Scale (NOS). This study adhered to the guidelines of the Preferred Reporting Project (PRISMA) and the PROSPERO Registry protocols. A mixed-effects model combined maximum adjusted estimates, with heterogeneity measured using the I2 statistic. The sensitivity analysis validated the analysis's robustness, while publication bias was assessed.

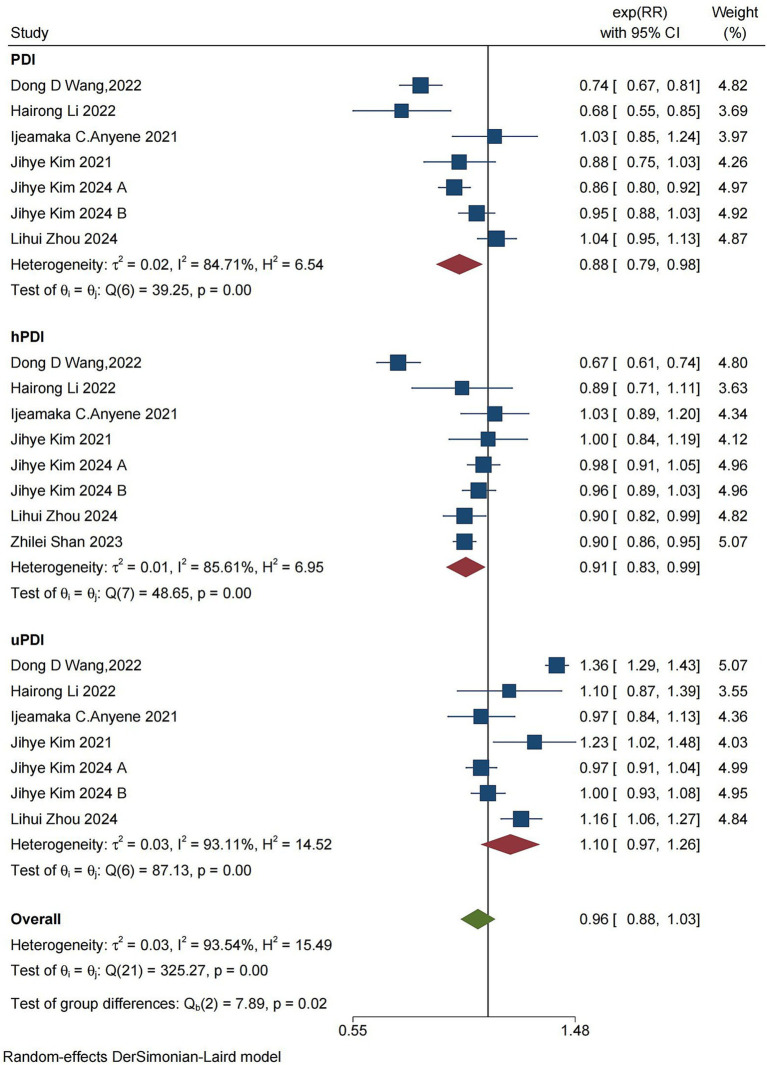
Results: The results of the meta-analysis of 14 articles revealed that a plant-based diet (PDI) can reduce cancer mortality (RR = 0.88, [95% CI 0.79-0.98], τ2: 0.02, I2: 84.71%), cardiovascular disease (CVD) mortality (RR = 0.81, [95% CI 0.76-0.86], τ2: 0.00, I2: 49.25%) and mortality (RR = 0.84, [95% CI 0.79-0.89], τ2: 0.01, I2: 81.99%) risk. Adherence to a healthy plant-based diet (hPDI) was negatively correlated with cancer mortality (RR = 0.91, [95% CI 0.83-0.99], τ2:0.01, I2:85.61%), CVD mortality (RR = 0.85, [95% CI 0.77-0.94], τ2: 0.02, I2: 85.13%) and mortality (RR = 0.85, [95% CI 0.80-0.90], τ2: 0.01, I2: 89.83%). An unhealthy plant-based diet (uPDI) was positively correlated with CVD mortality (RR = 1.19, [95% CI 1.07-1.32], τ2: 0.02, I2: 80.03%) and mortality (RR = 1.18, [95% CI 1.09-1.27], τ2: 0.01, I2: 89.97%) and had a certain correlation with cancer mortality (RR = 1.10, [95% CI 0.97-1.26], τ2: 0.03, I2: 93.11%). Sensitivity analysis showed no contradictory results.

Conclusion: The hPDI was negatively associated with all-cause mortality, and the uPDI was positively associated with all-cause mortality.

Systematic review registration: https://www.crd.york.ac.uk/PROSPERO/#loginpage.

Keywords: CVD mortality; all-cause mortality; cancer mortality; meta-analysis; plant-based diet.


Conflict of interest statement

The authors declare that the research was conducted in the absence of any commercial or financial relationships that could be construed as a potential conflict of interest.

Figures

Figure 1
Figure 1
Figure shows the flow chart. It mainly reflects the process of literature retrieval and exclusion.
Figure 2
Figure 2
Forest plot of the summary analysis of cancer mortality rates and PDI, hPDI, and uPDI data. The forest plot displays the meta-analysis of cancer and PDI, hPDI, and uPDI. RR, relative risk; CI, confidence interval. The area of each square is inversely proportional to the variance of the estimated log RR (i.e., weight percentage), whereas the horizontal line represents the 95% CI for each individual study. The vertical axis of the red diamond represents the point estimate of the overall RR, with the horizontal axis representing the 95% CI. The vertical solid line indicates RR = 1.
Figure 3
Figure 3
Forest plot of cardiovascular mortality and PDI, hPDI, and uPDI data classification and summary analysis. The forest plot displays the meta-analysis of cardiovascular disease and PDI, hPDI, and uPDI. RR, relative risk; CI, confidence interval. The area of each square is proportional to the inverse of the variance of the estimated log RR (i.e., weight percentage), whereas the horizontal line represents the 95% CI for each individual study. The vertical solid line indicates RR = 1. The red diamond on the y-axis represents the point estimate of the overall RR, with the x-axis representing the 95% CI.
Figure 4
Figure 4
Forest plot for the meta-analysis of overall mortality and PDI, hPDI, and uPDI. The forest plot displays the meta-analysis of overall mortality and PDI, hPDI, and uPDI. RR, relative risk; CI, confidence interval. The area of each square is proportional to the reciprocal of the variance of the estimated log RR (i.e., weight percentage), whereas the horizontal line represents the 95% CI for each individual study. The vertical solid line indicates RR = 1. The red diamond on the y-axis represents the point estimate of the overall RR, with the x-axis representing the 95% CI.
Figure 5
Figure 5
PDI and all-cause mortality offset analysis data. Visual observation was used to identify the presence of publication bias. If the funnel plot shows that the majority of studies are located at the top of the “funnel” with fewer at the base and that there is approximate symmetry on both sides, it suggests that publication bias is not significant. Conversely, if there is an obvious asymmetry, it indicates a clear publication bias.
Figure 6
Figure 6
hPDI and all-cause mortality offset analysis data. Visual observation was used to identify the presence of publication bias. If the funnel plot shows that the majority of studies are located at the top of the “funnel” with fewer at the base and that there is approximate symmetry on both sides, it suggests that publication bias is not significant. Conversely, if there is an obvious asymmetry, it indicates a clear publication bias.
Figure 7
Figure 7
All-cause mortality offset analysis data. Visual observation was used to identify the presence of publication bias. If the funnel plot shows that the majority of studies are located at the top of the “funnel” with fewer at the base and that there is approximate symmetry on both sides, it suggests that publication bias is not significant. Conversely, if there is an obvious asymmetry, it indicates a clear publication bias.

Comment in

References

    1. Shan Z, Wang F, Li Y, Baden MY, Bhupathiraju SN, Wang DD, et al. Healthy eating patterns and risk of Total and cause-specific mortality[J]. JAMA Intern Med. (2023) 183:142–53. doi: 10.1001/jamainternmed.2022.6117, PMID: - DOI - PMC - PubMed
    1. GBD 2019 Diseases and Injuries Collaborators . Global burden of 369 diseases and injuries in 204 countries and territories, 1990-2019: a systematic analysis for the global burden of disease study 2019[J]. Lancet. (2020) 396:1204–22. doi: 10.1016/S0140-6736(20)30925-9, PMID: - DOI - PMC - PubMed
    1. Morze J, Danielewicz A, Hoffmann G, Schwingshackl L. Diet quality as assessed by the healthy eating index, alternate healthy eating index, dietary approaches to stop hypertension score, and health outcomes: a second update of a systematic review and Meta-analysis of cohort studies[J]. J Acad Nutr Diet. (2020) 120:1998–2031.e15. doi: 10.1016/j.jand.2020.08.076, PMID: - DOI - PubMed
    1. Yu E, Malik VS, Hu FB. Cardiovascular disease prevention by diet modification: JACC health promotion series[J]. J Am Coll Cardiol. (2018) 72:914–26. doi: 10.1016/j.jacc.2018.02.085, PMID: - DOI - PMC - PubMed
    1. Satija A, Hu FB. Plant-based diets and cardiovascular health[J]. Trends Cardiovasc Med. (2018) 28:437–41. doi: 10.1016/j.tcm.2018.02.004, PMID: - DOI - PMC - PubMed

Publication types

LinkOut - more resources