. 2024 Nov 6;11(11):240027.
doi: 10.1098/rsos.240027. eCollection 2024 Nov.

Information consumption and firm size

Affiliations

Information consumption and firm size

Edward D Lee et al. R Soc Open Sci. .

Abstract

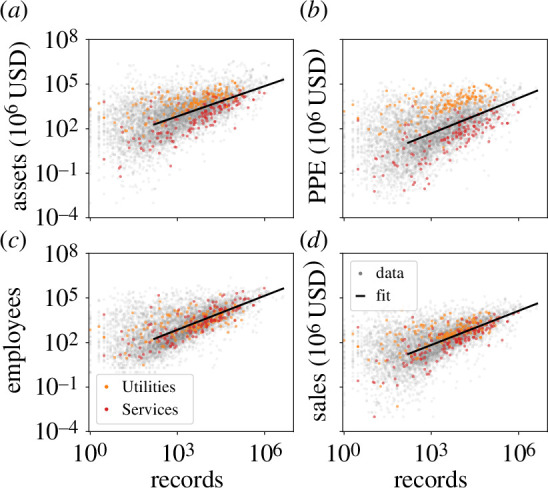
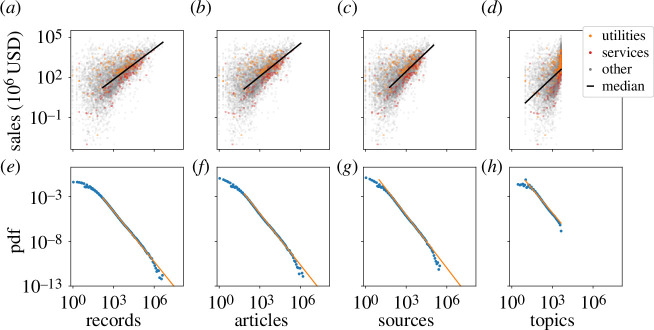
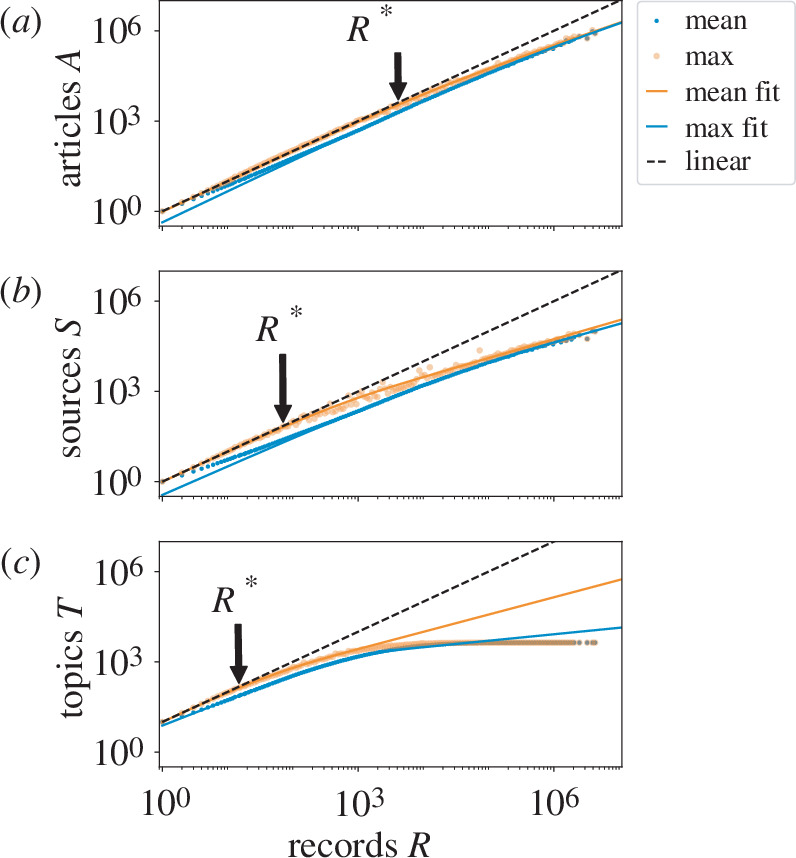
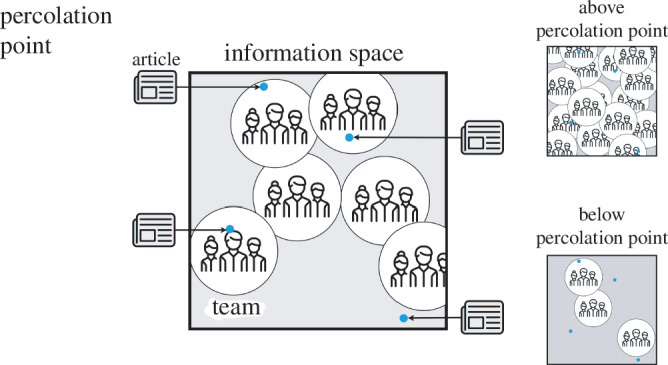
Social and biological collectives exchange information through internal networks to function. Less studied is the quantity and variety of information transmitted. We characterize the information flow into organizations, primarily business firms. We measure online reading using a large dataset of articles accessed by employees across millions of firms. We measure and relate quantitatively three aspects: reading volume, variety and firm size. We compare volume with size, showing that firm sizes grow sublinearly with reading volume. This is like an economy of scale in information consumption that exaggerates the classic Zipf's law inequality for firm economics. We connect variety and volume to show that reading variety is limited. Firms above a threshold size read repetitively, consistent with the onset of a coordination problem between teams of employees in a simple model. Finally, we relate reading variety to size. The relationship is consistent with large firms that accumulate interests as they grow. We argue that this reflects structural constraints. Taking the scaling relations as a baseline, we show that excess reading is strongly correlated with returns and valuations. The results indicate how information consumption reflects internal structure, beyond individual employees, as is likewise important for collective information processing in other systems.

Keywords: firms; information; reading; scaling.


Conflict of interest statement

We declare we have no competing interests.

Figures

Scaling of firm size measures (a) assets, (b) plants, property, equipment (PPE),
Figure 1.
Scaling of firm size measures (a) assets, (b) plants, property, equipment (PPE), (c) employees, and (d) sales with record count. North American Industrial Classification System sectors utilities (orange), professional, scientific and technical services (red), and all other (grey) firms. Black line shows a power law fit to equation 2.1 with exponents (a) β=0.73±0.01 , (b) β=0.82±0.02 , (c) β=0.79±0.01 and (d) β=0.80±0.01 using one s.d. from bootstrapped fits as error bars. Fitting range R160 given by the fit to the distribution in figure 2e .
(a−d) Scaling of sales with information variables. Mining (green), service (red) and all other (grey) firms.
Figure 2.
(a−d) Scaling of sales with information variables. Mining (green), service (red) and all other (grey) firms. Black line is the scaling fit. Scaling exponents are β=0.80±0.01 , β=0.85±0.01 , β=1.03±0.02 and β=1.16±0.03 using bootstrapped error bars. Fits are only to data points above the lower cut-off. Lower cut-off is given by the fit to the distributions in the panel directly below except for topics, where the lower cut-off is set a priori to the topic relevancy vector size of 10. (e−h) Distribution of the number of records α=1.88 , articles α=1.92 , sources α=1.97 and topics α=1.80 per firm shows power law scaling in the tails. A standard fitting procedure involving maximum likelihood for the exponent α with the Kolmogorov−Smirnov statistic for the lower bounds returns xmin=160 , xmin=70 and xmin=62 [33]. For topics, the lower bound is fixed at xmin=10 and the maximum at xmax=4338 . Our simplified scaling model does not capture the curvature in (d). See the electronic supplementary material, table S2 for further exponents.
Diversity of information collected by firms as Heaps’ plots for firm reading. Growth of (a)articles
Figure 3.
Diversity of information collected by firms as Heaps’ plots for firm reading. Growth of (a) articles A , (b) sources S , and (c) topics T with number of records R along with fits of information-overlap model as lines. For a given logarithmic bin R , we show the firms with maximal variety in reading (orange markers) and firms with mean reading variety (blue markers). While the total number of articles ( A~40 million) and sources (S ∼ 8 00 000) is much greater than what any single firm accesses in the subsample, the number of topics is bounded at T=4,338 . To avoid overfitting to the cut-off, we scan over a range of values and only take fit values that are of sufficiently low error and do not violate physical limits (more details in electronic supplementary material, appendix D). Estimated team size scaling exponents are b3/10 for both mean and max curves for articles. For sources, b1/3 and b2/5 for mean and max, respectively. For topics, b1/2 and b2/3 . Points R* at which the maximal curves fall below 90% of the 1 : 1 line are indicated with arrows R=1645 records for articles, R=41 records for sources and R=18 records for topics.
Diagram of information processing model. Firm consists of organizational units, each with a range of expertise in a high-dimensional space of information,
Figure 4.
Diagram of information processing model. Firm consists of organizational units, each with a range of expertise in a high-dimensional space of information content, here projected onto two dimensions. If an article falls into the range of expertise of a unit, the firm can realize a benefit (equation 3.1). In small firms below the percolation point, teams hardly fill the space and in large firms above the percolation point teams overlap substantially. The percolation point is the point at which the majority of units begin to touch. Below it, organizational units generally do not overlap, and above it organizational units generally do. Our formulation is general and allows for a wide range of interpretations that are consistent with the probabilistic formulation such as limited variations of goal-directed search, random realization of the economic benefit, biased distribution of information and teams in the space, information that is passed around the firm to find an expert, among others.
Predicted asset growth with topics from combining the information processing model from figure 3
Figure 5.
Predicted relationship between assets and topics from combining the information processing model from figure 3 and the scaling between assets and records (see the electronic supplementary material, table S2). Grey points indicate public firms. A superlinear curve in the tail indicates increasing assets per topic read, whereas a sublinear curve decreasing assets per topic read, or an intensive versus extensive strategy, respectively. Linear scaling indicates proportional growth in assets with topic variety such as if investments were split equally across them. Best estimates for scaling in the tail are approximately A~T3 for the mean and A~T3/2 for the max, which both correspond to intensive strategies. Shaded regions indicate 95% confidence intervals as defined in electronic supplementary material, appendix D. Bottommost error bars extend to sublinear scaling, or roughly as A~T9/10 .

References

    1. Couzin ID, Krause J, Franks NR, Levin SA. 2005. Effective leadership and decision-making in animal groups on the move. Nature 433 , 513–516. (10.1038/nature03236) - DOI - PubMed
    1. Ballerini M, et al. . 2008. Interaction ruling animal collective behavior depends on topological rather than metric distance: evidence from a field study. Proc. Natl Acad. Sci. USA 105 , 1232–1237. (10.1073/pnas.0711437105) - DOI - PMC - PubMed
    1. Rosenthal SB, Twomey CR, Hartnett AT, Wu HS, Couzin ID. 2015. Revealing the hidden networks of interaction in mobile animal groups allows prediction of complex behavioral contagion. Proc. Natl Acad. Sci. USA 112 , 4690–4695. (10.1073/pnas.1420068112) - DOI - PMC - PubMed
    1. Hartnett AT, Schertzer E, Levin SA, Couzin ID. 2016. Heterogeneous preference and local nonlinearity in consensus decision making. Phys. Rev. Lett. 116 , 038701. (10.1103/PhysRevLett.116.038701) - DOI - PubMed
    1. Brush ER, Krakauer DC, Flack JC. 2013. A family of algorithms for computing consensus about node state from network data. PLoS Comput. Biol. 9 , e1003109. (10.1371/journal.pcbi.1003109) - DOI - PMC - PubMed

LinkOut - more resources