. 2024 Nov;13(11):e70011.
doi: 10.1002/jev2.70011.

Efficient enzyme-free isolation of brain-derived extracellular vesicles

Affiliations

Efficient enzyme-free isolation of brain-derived extracellular vesicles

Andreu Matamoros-Angles et al. J Extracell Vesicles. 2024 Nov.

Abstract

Extracellular vesicles (EVs) have gained significant attention as pathology mediators and potential diagnostic tools for neurodegenerative diseases. However, isolation of brain-derived EVs (BDEVs) from tissue remains challenging, often involving enzymatic digestion steps that may compromise the integrity of EV proteins and overall functionality. Here, we describe that collagenase digestion, commonly used for BDEV isolation, produces undesired protein cleavage of EV-associated proteins in brain tissue homogenates and cell-derived EVs. In order to avoid this effect, we studied the possibility of isolating BDEVs with a reduced amount of collagenase or without any protease. Characterization of the isolated BDEVs from mouse and human samples (both female and male) revealed their characteristic morphology and size distribution with both approaches. However, we show that even minor enzymatic digestion induces 'artificial' proteolytic processing in key BDEV markers, such as Flotillin-1, CD81, and the cellular prion protein (PrPC), whereas avoiding enzymatic treatment completely preserves their integrity. We found no major differences in mRNA and protein content between non-enzymatically and enzymatically isolated BDEVs, suggesting that the same BDEV populations are purified with both approaches. Intriguingly, the lack of Golgi marker GM130 signal, often referred to as contamination indicator (or negative marker) in EV preparations, seems to result from enzymatic digestion rather than from its actual absence in BDEV samples. Overall, we show that non-enzymatic isolation of EVs from brain tissue is possible and avoids artificial pruning of proteins while achieving an overall high BDEV yield and purity. This protocol will help to understand the functions of BDEV and their associated proteins in a near-physiological setting, thus opening new research approaches.

Keywords: BDEVs; EV corona; GM130; PrPC; brain‐derived EVs; collagenase‐free; prion protein; proteomics.


Conflict of interest statement

The authors declare no conflict of interest.

Figures
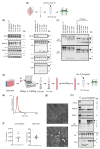
FIGURE 1
FIGURE 1
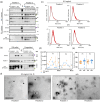
Collagenase digestion induces undesired cleavage of EV‐relevant (surface) proteins in both brain tissue and cell‐derived EVs. (a) Schematic drawing depicting the collagenase treatment in brain tissue. One mouse hemisphere was dissected and homogenized manually in PBS. Subsequently, 100 µL of homogenate underwent treatment with collagenase D at either high concentration equivalent to 2 mg/mL or low concentration 0.5 mg/mL and collagenase III at either high (1.5 mg/mL) or low (0.4 mg/mL) concentrations and was then incubated for 30 min at 37°C before being subject to WB analysis. (b) Representative WBs of relevant proteins used as EV markers after collagenase treatment. In the left panel, LRP1, Flotillin‐1, and 14‐3‐3 remained unaffected by both collagenase treatments, but ADAM10 amounts were diminished with collagenase III. However, in the right panel, Alix, CD9, and CD81 are visibly cut, producing lower molecular weight (MW) fragments (indicated by green arrowheads) in addition to the expected MW (black arrowheads). GM130 (purple arrowhead) was also found to be digested by collagenase treatments. Non‐digested samples with (+) and without protease inhibitors (PI) were used as controls. (c) PrPC patterns after collagenase treatment and with or without PNGase F digestion were detected by POM1 and 6D11 antibodies. The N‐glycan removal shows exacerbated PrP‐C1‐like (∼15 kDa; blue arrowhead) and PrP‐N1‐like (∼10 kDa; purple arrowhead) fragments, and another generated fragment (green arrowheads) slightly shorter than full‐length PrPC (black arrowheads). (d) Schematic drawing depicting the isolation and collagenase treatment of N2a‐EVs. EVs were isolated by differential centrifugation and filtration (n = 9). Then, samples were divided into two tubes, each containing 3.0×10⁶ EVs, and treated or not with collagenase D (2 mg/mL; 30 min incubation at 37°C) followed by WB analysis. (e) Representative size distribution graph from NTA before collagenase treatment. (f) The concentration of particles per mL and mode size analysis (in nm) of N2a‐EVs were measured with NTA (n = 9). Data are presented as mean ± S.E.M. (g) Representative TEM images of N2a cell‐derived EVs. (h) Representative WBs of N2a‐EVs (n = 3 each) treated or not with collagenase D. N2a cell lysate was used as a loading control. The outer‐membrane proteins CD81 and PrPC are altered, but not ADAM10 and the luminal markers Flotillin‐1 and Alix. Schema (a) created in BioRender. Matamoros, A. (2024) BioRender.com/a98v729 and schema (d) created in BioRender. Matamoros, A. (2024) BioRender.com/k55o413.
FIGURE 2
FIGURE 2
Simplified non‐enzymatic BDEV isolation protocol. Schematic representation of the new enzyme‐free BDEVs isolation protocol: human or murine brain tissue was manually minced in RPMI media and transferred to a new tube, where a DNAse I treatment was carried out at 37°C for 30 min. The reaction was stopped by adding a protease inhibitor cocktail. Next, differential centrifugation was applied (200 × g, 2,000 × g, and 10,000 × g), and the BDEV‐containing supernatant was diluted in PBS. BDEVs were then pelleted and washed at 120,000 × g before being separated in an iodixanol‐based gradient at 185,000 × g. Fractions (F) were collected, and F1 and F2 (which mainly contained the BDEVs) were washed in PBS and pelleted at 120,000 × g. Figure created in BioRender. Matamoros, A. (2024) BioRender.com/t17h786.
FIGURE 3
FIGURE 3
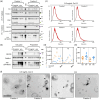
BDEV isolation from mouse brain tissue without enzymatic digestion maintains BDEV purity and prevents artificial proteolytic processes. (a) WB analyses of F1 and F2 BDEVs samples isolated from female mouse brain tissue, with or without the addition of 0.5 mg/mL of collagenase D (n = 3 for each condition), were labelled for PrPC, the EV positive markers Alix, Flotillin‐1, and CD81 as well as for the Golgi and nuclear markers, GM130 and Lamin A/C as EV negative markers. The green arrowheads indicate collagenase‐mediated cleavage fragments observed for PrPC, CD81, and Flotillin‐1, while the purple arrowhead denotes the unexpected presence of GM130 (in non‐enzyme‐treated F2). A total mouse brain homogenate (BH) served as a control. In (b), the 10,000×g pellet (10K) and the pre‐gradient BDEVs show a total GM130 disappearance when collagenase was used, and PrPC and Flotillin‐1 again displayed the cleavage pattern observed before in BDEVs. (c) Representative size distribution graphs from NTA analysis of F1 and F2 BDEVs show the expected normal‐like distribution. The concentration of particles per mg of initial tissue (d) and mode size analysis in nm (e) of BDEVs obtained with both protocols were measured with NTA (n = 9 for each condition). The particle concentration values are shown as the mean value of each sample measurement with its SD derived from its technical replicates. No differences in the particle mode size were observed between the same fraction in both protocols, but the F1 displayed significantly fewer particles/mg of tissue than the F1+. Data are presented as mean ± S.D. in (d) and (e). (f) TEM images of negative stained BDEVs showing the typical double membrane and cup shape. BDEVs are indicated with arrowheads. Scale bar = 500 nm.
FIGURE 4
FIGURE 4
BDEV isolation from human brain tissue without enzymatic digestion maintains BDEV purity and prevents artificial proteolytic processing. (a) Representative WBs of F1 and F2 BDEVs samples isolated from male human brain tissue, with or without the addition of 0.5 mg/mL of collagenase D (n = 3 for each condition), for PrPC, the EV positive markers Alix, Flotillin‐1, and CD81 and the Golgi and nuclear markers, GM130 and Lamin A/C, as EV negative markers. Green arrowheads indicate collagenase‐mediated cleavages observed for PrPC, CD81, and Flotillin‐1, and the “unexpected” bands for GM130 in F2 (w/o collagenase) are indicated by a purple arrowhead. A total human brain homogenate (BH) was used as a loading control. In (b), the 10,000 × g pellet (10K) and the pre‐gradient BDEVs show a total GM130 disappearance when collagenase was used, and PrPC and Flotillin‐1 displayed the cleavage pattern observed before in BDEVs. (c) Representative size distribution graphs from NTA analysis of F1 and F2 BDEVs show the expected normal‐like distribution. The concentration of particles per mg of initial tissue (d) and mode size analysis in nm (e) of BDEVs obtained with both protocols were measured with NTA (n = 9 for each condition). The particle concentration values are shown as the mean value of each sample measurement with its SD derived from its technical replicates. No differences were observed in the particle concentration between both protocols, however when comparing BDEV from the same fraction isolated with both approaches. Data are presented as mean ± S.D. in (d) and (e). (f) TEM images of negative stained BDEV illustrating the typical double membrane and cup shape. BDEVs are indicated with arrowheads. Scale bar = 500 nm.
FIGURE 5
FIGURE 5
The proteomes of mouse BDEVs isolated using the collagenase‐free method (indicated with ‘−’) and those with the collagenase‐based protocol (labelled as ‘+’) were analysed systematically (n = 3, female, for each condition). (a) Venn diagrams display a high overlap in the detected proteins between F1 and F1+ as well as between F2 and F2+. Heatmaps displaying protein abundances (column z‐score) of F1 compared to F1+ (b) and F2 versus F2+ (c). Scatter plots showing principal component analysis (PCA) of the proteomic composition of mouse BDEVs prepared using the two protocols for F1 (d) and F2 (e). Correlation plots highlight the similarities between F1 and F1+ (f) and between F2 and F2+ (g); the colour key represents variations in Pearson's correlation coefficient values. Proteins constituting the mouse BDEVs were checked for their overlap with the Vesiclepedia database using the FunRich enrichment software (h). Mouse BDEV samples obtained with collagenase‐free and collagenase‐assisted methods from both F1 and F2 showed high overlaps for their constituting proteins (more than 74%), with the Vesiclepedia database. Graphs showing normalized protein abundances of bona fide EV markers observed in col+ and col‐ F1 and F2 BDEVs isolated from female mice (i).
FIGURE 6
FIGURE 6
(a) The inverted volcano plot shows the 1,181 proteins commonly expressed with no expression (abundance) differences in F1 compared to F1+; 94 proteins were found to be overexpressed, and 84 proteins were found to be downregulated in F1 compared to F1+, shown in grey. (b) Inverted volcano plot shows 1,175 proteins commonly expressed with no difference in their relative abundances in F2 and F2+ (in red); 166 proteins were found over‐expressed, and 336 proteins were found to be less expressed in F2 when compared to F2+. In a and b, the x‐axis signifies log2 fold change (F1/ F1+). The y‐axis shows the log10 of p‐values; y‐axis values larger than −1.3 (log10 of 0.05) highlight expression difference values with p‐values > 0.05 for the pairwise student t‐test. The intercepts on the x‐axis indicate the cut‐offs for expression changes, set at −1.5‐fold for down‐regulation and +1.5‐fold for up‐regulation. The intercept on the y‐axis marks the cut‐off set for −1.3 (log10 of 0.05). (c) Dot plots depicting the top 20 cellular component categories linked to proteins expressed with no significant differences in their abundances between F1 and F1+ and between F2 and F2+ BDEVs. These categories are based on gene ontology database, and the colour key indicates the adjusted p‐values resulting from the over‐representation analysis performed with EnrichR.
FIGURE 7
FIGURE 7
Systematic analysis of human BDEV proteomes: Human BDEVs isolated with or without collagenase show a major compositional overlap. The proteomes of human‐BDEVs isolated using the collagenase‐free method (indicated with ‘−’) and those with the collagenase‐based protocol (labelled as ‘+’) were analysed systematically (n = 3, male, for each condition). (a) Venn diagrams display a high compositional overlap between F1 and F1+ as well as between F2 and F2+. Heatmaps displaying protein abundances (column z‐score) of F1 compared to F1+ (b) and F2 versus F2+ (c). Scatter plots showing principal component analysis (PCA) of the proteomic composition of human‐derived BDEVs prepared using the two protocols for F1 (d) and F2 (e). The correlation plots highlight the similarities between F1 (− vs. +) (f) and F2 (− vs +) samples (g). The colour key represents variations in Pearson's correlation coefficient values. Over 80% of proteins from F1 and F2 EVs from both preparations of human BDEV were found in the Vesiclepedia database (h). Normalized protein abundances of bona fide EV markers observed in col+ and col F1 and F2 BDEVs isolated from female mice (i).
FIGURE 8
FIGURE 8
Pairwise comparisons of protein expression patterns highlight a high number of commonly expressed proteins between the col− and col+ human BDEVs, belonging to diverse gene ontology terms. (a) Inverted volcano plot highlighting a big overlap (1,454 proteins with no expression differences, shown in red) between F1 and F1+ BDEVs. Relatively under‐represented (37 proteins) and up‐regulated (91 proteins) in F1 are displayed in grey. (b) Inverted volcano plot showing 1,407 proteins commonly expressed with no difference in their relative abundances in F2 and F2+; 68 proteins were found to be more abundant, and 192 proteins were found to be less expressed in F2 in comparison to F2+. In a and b, the x‐axis signifies log2 fold change (F1/ F1+). The y‐axis shows the log10 of p‐values; y‐axis values larger than −1.3 (log10 of 0.05) highlight expression difference values with p‐values > 0.05 for the pairwise student t‐test. The intercepts on the x‐axis indicate the cut‐offs for expression changes, set at −1.5‐fold for down‐regulation and +1.5‐fold for up‐regulation. The intercept on the y‐axis marks the cut‐off set for −1.3 (log10 of 0.05). (c) Dot plots depicting the top 20 cellular component categories linked to proteins expressed with no significant differences in their abundances between F1 and F1+ and between F2 and F2+ BDEVs. These categories are based on gene ontology database, and the colour key indicates the adjusted p‐values resulting from the over‐representation analysis performed with EnrichR.
FIGURE 9
FIGURE 9
(a) Heat map displaying mRNA expressions (z‐score) of col (male samples, n = 3) and of col+ samples (n = 4) assessed by use of the Nanostring nCounter® Neuropathology panel without previous mRNA purification. (b) Correlation plot highlighting the similarities between samples isolated with collagenase‐free and collagenase‐based protocols. The colour key represents the variation in Pearson's correlation coefficient values. (c) Scatter plots showing principal component analysis (PCA) of mRNA expression profiles of col and col+. (d) Volcano plot highlighting the downregulated (shown in orange) and upregulated (shown in blue) mRNAs in the BDEV preparations. The x‐axis intercepts denote the thresholds for expression changes, established at 1.5‐fold for down‐regulation and 1.5‐fold for up‐regulation. The y‐axis intercept signifies the threshold set for a p‐value of 0.05.

References

    1. Acaz‐Fonseca, E. , Ortiz‐Rodriguez, A. , Lopez‐Rodriguez, A. B. , Garcia‐Segura, L. M. , & Astiz, M. (2017). Developmental sex differences in the metabolism of cardiolipin in Mouse. Cerebral Cortex Mitochondria . Scientific Reports, 7, 43878. - PMC - PubMed
    1. Antoniou, A. , Auderset, L. , Kaurani, L. , Sebastian, E. , Zeng, Y. , Allahham, M. , Cases‐Cunillera, S. , Schoch, S. , Gründemann, J. , Fischer, A. , & Schneider, A. (2023). Neuronal extracellular vesicles and associated microRNAs induce circuit connectivity downstream BDNF. Cell Reports, 42, 112063. - PubMed
    1. Autengruber, A. , Gereke, M. , Hansen, G. , Hennig, C. , & Bruder, D. (2012). Impact of enzymatic tissue disintegration on the level of surface molecule expression and immune cell function. European Journal of Microbiology & Immunology, 2, 112–120. - PMC - PubMed
    1. Bachurski, D. , Schuldner, M. , Nguyen, P. H. , Malz, A. , Reiners, K. S. , Grenzi, P. C. , Babatz, F. , Schauss, A. C. , Hansen, H. P. , Hallek, M. , & Pogge von Strandmann, E. (2019). Extracellular vesicle measurements with nanoparticle tracking analysis—An accuracy and repeatability comparison between NanoSight NS300 and ZetaView. Journal of Extracellular Vesicles, 8, 1596016. - PMC - PubMed
    1. Brenna, S. , Altmeppen, H. C. , Mohammadi, B. , Rissiek, B. , Schlink, F. , Ludewig, P. , Krisp, C. , Schlüter, H. , Failla, A. V. , Schneider, C. , Glatzel, M. , Puig, B. , & Magnus, T. (2020). Characterization of brain‐derived extracellular vesicles reveals changes in cellular origin after stroke and enrichment of the prion protein with a potential role in cellular uptake. Journal of Extracellular Vesicles, 9, 1809065. - PMC - PubMed