. 2024 Dec 1;137(6):1632-1641.
doi: 10.1152/japplphysiol.00247.2024. Epub 2024 Nov 7.

Marked hemoglobin mass expansion and plasma volume contraction in Sherpas acclimatizing to 5,400 m altitude

Affiliations

Marked hemoglobin mass expansion and plasma volume contraction in Sherpas acclimatizing to 5,400 m altitude

Johanna Roche et al. J Appl Physiol (1985). .

Abstract

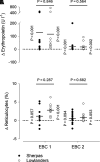
In lowlanders, high altitude (HA) acclimatization induces hemoconcentration by reducing plasma volume (PV) and increasing total hemoglobin mass (Hbmass). Conversely, Tibetan highlanders living at HA are reported to have a similar hemoglobin concentration ([Hb]) as lowlanders near sea level, and we investigated whether this reflects alterations in the PV or the Hbmass response to HA. Baseline assessment of PV and Hbmass was performed by carbon monoxide rebreathing at low altitudes (∼1,400 m) in Sherpas (an ethnic group of Tibetans living in Nepal) and native lowlanders. Participants then ascended to the Everest Base Camp (EBC) (5,400 m), where further measurements were performed after ∼2 days (EBC 1) and ∼6 wk (EBC 2). While on EBC 1 an increase in [Hb] was observed in lowlanders (P = 0.004) but not in Sherpas (P = 0.179), marked increases in [Hb] were observed in both groups on EBC 2 (P < 0.001). On EBC 1, Hbmass (Sherpas, P = 0.393; lowlanders, P = 0.123) and PV (Sherpas, P = 0.348; lowlanders, P = 0.172) were not different from baseline in either group, while circulating erythropoietin was increased in both groups (P < 0.001). On EBC 2, large increases in Hbmass and reductions in PV were observed along with elevated circulating erythropoietin in both groups (all P < 0.002). Neither the increases in erythropoietin on EBC 1 (P = 0.846) or EBC 2 (P = 0.564) nor the expansion of Hbmass (P = 0.771) or reduction in PV (P = 0.099) on EBC 2 differed between the groups. We conclude that the hematological response of Sherpas to extended exposure to very high altitudes does not fundamentally differ from that of native lowlanders.NEW & NOTEWORTHY We measured the hematological response to ∼6 wk exposure to an altitude of 5,400 m in Sherpa highland natives and Nepalese lowlanders. While the increase in hemoglobin concentration at high altitudes tended to be smaller in Sherpas than in lowlanders, the two groups experienced a similar reduction in plasma volume and increase in hemoglobin mass. We conclude that the hematological response of Sherpas to high-altitude exposure does not fundamentally differ from that of lowlanders.

Keywords: hematocrit; hemoglobin; hypoxia; plasma volume; sherpas.


Conflict of interest statement

No conflicts of interest, financial or otherwise, are declared by the authors.

Figures

None
Graphical abstract
Figure 1.
Figure 1.
Protocol overview with number of participants and dropouts at each measurement time point. First recruitment was performed before the initial baseline testing in Kathmandu (KTM). Due to a large number of dropouts, a second round of recruitment was performed before the second measurement time point in the Everest Base Camp (EBC 2). The newly recruited participants had spent a similar number of days in the EBC as the originally recruited participants. Baseline measurements were performed for the newly recruited participants after the end of their sojourn in the EBC. Changes from baseline could thus be assessed on the first time point in the EBC (EBC 1) in 9 Sherpas and 14 lowlanders, and on EBC 2 in 15 Sherpas and 16 lowlanders, respectively.
Figure 2.
Figure 2.
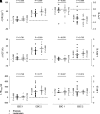
AF: hematological changes in the Everest Base Camp (EBC). Circles represent individual changes from baseline during the two measurement time points in the EBC, whereas average changes are illustrated for Sherpas and lowlanders by horizontal lines. Vertical P-values correspond to the change from baseline within a given group and horizontal P-values to the comparison of changes between groups. A mixed model repeated measures (MMRM) analysis was used for statistical analysis with P-values corrected by Tukey’s method for multiple comparisons. EBC 1 (9 Sherpas and 14 lowlanders) and EBC 2 (15 Sherpas and 16 lowlanders) measurements were performed 2.3 ± 1.3 and 46.1 ± 4.3 days after arrival in the EBC, which was reached by foot ascent over the course of 5.0 ± 1.5 days. [Hb], venous hemoglobin concentration; BV, total blood volume; Hbmass, total hemoglobin mass; HCT, venous hematocrit; PV, plasma volume; RCV, total red cell volume; Δ, change from baseline.
Figure 3.
Figure 3.
Changes in venous erythropoietin (A) and reticulocyte (B) concentrations in the Everest Base Camp (EBC). Circles represent individual changes from baseline during the two measurement time points in the EBC, whereas average changes are illustrated for Sherpas and lowlanders by horizontal lines. Vertical P-values correspond to the change from baseline within a given group and horizontal P-values to the comparison of changes between groups. A mixed model repeated measures (MMRM) analysis was used for statistical analysis with P-values corrected by Tukey’s method for multiple comparisons. EBC 1 (9 Sherpas and 14 lowlanders) and EBC 2 (15 Sherpas and 16 lowlanders) measurements were performed 2.3 ± 1.3 and 46.1 ± 4.3 days after arrival in the EBC, which was reached by foot ascent over the course of 5.0 ± 1.5 days. Δ, change from baseline; erythropoietin and reticulocyte concentrations as measured in venous blood.
Figure 4.
Figure 4.
A and B: changes in plasma proteins in the Everest Base Camp (EBC). Circles represent individual changes from baseline during the two measurement time points in the EBC, whereas average changes are illustrated for Sherpas and lowlanders by horizontal lines. Vertical P-values correspond to the change from baseline within a given group and horizontal P-values to the comparison of changes between groups. A mixed model repeated measures (MMRM) analysis was used for statistical analysis with P-values corrected by Tukey’s method for multiple comparisons. EBC 1 (9 Sherpas and 14 lowlanders) and EBC 2 (15 Sherpas and 16 lowlanders) measurements were performed 2.3 ± 1.3 and 46.1 ± 4.3 days after arrival in the EBC, which was reached by foot ascent over the course of 5.0 ± 1.5 days. PPC, plasma protein concentration in venous blood; TCP, total circulating protein mass; Δ, change from baseline.

References

    1. Siebenmann C, Roche J, Schlittler M, Simpson LL, Stembridge M. Regulation of haemoglobin concentration at high altitude. J Physiol 602: 5587–5600, 2024. doi:10.1113/JP284578. - DOI - PubMed
    1. Siebenmann C, Robach P, Lundby C. Regulation of blood volume in lowlanders exposed to high altitude. J Appl Physiol (1985) 123: 957–966, 2017. doi:10.1152/japplphysiol.00118.2017. - DOI - PubMed
    1. Beall CM. Two routes to functional adaptation: Tibetan and Andean high-altitude natives. Proc Natl Acad Sci USA 104, Suppl 1: 8655–8660, 2007. doi:10.1073/pnas.0701985104. - DOI - PMC - PubMed
    1. Simonson TS, Wei G, Wagner HE, Wuren T, Qin G, Yan M, Wagner PD, Ge RL. Low haemoglobin concentration in Tibetan males is associated with greater high-altitude exercise capacity. J Physiol 593: 3207–3218, 2015. [Erratum in J Physiol 594: 797, 2016]. doi:10.1113/JP270518. - DOI - PMC - PubMed
    1. Stembridge M, Williams AM, Gasho C, Dawkins TG, Drane A, Villafuerte FC, Levine BD, Shave R, Ainslie PN. The overlooked significance of plasma volume for successful adaptation to high altitude in Sherpa and Andean natives. Proc Natl Acad Sci USA 116: 16177–16179, 2019. doi:10.1073/pnas.1909002116. - DOI - PMC - PubMed

LinkOut - more resources