. 2024 Nov 7;148(1):61.
doi: 10.1007/s00401-024-02817-8.

Compartment-specific small non-coding RNA changes and nucleolar defects in human mesial temporal lobe epilepsy

Affiliations

Compartment-specific small non-coding RNA changes and nucleolar defects in human mesial temporal lobe epilepsy

Vamshidhar R Vangoor et al. Acta Neuropathol. .

Abstract

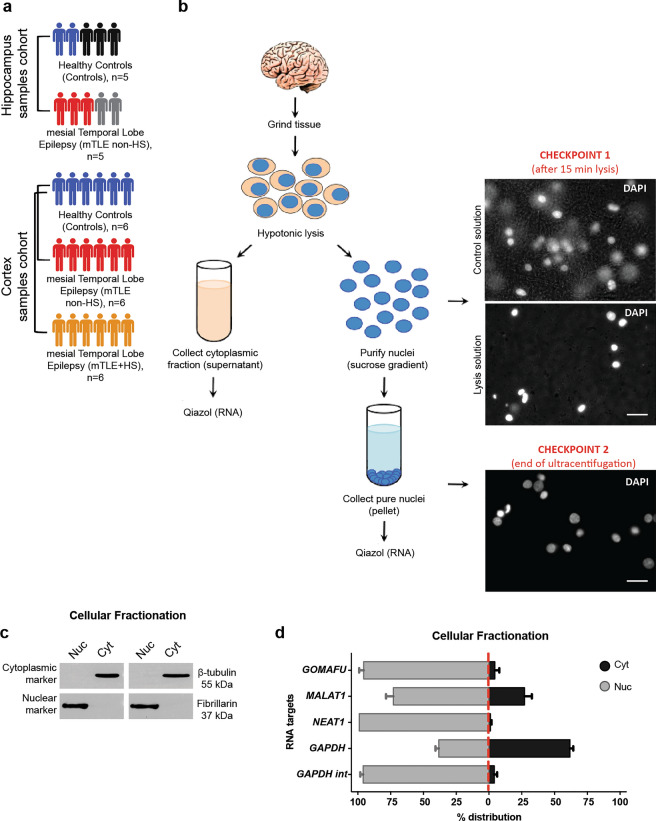
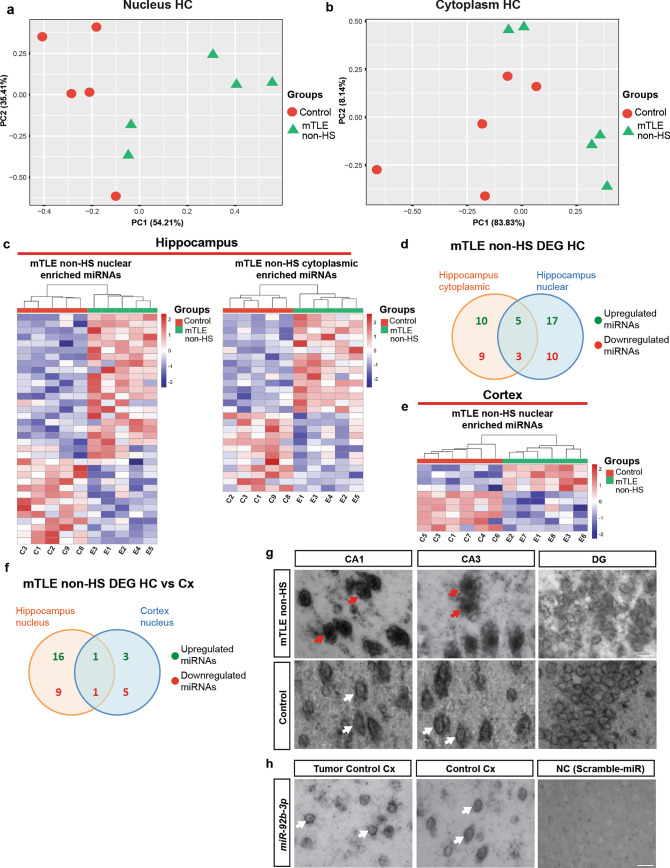
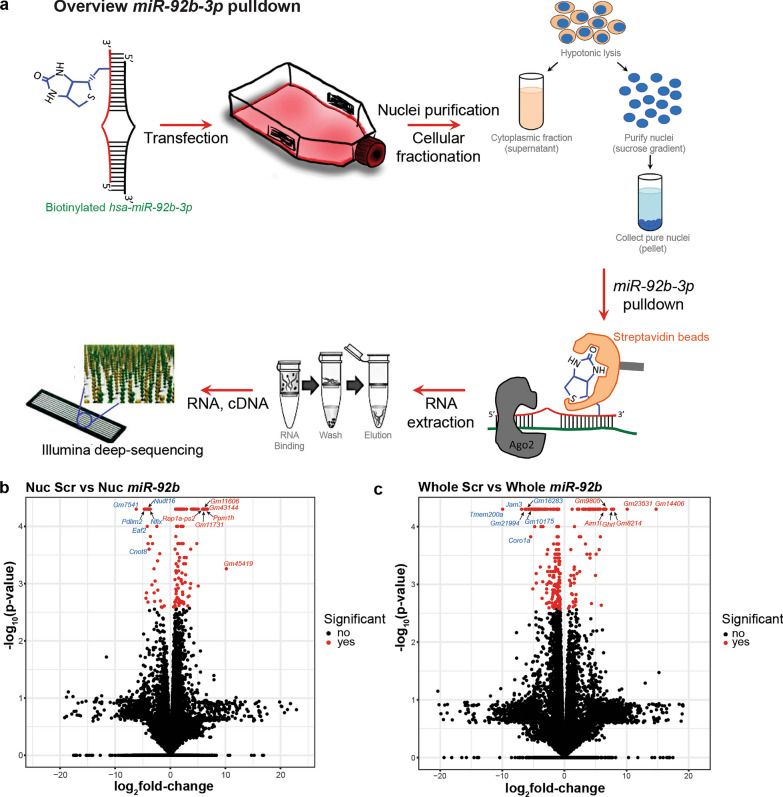
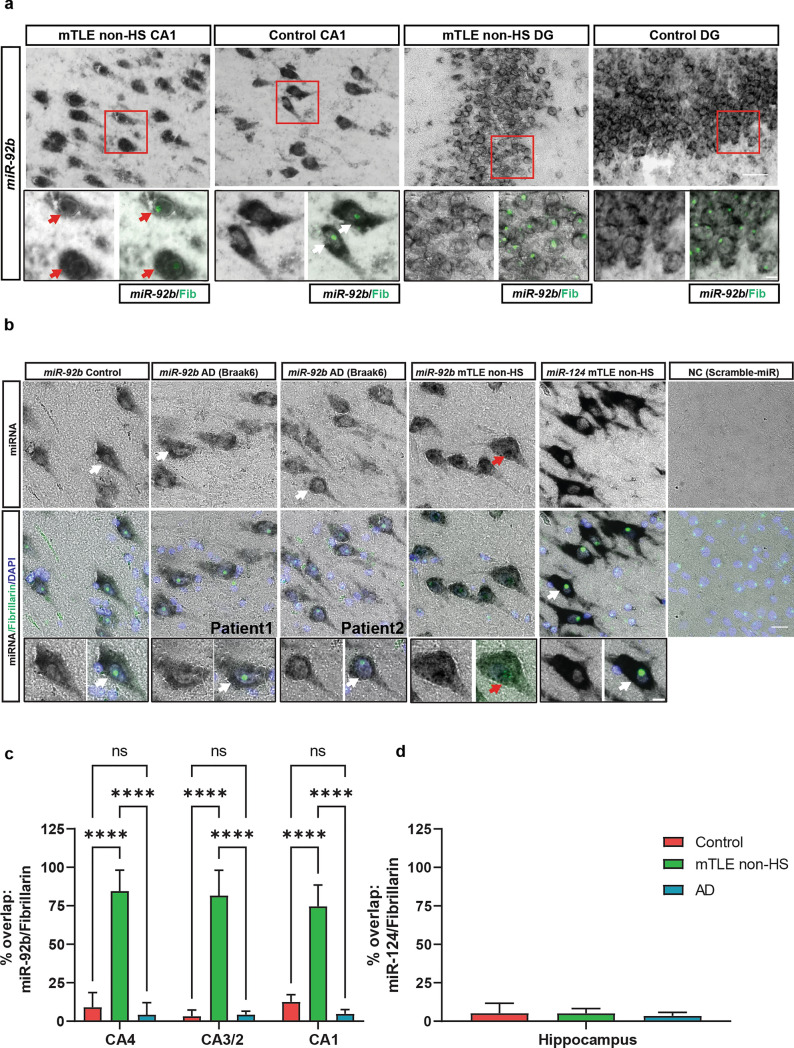
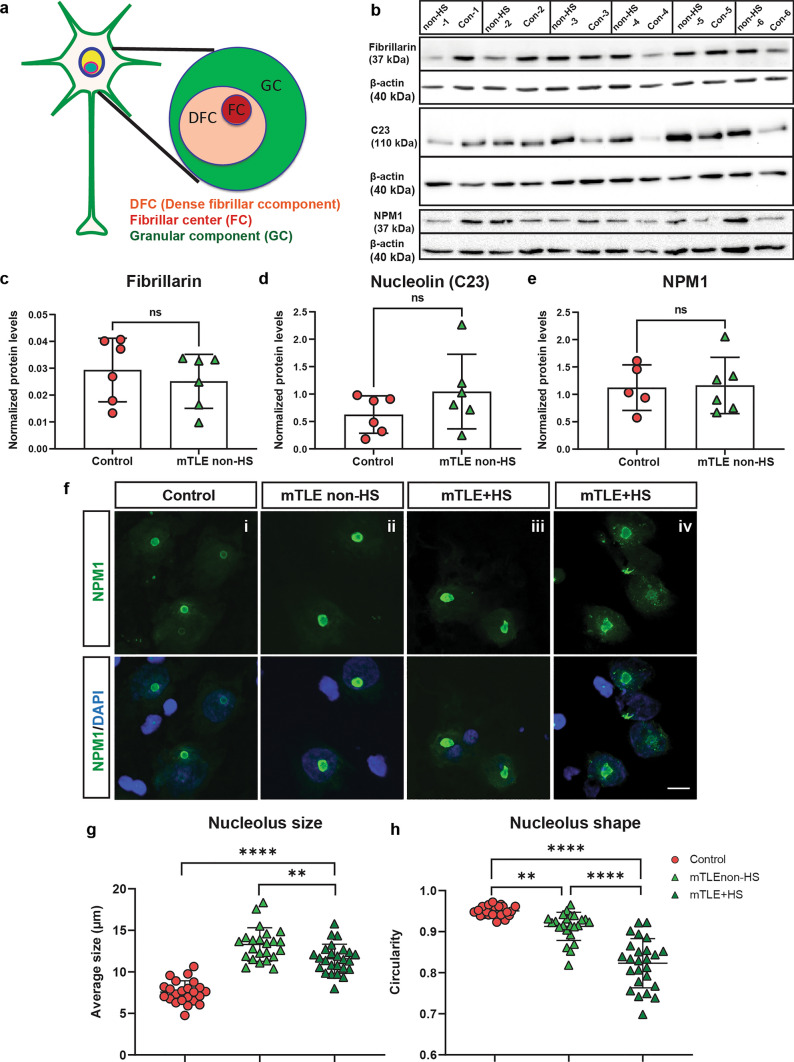
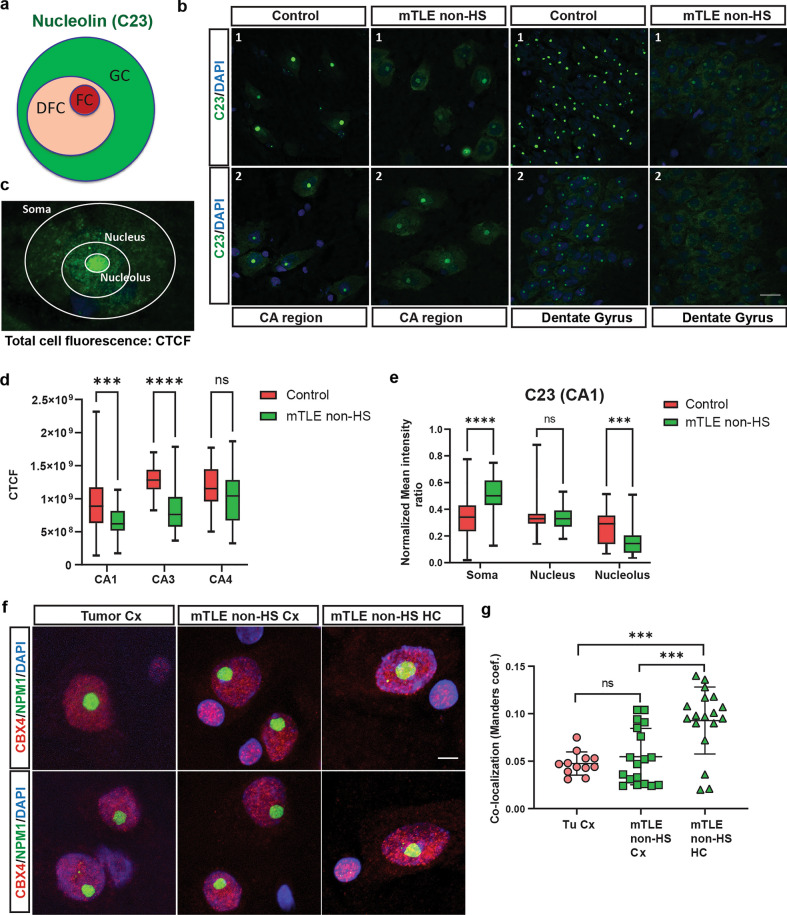
Mesial temporal lobe epilepsy (mTLE) is a debilitating disease characterized by recurrent seizures originating from temporal lobe structures such as the hippocampus. The pathogenic mechanisms underlying mTLE are incompletely understood but include changes in the expression of non-coding RNAs in affected brain regions. Previous work indicates that some of these changes may be selective to specific sub-cellular compartments, but the full extent of these changes and how these sub-cellular compartments themselves are affected remains largely unknown. Here, we performed small RNA sequencing (RNA-seq) of sub-cellular fractions of hippocampal tissue from mTLE patients and controls to determine nuclear and cytoplasmic expression levels of microRNAs (miRNAs). This showed differential expression of miRNAs and isomiRs, several of which displayed enriched nuclear expression in mTLE. Subsequent analysis of miR-92b, the most strongly deregulated miRNA in the nucleus, showed accumulation of this miRNA in the nucleolus in mTLE and association with snoRNAs. This prompted us to further study the nucleolus in human mTLE which uncovered several defects, such as altered nucleolar size or shape, mis-localization of nucleolar proteins, and deregulation of snoRNAs, indicative of nucleolar stress. In a rat model of epilepsy, nucleolar phenotypes were detected in the latency period before the onset of spontaneous seizures, suggesting that nucleolar changes may contribute to the development of seizures and mTLE. Overall, these data for the first time implicate nucleolar defects in the pathogenesis of mTLE and provide a valuable framework for further defining the functional consequences of altered sub-cellular RNA profiles in this disease.

Keywords: Epilepsy; Human; Non-coding RNA; Nucleolus; Small nucleolar RNA; microRNA.


Conflict of interest statement

M.T.V. is employed by the company Omiics ApS. The remaining authors declare no conflict of interest.

Figures

Fig. 1
Fig. 1
Nuclear fractionation of human brain tissue. a Schematic illustrating the different cohorts (resected brain material from mTLE patients and postmortem control tissue) used for small RNA-seq of hippocampal and cortical tissue. non-HS, no hippocampal sclerosis; + HS, hippocampal sclerosis. b Overview of the key steps of the cell fractionation procedure to isolate pure nuclear and cytoplasmic RNA samples. c Western blot analysis of nuclear (Nuc) and cytoplasmic (Cyto) fractions. Fibrillarin and β-Tubulin were used as nuclear and cytoplasmic markers, respectively. Consistent with its sub-cellular localization, fibrillarin was specifically detected in the nuclear fraction, whereas anti-β-tubulin antibody showed signal only in cytoplasmic fractions. n = 3 experiments were performed with similar results with both hippocampal and cortical tissue (n = 1 each) samples. d Quantitative RT-PCR for GOMAFU, MALAT1, NEAT1, GAPDH and GAPDHint (an intron retained variant of GAPDH) on nuclear and cytoplasmic RNA samples. Higher levels of GAPDH were reported in the cytoplasmic fraction, whereas the other genes were enriched in nuclear fractions. Enrichment is represented as a percentage of the distribution (% distribution) of a marker gene across the nuclear and cytoplasmic compartments. n = 3 experiments were performed with similar results, with n = 2 mTLE non-HS and one control human tissue samples. Data shown as means + SD
Fig. 2
Fig. 2
Compartment-specific changes in miRNA expression in human mTLE brain tissue. a, b Principal Component Analysis (PCA) for hippocampal (HC) nucleus and cytoplasmic samples from controls and mTLE non-HS patients (n = 5 each) based on deregulated miRNA expression detected by small RNA-seq. c Heatmaps showing differentially expressed miRNAs in nuclear and cytoplasmic samples from the HC of 5 controls (C1, C2, C3, C8, C9) and 5 mTLE non-HS patients (E1–5) determined by small RNA-seq. Hierarchical clustering is shown on top. For DE miRNAs see Supplementary excel file (Tab5 and Tab6). d Venn diagram showing the overlap of differentially expressed miRNAs in the HC cytoplasmic and nuclear fractions of mTLE non-HS patients. e Heatmap showing differentially expressed miRNAs in nuclear fractions of the cortex (Cx) of 6 controls (C1, C3–7) and 6 mTLE non-HS patients (E1–3, E6–8). For DE miRNAs, see Supplementary excel file (Tab7). f Venn diagram showing the overlap of differentially expressed miRNAs in nuclear fractions from mTLE non-HS HC and Cx tissue. g Representative images showing in situ hybridization for miR-92b-3p on coronal sections of postmortem control and mTLE non-HS HC [CA1, CA3, and dentate gyrus (DG) regions]. Red arrows indicate nuclear accumulation of miR-92b-3p in CA neurons. White arrows indicate normal cytoplasmic localization. Scale bar, 50 μm. n = 2 ISH experiments were performed with similar results. n = 3 control, n = 3 mTLE non-HS. h Representative images showing in situ hybridization (ISH) for miR-92b-3p on coronal sections on unaffected Cx tissue removed during tumor surgery (tumor control) or postmortem control Cx (control). NC, scrambled control probe. White arrows indicate normal miR-92b-3p cytoplasmic expression. Scrambled control probe did not yield specific signals. Scale bar, 50 μm. n = 1 ISH experiment, with n = 2 tumor control Cx, n = 3 control Cx
Fig. 3
Fig. 3
Identification of miR-92b-binding partners in neuronal cells. a Schematic illustrating the methods used to pulldown biotinylated miR-92b from Neuro2A cells (nucleus or whole cell) followed by RNA-seq. Ago2, argonaut2. b Volcano plots showing the DE genes following miR-92b pulldown from nuclear (Nuc) or whole cell (whole) Neuro2A samples. n = 3 samples per group, significantly DE genes are shown in red (padj < 0.05; logFC > 1 and < -1). A selection of strongly upregulated (in red) or downregulated (in blue) genes are indicated in the plots. For DE transcripts, see Supplementary excel file (Tab25 and Tab26)
Fig. 4
Fig. 4
Nucleolar enrichment of miR-92b in hippocampal neurons in human mTLE. a Representative images showing in situ hybridization (ISH) for miR-92b-3p in the CA1 and dentate gyrus (DG) regions of the hippocampus of control and mTLE non-HS cases in combination with immunohistochemistry for fibrillarin (Fib, in green; lower right panel). Boxed area is shown at higher magnification in the lower two panels. Nuclear signals and overlap with Fib staining are only observed for mTLE CA1 neurons (red arrows). White arrows indicate lack of enriched nuclear miR-92b signals. n = 2 ISH experiments were performed with similar results. n = 3 control, n = 4 mTLE non-HS. Scale bar, 50 μm and 10 μm (inset). b Representative images of miR-92b or miR-124 ISH in postmortem control, AD (2 different patients) and mTLE non-HS HC tissue (CA region) in combination with immunohistochemistry for Fib and DAPI (lower panels). NC, scrambled control probe. White arrows indicate lack of enriched nuclear miR-92b and miR-124 signals. Red arrow indicates nuclear accumulation of miR-92b. Scrambled control probe did not yield specific signals. Scale bar, 20 μm and 10 μm (inset). n = 2 ISH experiments were performed with similar results. n = 3 control, n = 4 mTLE non-HS, n = 5 AD. c Quantification of the percentage overlap of the miR-92b ISH and Fib IHC signals in different HC sub-regions (CA4, CA3/2, and CA1). Data (cells) are shown as means + SD. Two-way ANOVA, ****p < 0.001, ns, not significant. n (cells counted) = 817, 517 and 889 in controls (n = 4), mTLE non-HS (n = 4), and AD (n = 5) tissue, respectively. d Quantification of the percentage overlap of the miR-124 ISH and Fib IHC signals in the HC. One-way ANOVA, ns. n (cells counted) = 263, 334, and 386 in controls (n = 3), mTLE non-HS (n = 3), and AD (n = 3), respectively.
Fig. 5
Fig. 5
Changes in the size and shape of neuronal nucleoli in human mTLE. a Schematic showing the different sub-regions of a neuronal nucleolus. Fibrillar center (FC), granular component (GC), and dense fibrillar center (DFC). Fibrillarin marks the FC, and NPM1 and C23 antibody the GC. b Western Blot analysis of control and mTLE non-HS hippocampus (HC) tissue (n = 6 control and mTLE non-HS cases) for fibrillarin, NPM1, C23, and β-actin (loading control). ce Quantification of western blots as in b showing normalized protein levels (to β-actin) for fibrillarin (c), C23 (d), and NPM1 (e) for control and mTLE non-HS HC tissue. n = 6 controls and mTLE non-HS. For NPM1, n = 5 control and 6 patient samples were used (Con-5 was excluded from analysis due to an air bubble in the band). Mann–Whitney test. ns, not significant. Data (cases) are shown as means ± SD. f Representative images of immunohistochemistry for NPM1 in sections of the HC CA region of control (i) and mTLE non-HS (ii), and mTLE + HS (iii–iv) cases. DAPI in blue. Both the size and shape of NPM1 nucleoli is altered in mTLE. Scale bar, 10 μm. g Quantification of nucleolus size based on images as in f. Each datapoint represents mean size estimated of all measured cells determined from each individual images (control 23 images, mTLE non-HS 23 images, and mTLE + HS 25 images with at least 5 images per individual) collected from n = 4 controls and n = 4 mTLE patients. Ordinary one-way ANOVA with Sidak’s multiple comparisons, ****p < 0.0001, **p < 0.005. h Quantification of nucleolus shape based on images as in f. Each datapoint represents mean shape estimated of all measured cells determined from individual images (control 23 images, mTLE non-HS 23 images, mTLE + HS 25 images with at least 5 images per individual) collected from n = 4 controls and n = 4 mTLE patients. Shape was assessed as circularity with values closer to 1 being more circular. Ordinary one-way ANOVA with Sidak’s multiple comparisons, ****p < 0.0001, **p < 0.005
Fig. 6
Fig. 6
Abnormal localization of C23 and CBX4 in human mTLE hippocampus. a Schematic depicting key nucleolar regions labeled in different colors. Fibrillar center (FC), granular component (GC), and dense fibrillar center (DFC). C23 (nucleolin) marks the GC. b Representative images of immunohistochemistry for C23 in sections of the HC region [CA and dentate gyrus (DG)] from control and mTLE non-HS cases (n = 2 each). DAPI in blue. Scale bar, 20 μm. c Image showing C23 immunosignal and labeled for different individual sub-cellular compartments in which C23 immunofluorescence was measured. d Boxplots showing quantification of CTCF (total cell fluorescence) of C23 immunostaining in different CA hippocampal regions in control and mTLE non-HS cases from images as in b. C23 signals were reduced in the CA1 and CA3 regions. ANOVA with Sidak’s multiple comparisons test; ****p < 0.0001, ***p = 0.0009. n (cells measured) = CA1 54 from Controls and mTLE non-HS; CA3 26 and 36 in control and mTLE non-HS, respectively; CA4 28 and 29 cells from controls and mTLE non-HS, respectively, and from n = 4 control and n = 3 mTLE non-HS cases. e Boxplots showing quantification of C23 immunofluorescence in neuronal soma, nucleus, and nucleolus in the CA1 hippocampal region in control and mTLE non-HS cases from images as in b. C23 signals in the soma were increased and nucleolar labeling decreased in mTLE compared to control. Fluorescence signal in the nucleus was unchanged. ANOVA with Sidak’s multiple comparisons test; ns, not significant. ****p < 0.0001, ***p = 0.0001. n (cells measured) = CA1 54 each from Controls and mTLE non-HS from n = 4 control and n = 3 mTLE non-HS cases. f Representative images of double immunohistochemistry for NPM1 and CBX4 in sections of the Cx and HC from tumor control (Cx) and mTLE non-HS cases (Cx and HC). DAPI in blue. Scale bar, 5 μm. g Quantification of the co-localization of NPM1 and CBX4 in images as in f. Mander’s coefficient was determined using the JACoP plugin. Each datapoint represents the estimated coefficient determined from individual images collected from n = 2 tumor control (Tu Cx), n = 3 mTLE-non-HS Cx, and n = 3 mTLE non-HS HC. Data are shown as means ± SD. ANOVA with Tukey’s multiple comparisons test. ns, not significant, ***p < 0.001.
Fig. 7
Fig. 7
RNA seq analysis of human mTLE hippocampal cell compartments for all ncRNAs. a, b Principal Component Analysis (PCA) for hippocampal (HC) nucleus and cytoplasmic fractions from controls (n = 4) and mTLE non-HS patients (n = 5) based on deregulated small non-coding RNA (ncRNA) expression detected by small RNA-seq. c, d Volcano plots showing DE ncRNAs from nucleus and cytoplasm fractions in mTLE non-HS (as compared to control). Significantly DE genes are shown in red (padj < 0.05; logFC > 1 and <  − 1 [representing at least one fold change of difference in expression compared to control samples)]. A selection of strongly upregulated (in red) or downregulated (in blue) genes are indicated in the plots. For DE ncRNAs, see Supplementary excel file (Tab19 and Tab20). e, f Heatmap showing differentially expressed small ncRNAs in hippocampal (HC) nucleus and cytoplasmic fractions from controls (n = 4; C1–C3, C9) and mTLE non-HS patients (n = 5; E1–E5). For DE ncRNAs see Supplementary excel file (Tab19 and Tab20). g, h Pie chart showing the contribution of different classes of ncRNAs in the list of DE ncRNAs for nuclear (g) and cytoplasmic (h) fractions.in mTLE non-HS (as compared to control)
Fig. 8
Fig. 8
Differential snoRNA expression in human mTLE brain tissue. a, b Percentage of assigned reads for H/ACA and C/D class snoRNAs in cytoplasmic (cyt) and nuclear (nuc) fractions from control and mTLE non-HS HC samples. n = 4 control and n = 5 mTLE non-HS cases. Data are means ± SD. Unpaired t test, *p < 0.05, ns, not significant. c Heatmap showing differentially expressed snoRNAs in nuclear fractions from mTLE non-HS HC samples. Controls (n = 4; C1–C3, C9) and mTLE non-HS patients (n = 5; E1–E5). For DE snoRNA list, see Supplementary excel file (Tab20). d Venn diagram showing the overlap of snoRNAs identified in miR-92b immunoprecipitation and differentially expressed snoRNAs in nuclear fractions from mTLE non-HS HC. e Normalized transcripts per million (TPM) counts of the three common DE snoRNAs (see d) in the nucleus of control and mTLE non-HS cases. n = 4 control and n = 5 mTLE non-HS cases. Data are means ± SD. Unpaired t test; *p < 0.05; ****p < 0.0001

References

    1. Abdelmohsen K, Gorospe M (2012) RNA-binding protein nucleolin in disease. RNA Biol 9:799–808 - PMC - PubMed
    1. Abs E, Goorden SMI, Schreiber J, Overwater IE, Hoogeveen-Westerveld M, Bruinsma CF et al (2013) TORC1-dependent epilepsy caused by acute biallelic Tsc1 deletion in adult mice. Ann Neurol 74:569–579. 10.1002/ana.23943 - PubMed
    1. Andersen JS, Lam YW, Leung AKL, Ong S-E, Lyon CE, Lamond AI et al (2005) Nucleolar proteome dynamics. Nature 433:77–83. 10.1038/nature03207 - PubMed
    1. Azkanaz M, López AR, De Boer B, Huiting W, Angrand PO, Vellenga E et al (2019) Protein quality control in the nucleolus safeguards recovery of epigenetic regulators after heat shock. Elife 8:1–27. 10.7554/eLife.45205 - PMC - PubMed
    1. Baltanás FC, Berciano MT, Tapia O, Narcis JO, Lafarga V, Díaz D et al (2019) Nucleolin reorganization and nucleolar stress in Purkinje cells of mutant PCD mice. Neurobiol Dis 127:312–322. 10.1016/J.NBD.2019.03.017 - PubMed

Publication types

Supplementary concepts