. 2024 Nov 7;135(1):e181305.
doi: 10.1172/JCI181305.

Melanocortin-4 receptor antagonist TCMCB07 alleviates chemotherapy-induced anorexia and weight loss in rats

Affiliations

Melanocortin-4 receptor antagonist TCMCB07 alleviates chemotherapy-induced anorexia and weight loss in rats

Xinxia Zhu et al. J Clin Invest. .

Abstract

Cancer patients undergoing chemotherapy often experience anorexia and weight loss that substantially deteriorates overall health, reduces treatment tolerance and quality of life, and worsens oncologic outcomes. There are currently few effective therapeutic options to mitigate these side effects. The central melanocortin system, which plays a pivotal role in regulating appetite and energy homeostasis, presents a logical target for treating anorexia and weight loss. In this preclinical study, we evaluated the efficacy of TCMCB07, a synthetic antagonist of the melanocortin-4 receptor, in mitigating anorexia and weight loss in several rat models of chemotherapy: cisplatin, 5-fluorouracil, cyclophosphamide, vincristine, doxorubicin, and a combination of irinotecan and 5-fluorouracil. Our results indicate that peripheral administration of TCMCB07 improved appetite, stabilized body weight, preserved fat and heart mass, and slightly protected lean mass after multiple cycles of chemotherapy. Furthermore, combining TCMCB07 with a growth differentiation factor 15 antibody enhanced treatment effectiveness. Similar effects from TCMCB07 treatment were observed in a rat tumor model following combination chemotherapy. No notable adverse effects nor increased chemotherapy-related toxicities were observed with TCMCB07 treatment. These findings suggest that peripheral administration of TCMCB07 holds promise as a therapeutic approach for alleviating chemotherapy-induced anorexia and weight loss, potentially benefiting numerous patients undergoing chemotherapy.

Keywords: Cancer; Melanocortin; Oncology; Therapeutics.


Conflict of interest statement

Conflict of interest: DLM is a consultant, chief medical officer, stockholder, and has received grant funding from Endevica Bio Inc. DLM has served as a consultant for Alkermes Inc. and Pfizer Inc. XZ, RP, KAG, and EZ are stockholders in Endevica Bio Inc. RP, KAG, and EZ are salaried officers of Endevica Bio Inc.

Figures

Figure 1
Figure 1. Schematic of TCMCB07/chemotherapy study design.
(A) Schematic of TCMCB07/chemotherapy study design. SD male rats were treated with 3 cycles of chemotherapy via i.p. injection within 3 weeks at the following doses: cisplatin, 2.5 mg/kg; 5-FU, 70 mg/kg; CP, 65 mg/kg; vincristine, 0.27 mg/kg;, and doxorubicin 2 mg/kg. Control animals received an equivalent volume of saline i.p. injections. All rats received s.c. injections twice (2×) daily with either saline or TCMCB07 (3 mg/kg/day) from day 0 to 21. Initial and terminal body composition was measured using MRI prior to and after treatments. Food intake and body weight were monitored daily throughout entire experimental period (days 0–21). At the end of the experiment, tissues were harvested following euthanasia.
Figure 2
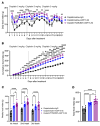
Figure 2. TCMCB07 treatment increases daily food intake throughout multiple cycles of various chemotherapy.
(AH) Daily and cumulative food intake after chemotherapy and TCMCB07 treatment throughout entire experimental period (days 0–21). (A and B) Cisplatin chemotherapy. (C and D) 5-FU chemotherapy. (E and F) CP chemotherapy. (G and H) Vincristine chemotherapy. All data in AH were expressed as mean ± SEM for each group. *Chemotherapy/saline group versus chemotherapy/TCMCB07 group; #Chemotherapy/saline group versus saline/saline group; &Chemotherapy/TCMCB07 group versus saline/saline group. n = 10–12. *,#,&P < 0.05; **,##,&&P < 0.01; ***,###, &&&P < 0.001; ****,####,&&&&P < 0.0001. All data in AH were analyzed by 2-way ANOVA.
Figure 3
Figure 3. TCMCB07 treatment increases weekly food intake after each cycle of various chemotherapy.
(AD) Weekly food intake after chemotherapy and TCMCB07 treatment throughout entire experimental period (days 0–21). (A) Cisplatin chemotherapy. (B) 5-FU chemotherapy. (C) CP chemotherapy. (D) Vincristine chemotherapy. All data in AD were expressed with each dot representing 1 sample. n = 10–12. *P < 0.05; **P < 0.01; ***P < 0.001; ****P < 0.0001. All data in AD were analyzed by 2-way ANOVA.
Figure 4
Figure 4. TCMCB07 treatment maintains body weight throughout multiple cycles of cisplatin or 5-FU chemotherapy.
(AD) Daily and weekly body weight gain (% initial body weight) after chemotherapy and TCMCB07 treatment. (A and B) Cisplatin chemotherapy. (C and D) 5-FU chemotherapy. All data in A and C were expressed as mean ± SEM for each group, and all data in B and D were expressed with each dot representing 1 sample. n = 10–12. (A and C) *Chemotherapy/saline versus chemotherapy/TCMCB07; #Chemotherapy/saline versus saline/saline; &Chemotherapy/TCMCB07 versus saline/saline. *,#,&P < 0.05; **,##,&&P < 0.01; ***,###,&&&P < 0.001; ****,####P < 0.0001. All data in AD were analyzed by 2-way ANOVA.
Figure 5
Figure 5. TCMCB07 treatment maintains body weight throughout multiple cycles of CP, vincristine, or doxorubicin chemotherapy.
(AF) Daily and weekly body weight gain (% initial body weight) after chemotherapy and TCMCB07 treatment. (A and B) CP chemotherapy. (C and D) Vincristine chemotherapy. (E and F) Doxorubicin chemotherapy. All data in A, C, and E were expressed as mean ± SEM for each group, and all data in B, D, and F were expressed with each dot representing 1 sample. n = 10–12. (A, C, and E), *Chemotherapy/saline versus chemotherapy/TCMCB07; #Chemotherapy/saline versus saline/saline; &Chemotherapy/TCMCB07 versus saline/saline. *,#,&P < 0.05; **,##,&&P < 0.01; ***,###,&&&P < 0.001; ****,####,&&&&P < 0.0001. All data in AH were analyzed by 2-way ANOVA.
Figure 6
Figure 6. TCMCB07 treatment attenuates chemotherapy-induced fat and lean mass loss.
(AD) Fat mass gain (% initial) and (EH) lean mass gain (% initial) after 3 cycles of chemotherapy and 21-day TCMCB07 treatment. (A and E) Cisplatin chemotherapy. (B and F) 5-FU chemotherapy. (C and G) CP chemotherapy. (D and H) Vincristine chemotherapy. All data in AH were expressed with each dot representing 1 sample. n = 10–12. *P < 0.05; **P < 0.01; ***P < 0.001; ****P < 0.0001. All data in AH were analyzed by 1-way ANOVA.
Figure 7
Figure 7. TCMCB07 treatment protects heart tissue during multiple cycles of chemotherapy.
(AD) Heart mass (% initial body weight) and (EH) gastrocnemius mass (% initial body weight) after 3 cycles of chemotherapy and 21-day TCMCB07 treatment. (A and E) Cisplatin chemotherapy. (B and F) 5-FU chemotherapy. (C and G) CP chemotherapy. (D and H) Vincristine chemotherapy. All data in AH were expressed with each dot representing 1 sample. n = 10–12. *P < 0.05; **P < 0.01; ***P < 0.001; ****P < 0.0001. All data in AH were analyzed by 1-way ANOVA.
Figure 8
Figure 8. Chemotherapy increases circulating GDF15 levels and study design for combination therapy of TCMCB07+GDF15 antibody.
(AE) SD male rat serum GDF15 concentrations measured from experiments: cisplatin/TCMCB07 (A), 5-FU /TCMCB07 (B), CP/TCMCB07 (C), vincristine/TCMCB07 (D), and doxorubicin/TCMCB07 (E). (F) Schematic of study design. All SD male rats were treated with cisplatin chemotherapy via i.p. injection at a dose of 5.0 mg/kg (1st cycle) or 3.0 mg/kg (2nd and 3rd cycles) once per week for 3 cycles. All the rats received s.c. injections twice (2×) daily with either saline or TCMCB07 (3 mg/kg/day) from day 0 to 21. Additionally, all the rats received s.c. injections twice (2×) weekly with either IgG or GDF15 antibody from day 0 to 21. The dose of TCMCB07 was 3 mg/kg/d, and the dose of GDF15 antibody and IgG control was 10 mg/kg. Initial and terminal body composition were measured using MRI before and after treatments. Food intake and body weight were monitored daily throughout entire experimental period (days 0–21). At the end of the experiment, tissues were harvested following euthanasia. All data in AE were expressed with each dot representing 1 sample.(A and B) n = 11–12. (CE) n = 5–6, as blood samples were collected from half of the animals in these experiments. *P < 0.05; **P < 0.01; ***P < 0.001; ****P < 0.0001. All data in AE were analyzed by 1-way ANOVA.
Figure 9
Figure 9. Combination therapy of TCMCB07+GDF15 antibody enhances effectiveness in reversing chemotherapy-induced anorexia.
(A) Daily and (B) cumulative food intake, (C) weekly and (D) total food intake after a higher dose (5 or 3 mg/kg) of cisplatin chemotherapy and treatment of TCMCB07 in combination with GDF15 antibody. All data in A and B were expressed as mean ± SEM for each group, and all data in C and D were expressed with each dot representing 1 sample. n = 11–12. (A and B), *Cisplatin/saline+IgG versus cisplatin/saline+GDF15 antibody; #Cisplatin/saline+IgG versus cisplatin/TCMCB07+GDF15 antibody; &Cisplatin/saline+GDF15 antibody versus cisplatin/TCMCB07+GDF15 antibody. *,#,&P < 0.05; **,##,&&P < 0.01; ***,###,&&&P < 0.001; ****,####,&&&&P < 0.0001. All data in AC were analyzed by 2-way ANOVA, and all data in D were analyzed by 1-way ANOVA.
Figure 10
Figure 10. Combination therapy of TCMCB07+GDF15 antibody improves effectiveness in maintaining body and tissue mass during chemotherapy.
(A) Daily and (B) weekly body weight gain (% initial), (C) fat and (D) lean mass gain (% initial), (E) heart and (F) gastrocnemius mass (% initial body weight), after treatment of cisplatin+saline+IgG, cisplatin+saline+GDF15 antibody (Ab), or cisplatin+TCMCB07+GDF15 Ab. All data in A were expressed as mean ± SEM for each group, and all data in BF were expressed with each dot representing 1 sample. n = 10–11. (A), *Cisplatin/saline+IgG versus cisplatin/saline+GDF15 antibody; #Cisplatin/saline+IgG versus cisplatin/TCMCB07+GDF15 antibody; &Cisplatin/saline+GDF15 antibody versus cisplatin/TCMCB07+GDF15 antibody. *P < 0.05; **,##,&&P < 0.01; ***P < 0.001; ****,####P < 0.0001. All data in A and B were analyzed by 2-way ANOVA, and all data in CF were analyzed by 1-way ANOVA.
Figure 11
Figure 11. TCMCB07 treatment mitigates anorexia in rats with Ward colorectal tumor following combination chemotherapy.
(A) Study design schematic. After passing the frozen tumor tissue through 2 rounds of donors, the fresh tumor tissue was s.c. implanted into Fischer (F344) female rats. Two weeks later, the tumor rats received combination chemotherapy via i.p. injection once per week for 2 cycles: irinotecan (50 mg/kg) on day 0 and day 7, and 5-FU (50 mg/kg) on day 1 and day 8. The sham control rats received s.c. sham implantation and i.p. saline injections. Additionally, all rats received s.c. injections twice (2×) daily with either saline or TCMCB07 at a dose of 3 mg/kg from day 0 to day 14. Initial and terminal body composition was measured using MRI prior to and after treatments. Food intake, body weight, and tumor volume were monitored daily from day 0 to day 15. At the end of the experiment, tissues were harvested after euthanasia. After either chemotherapy or saline and either TCMCB07 or saline treatment, (B) tumor volume change, (C) daily food intake, (D) cumulative food intake, and (E) weekly food intake were measured. All data in BD were expressed as mean ± SEM for each group, and all data in E were expressed with each dot representing 1 sample. n = 8–12. (C and D), *Tumor/chemotherapy/saline versus tumor/chemotherapy/TCMCB07; #Tumor/chemotherapy/saline versus sham/saline/saline; &Tumor/chemotherapy/TCMCB07 versus sham/saline/saline. *,#,&P < 0.05; **,##,&&P < 0.01; ***,###,&&&P < 0.001; ****,####, &&&&P < 0.0001. All data in BE were analyzed by 2-way ANOVA.
Figure 12
Figure 12. TCMCB07 treatment alleviates weight loss and tissue wasting in rats with Ward colorectal tumor following combination chemotherapy.
(A) Daily and (B) weekly body weight gain (% initial), (C) fat and (D) lean mass gain (% initial), (E) heart and (F) gastrocnemius mass (% initial body weight). All data in A were expressed as mean ± SEM for each group, and all data in BF were expressed with each dot representing 1 sample. n = 8–12. (A), *Tumor/chemotherapy/saline versus tumor/chemotherapy/TCMCB07; #Tumor/chemotherapy/saline versus sham/saline/saline; &Tumor/chemotherapy/TCMCB07 versus sham/saline/saline. *,#,&P < 0.05; **,##P < 0.01; ***,###P < 0.001; ****,####P < 0.0001. All data in A and B were analyzed by 2-way ANOVA, and all data in CF were analyzed by 1-way ANOVA.

References

    1. [No authors listed] Advancing cancer therapy. Nat Cancer. 2021;2(3):245–246. doi: 10.1038/s43018-021-00192-x. - DOI - PubMed
    1. Anand U, et al. Cancer chemotherapy and beyond: Current status, drug candidates, associated risks and progress in targeted therapeutics. Genes Dis. 2023;10(4):1367–1401. doi: 10.1016/j.gendis.2022.02.007. - DOI - PMC - PubMed
    1. Kalyanaraman B. Teaching the basics of cancer metabolism: Developing antitumor strategies by exploiting the differences between normal and cancer cell metabolism. Redox Biol. 2017;12:833–842. doi: 10.1016/j.redox.2017.04.018. - DOI - PMC - PubMed
    1. Kayl AE, Meyers CA. Side-effects of chemotherapy and quality of life in ovarian and breast cancer patients. Curr Opin Obstet Gynecol. 2006;18(1):24–28. doi: 10.1097/01.gco.0000192996.20040.24. - DOI - PubMed
    1. Moore A. Metabolic cycles in cancer cells? Bioessays. 2020;42(4):e2000048. doi: 10.1002/bies.202000048. - DOI - PubMed