. 2024 Nov 7;20(11):e1012570.
doi: 10.1371/journal.pcbi.1012570. eCollection 2024 Nov.

Beyond IC50-A computational dynamic model of drug resistance in enzyme inhibition treatment

Affiliations

Beyond IC50-A computational dynamic model of drug resistance in enzyme inhibition treatment

J Roadnight Sheehan et al. PLoS Comput Biol. .

Abstract

Resistance to therapy is a major clinical obstacle to treatment of cancer and communicable diseases. Drug selection in treatment of patients where the disease is showing resistance to therapy is often guided by IC50 or fold-IC50 values. In this work, through a model of the treatment of chronic myeloid leukaemia (CML), we contest using fold-IC50 values as a guide for treatment selection. CML is a blood cancer that is treated with Abl1 inhibitors, and is often seen as a model for targeted therapy and drug resistance. Resistance to the first-line treatment occurs in approximately one in four patients. The most common cause of resistance is mutations in the Abl1 enzyme. Different mutant Abl1 enzymes show resistance to different Abl1 inhibitors and the mechanisms that lead to resistance for various mutation and inhibitor combinations are not fully known, making the selection of Abl1 inhibitors for treatment a difficult task. We developed a model based on information of catalysis, inhibition and pharmacokinetics, and applied it to study the effect of three Abl1 inhibitors on mutants of the Abl1 enzyme. From this model, we show that the relative decrease of product formation rate (defined in this work as "inhibitory reduction prowess") is a better indicator of resistance than an examination of the size of the product formation rate or fold-IC50 values for the mutant. We also examine current ideas and practices that guide treatment choice and suggest a new parameter for selecting treatments that could increase the efficacy and thus have a positive impact on patient outcomes.


Conflict of interest statement

The authors have declared that no competing interests exist.

Figures

Fig 1
Fig 1. A cartoon of the simplified model of the Abl1 enzyme system.
The states, molecules they bind to, the transitions between states, and the rate constants for each transition are shown. The Abl1 enzyme is represented by the peach-coloured E-shape in both its active (round corners) and inactive (sharp corners) states; the inhibitor is illustrated by the dark blue T-shape (A: either imatinib or ponatinib, B: dasatinib); and the remaining shapes depict the ATP with its phosphate groups and the protein substrate that is phosphorylated. Transition arrows are accompanied by their rate constants. The rates between states will differ depending on the mutation and Abl1 inhibitor present in the system.
Fig 2
Fig 2. The enzyme states and their relative weights within the system in quasi-equilibrium.
[R] is the concentration of the inhibitory drug in the system; RDA,I is the dissociation constant of the binding of the inhibitory drug for the enzyme in either active (A) or inactive (I) state; β is the reciprocal of the product of Boltzmann’s constant and the temperature (β = 1/kBT); ΔG is the change in Gibbs free energy between the active and inactive enzymes, and it describes the preference of the unbound enzyme between the active and inactive states; [S] is the concentration of the substrates (it is assumed that ATP is in surplus relative to the substrate and its concentration is therefore not treated explicitly by the model); and KM is the Michaelis constant of the binding of the substrate to the active enzyme state.
Fig 3
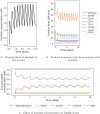
Fig 3. Various outputs from the model with the drug imatinib.
A: Imatinib concentrations over the first 10 days of daily treatment doses, calculated as outline in section 3.1.4. The imatinib concentration increases with each daily dose (absorption), then decreases (elimination). After a build up in the system the concentration reaches a steady-state phase with a consistent minimum and maximum that the concentration fluctuates between. B: The product formation rates of the wild-type and six mutant Abl1 enzymes over ten days of initial treatment with imatinib. C: Effect of Abl1 inhibitor imatintib on the enzyme states of G250E. A gradual effect as the inhibitor concentration builds up to its steady-state and the change in substrate bound enzymes from around 0.9 μM to around an average of 0.6 μM.
Fig 4
Fig 4. We define the term “inhibitory reduction prowess” (IRP) as the percentage by which the product formation rate is reduced by from the initial point before inhibitor is introduced to the system.
A low IRP indicates a resistant mutant. The bar height is the IRP obtained from the midday level of the product formation rate on day 10 and the error bars give the range from the lowest and highest product formation rates.
Fig 5
Fig 5. A heat map to compare the associated resistances outlined in Table 1 and [14] with the IRP values.
The drugs imatinib, ponatinib, and dasatinib are represented by i, p, and d, respectively. The darker grey boxes indicate which mutations and combinations of mutations are associated with resistance to that inhibitor drug. The lighter grey boxes for ponatinib indicate that those mutations are associated with resistance when in combination with other mutations.
Fig 6
Fig 6. A visual comparison of the associated resistance data from Table 1 with the values of kcat, KM, catalytic efficiency (kcat/KM), and [S]/([S] + KM) for each mutation of Ab1.
The drugs imatinib, ponatinib, and dasatinib are represented by i, p, and d, respectively. For the resistance association, the darker grey boxes indicate which mutations and combinations of mutations are associated with resistance to that inhibitor drug. The lighter grey boxes for ponatinib indicate that those mutations are associated with resistance when in combination with other mutations [14]. The colour scales for kcat, KM, catalytic efficiency, and [S]/([S] + KM) are simple gradient scales to emphasise the values visually with each column’s smallest value as the lightest colour and the largest value as the darkest.
Fig 7
Fig 7. How the variation in inhibitor concentration throughout one day affects the value of IC50/(IC50 + [R]) for different Abl1 inhibitors.
The point at which [R] = IC50 is marked with a dashed line. A: Imatinib—G250E, E255K, E255V, T315I, T315M, and Y253H and their compound mutations are expected to show resistance. *T315M and all the compound mutations have the same IC50 value and can be represented by the result for E255V-T315I. B: Ponatinib—Compound mutations including E255K, E255V, and T315I are expected to show resistance. C: Dasatinib—T315I and T315M are expected to show resistance. T315M and all compound mutations containing T315I have the same IC50 value and can be represented by the result for E255V-T315I.
Fig 8
Fig 8. Different calculated values for indication of resistance for each combination of mutant and inhibitor against IRP.
A line where IRP = 50% shows a boundary, discussed previously, below which that combination of mutation and inhibitor displays resistance. The plotted points are the midday IRP on day 10 and the error bars give the range of the IRP for day 10. The calculated values to indicate resistance for each combination of mutant and inhibitor are A: the relative IC50, as weighted by the IC50 of the WT for that Abl1 inhibitor (IC50/IC50WT); and B: the effective IC50 ratio (as IC50/(IC50 + [R])).

Similar articles

Cited by

References

    1. Hehlmann R, Berger U, and Hochhaus A. Chronic myeloid leukemia: a model for oncology. Annals of Hematology, 84(8):487–497, 2005. doi: 10.1007/s00277-005-1039-z - DOI - PubMed
    1. Zámečníkova A. Targeting the bcr–abl tyrosine kinase in chronic myeloid leukemia as a model of rational drug design in cancer. Expert Review of Hematology, 3(1):45–56, 2010. doi: 10.1586/ehm.09.66 - DOI - PubMed
    1. Sawyers CL. Chronic myeloid leukemia. New England Journal of Medicine, 340(17):1330–1340, 1999. doi: 10.1056/NEJM199904293401706 - DOI - PubMed
    1. Kang Z, Liu Y, Xu L, Long Z, Huang D, and Yang Y, et al.. The philadelphia chromosome in leukemogenesis. Chinese Journal of Cancer, 35(48), 2016. doi: 10.1186/s40880-016-0108-0 - DOI - PMC - PubMed
    1. Advani AS and Pendergast AM. The philadelphia chromosome in leukemogenesis. Chinese Journal of Cancer, 35(1):–, 2016. - PMC - PubMed

MeSH terms