. 2024 Nov 19;5(11):101799.
doi: 10.1016/j.xcrm.2024.101799. Epub 2024 Nov 6.

Multi-platform biomarkers of response to an immune checkpoint inhibitor in the neoadjuvant I-SPY 2 trial for early-stage breast cancer

Affiliations

Multi-platform biomarkers of response to an immune checkpoint inhibitor in the neoadjuvant I-SPY 2 trial for early-stage breast cancer

Michael J Campbell et al. Cell Rep Med. .

Abstract

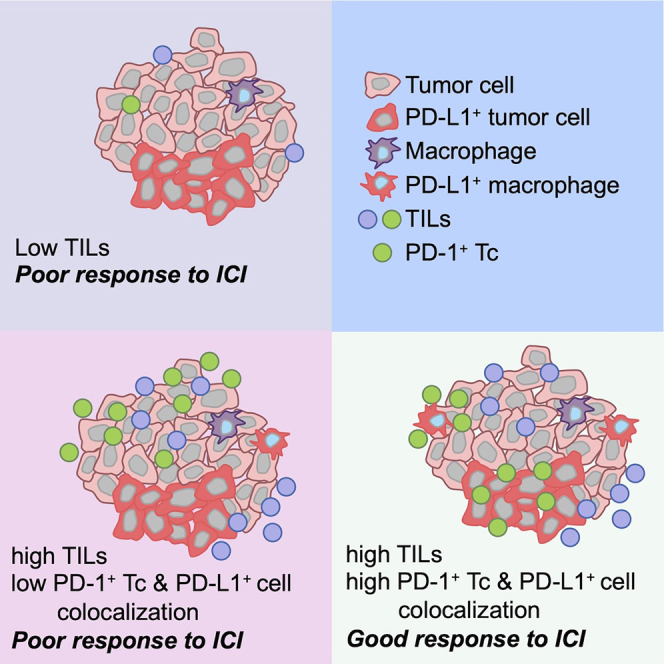
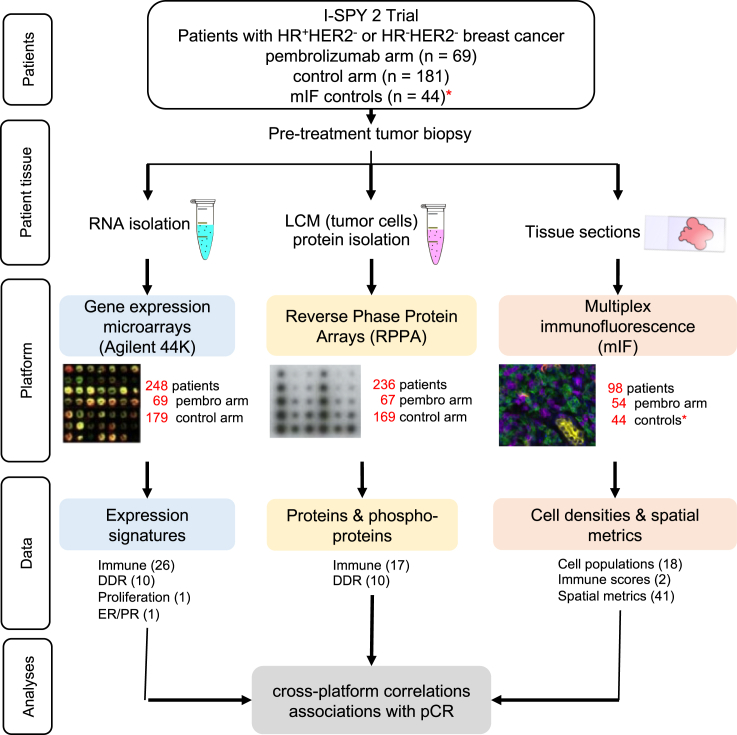
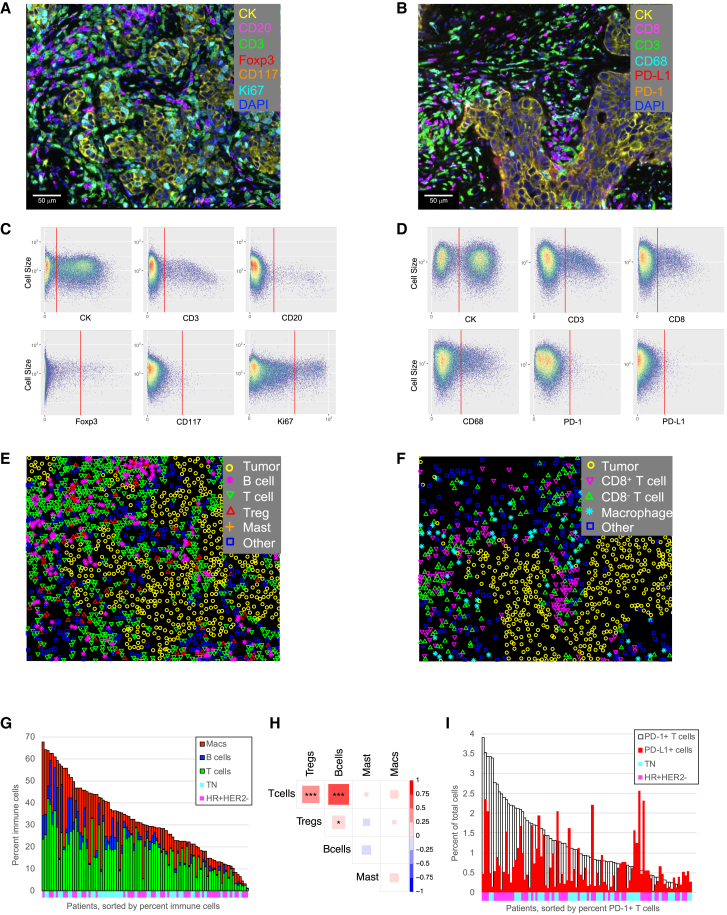
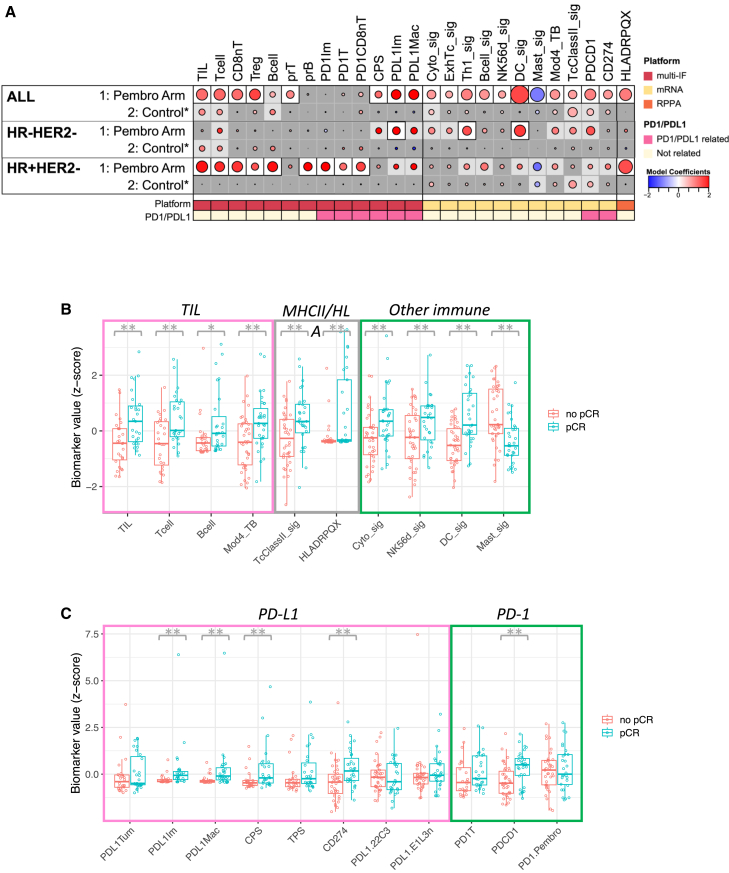
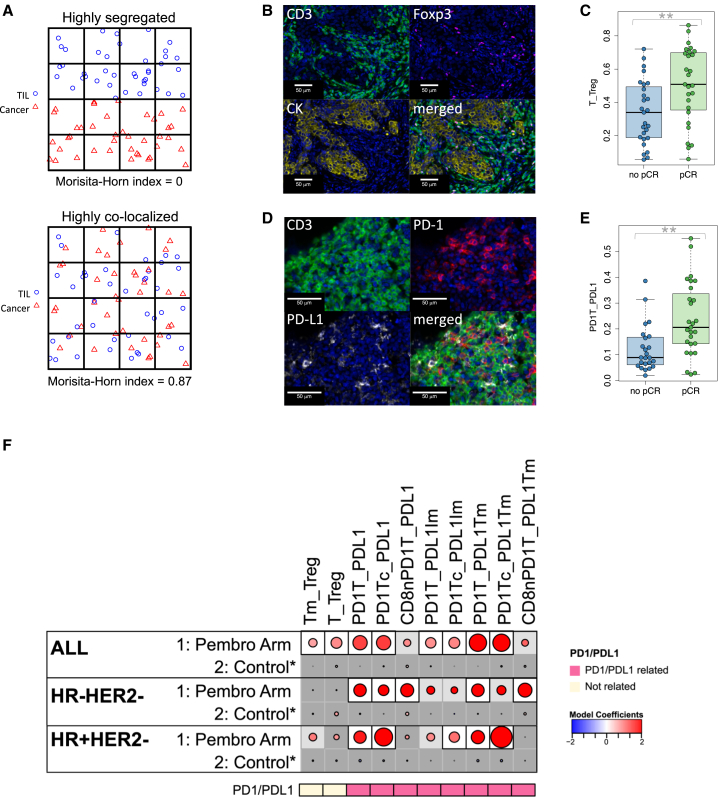
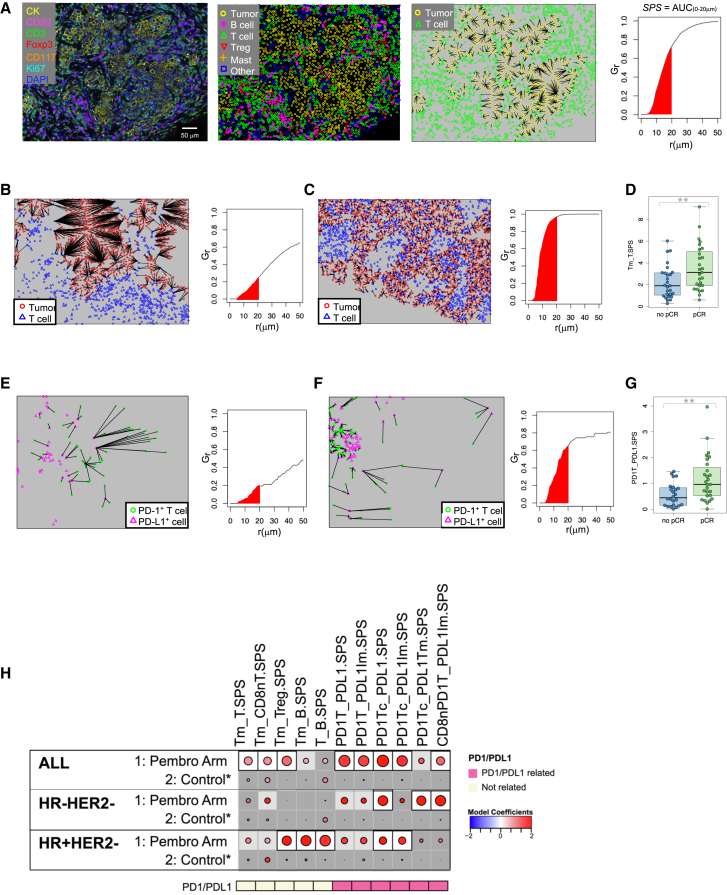
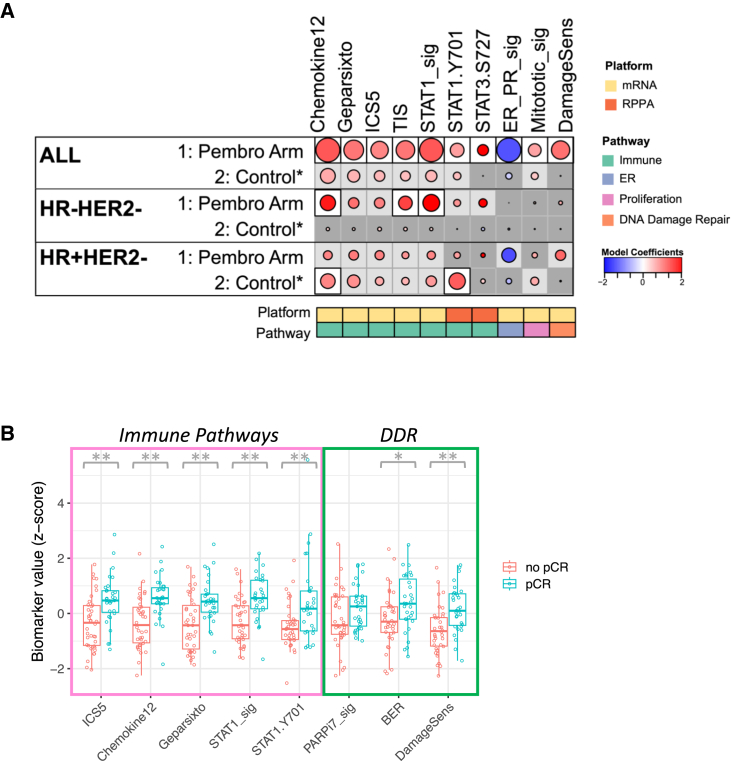
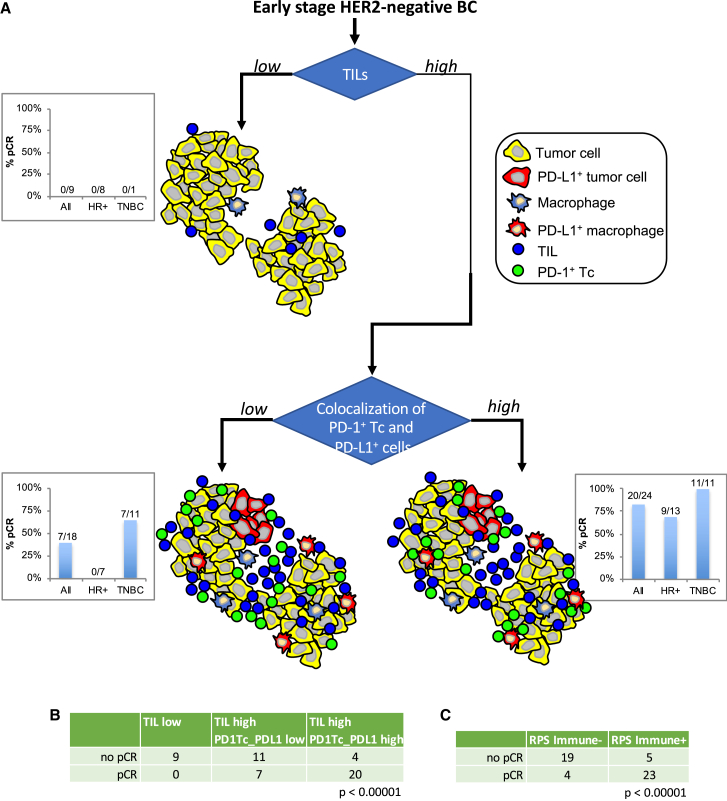
Only a subset of patients with breast cancer responds to immune checkpoint blockade (ICB). To better understand the underlying mechanisms, we analyze pretreatment biopsies from patients in the I-SPY 2 trial who receive neoadjuvant ICB using multiple platforms to profile the tumor microenvironment. A variety of immune cell populations and markers of immune/cytokine signaling associate with pathologic complete response (pCR). Interestingly, these differ by breast cancer receptor subtype. Measures of the spatial distributions of immune cells within the tumor microenvironment, in particular colocalization or close spatial proximity of PD-1+ T cells with PD-L1+ cells (immune and tumor cells), are significantly associated with response in the overall cohort as well as the in the triple negative (TN) and HR+HER2- subtypes. Our findings indicate that biomarkers associated with immune cell signaling, immune cell densities, and spatial metrics are predictive of neoadjuvant ICB efficacy in breast cancer.

Keywords: breast cancer; immune checkpoint blockade; multiplex immunofluorescence; predictive markers; spatial metrics.


Conflict of interest statement

Declaration of interests J.W. reports honoraria from DAVA Oncology; consults for Baylor College of Medicine; has ownership in Theralink; and is co-inventor of the RPPA technology, and phospho-HER2 and -EGFR response predictors with filed patents. C.H. is an employee of Akoya Biosciences. R.N. reports grants from Quantum Leap, AstraZeneca, Celgene, Corcept Therapeutics, Genentech/Roche, Immunomedics, Merck, OBI Pharma, Odonate Therapeutics, Pfizer, and Seattle Genetics outside the submitted work; and personal fees from Aduro, AstraZeneca, Athenex, Celgene, Daiichi Sankyo, G1 Therapeutics, Genentech, MacroGenics, Merck, Novartis, Pfizer, Puma, and Syndax. M.C.L. reports support from Eisai, Genentech, GRAIL, Menarini Silicon Biosystems, Merck, Novartis, Seattle Genetics, and Tesaro. D.Y. reports unrelated support from Boehringer Ingelheim. A.M.D. reports honoraria or consulting for Pfizer and Context Therapeutics and reports support from Novartis, Pfizer, Genentech, Calithera, and Menarini. L.P. reports consulting fees and honoraria for advisory board participation from Pfizer, AstraZeneca, Merck, Novartis, Bristol-Myers Squibb, GlaxoSmithKline, Genentech/Roche, Personalis, Daiichi, Natera, and Exact Sciences and institutional research funding from Seagen, GlaxoSmithKline, AstraZeneca, Merck, Pfizer, and Bristol-Myers Squibb. D.A.B. is co-owner of Berry Consultants LLC, a company that designs adaptive clinical trials (including I-SPY2). E.F.P. reports leadership, stock/ownership, consulting/advisory, and travel funds from Perthera and Ceres Nanosciences; stock and consulting/advisory for Theralink Technologies, Inc; support from Ceres Nanosciences, GlaxoSmithKline, AbbVie, Symphogen, Genentech, SpringWorks Therapeutics, and Deciphera Therapeutics; and patents/royalties from NIH and filed patents for p-HER2 and p-EGFR response predictors. L.v.V. is a co-inventor of the MammaPrint signature and a part-time employee and stockholder of Agendia NV. L.E. is an unpaid member of the board of directors of Quantum Leap Healthcare Collaborative (QLHC), has received grant support from QLHC for the I-SPY2 trial, and is on the Blue Cross/Blue Shield Medical Advisory Panel.

Figures

None
Graphical abstract
Figure 1
Figure 1
Overview of tissue collection and analyses Pretreatment tumor biopsies were processed for biomarker evaluation on three different platforms: gene expression microarrays, reverse phase protein arrays, and multiplex immunofluorescence. The number of samples analyzed under each platform is shown in red. 38 expression signatures (26 immune, 10 DDR, 1 proliferation, and 1 ER/PR), 27 RPPA biomarkers (17 immune and 10 DDR), and 61 mIF biomarkers (18 cell populations, 2 immune scores, and 41 spatial metrics) were evaluated. ∗The 44 control tissue samples acquired for mIF analyses were not from the concurrent control arm (see STAR Methods for details).
Figure 2
Figure 2
mIF analysis of immune cells in the breast cancer microenvironment (A) Example breast cancer tissue stained with mIF panel 1. Cells are pseudo-colored as indicated for the different markers. (B) Example breast cancer tissue stained with mIF panel 2. Cells are pseudo-colored as indicated for the different markers. (C) Example of auto-generated gates for each marker in mIF staining panel 1. (D) Example of auto-generated gates for each marker in mIF staining panel 2. (E) Phenotype map corresponding to the image in (A). (F) Phenotype map corresponding to the image in (B). (G) Immune cell densities across the entire cohort (n = 98 patients). Patients sorted by percentage of immune cells, colored by cell phenotype. Annotations along the x axis indicate receptor subtype (cyan: TN; magenta: HR+HER2). (H) Correlation of immune cell populations across patients (n = 98 patients). Pearson correlations, red indicates positive correlation, blue indicates negative correlation. ∗p < 0.05, ∗∗p < 0.01, ∗∗∗p < 0.001. (I) Association of PD-1+ T cell density (white bars) with PD-L1+ cell density (red bars). Patients sorted by percentage of PD-1+ T cells (n = 98 patients). Annotations along the x axis indicate receptor subtype (cyan: TN; magenta: HR+HER2). See also Table S1.
Figure 3
Figure 3
Immune biomarkers associated with response to ICB (A) Association dot matrix showing the level and direction of association between each immune predictive biomarker (columns) and pCR in the population/model as labeled (rows). Only those biomarkers that were significant (p < 0.05; after Benjamini-Hochberg multiple testing correction) in at least one cohort are shown. ALL, Pembro Arm, multi-IF platform (n = 54 patients); ALL, Pembro Arm, mRNA platform (n = 69 patients); ALL, Pembro Arm, RPPA platform (n = 67 patients); ALL, Control, multi-IF platform (n = 44 patients); ALL, Control, mRNA platform (n = 179 patients); ALL, Control, RPPA platform (n = 169 patients); HR−HER2−, Pembro Arm, multi-IF platform (n = 24 patients); HR−HER2−, Pembro Arm, mRNA platform (n = 29 patients); HR−HER2−, Pembro Arm, RPPA platform (n = 27 patients); HR−HER2−, Control, multi-IF platform (n = 23 patients); HR−HER2−, Control, mRNA platform (n = 85 patients); HR−HER2−, Control, RPPA platform (n = 78 patients); HR+ HER2−, Pembro Arm, multi-IF platform (n = 30 patients); HR+ HER2, Pembro Arm, mRNA platform (n = 40 patients); HR+ HER2−, Pembro Arm, RPPA platform (n = 40 patients); HR+ HER2−, Control, multi-IF platform (n = 21 patients); HR+ HER2−, Control, mRNA platform (n = 94 patients); HR+ HER2−, Control, RPPA platform (n = 91 patients). Color of dot indicates direction of association (red, higher in pCR; blue, higher in non-pCR). Size of dot is proportional to significance (larger dots → smaller p values). Background square color indicates BH false discovery rate [FDR] p < 0.05 (white), nominal p < 0.05 (light gray), not significant (dark gray). (B) Boxplots illustrating the associations of various biomarkers related to TILs, MHC class II, and other immune cell types with pCR in the Pembro arm. The data are depicted as individual dots for each sample, along with the median, first, and third quartile. Statistical analysis was performed using the likelihood-ratio test. ∗p < 0.05 (not corrected), ∗∗p < 0.05 (BH corrected). (C) Boxplots illustrating the associations of various biomarkers related to PD-L1 and PD-1 expression with pCR in the Pembro arm. The data are depicted as individual dots for each sample, along with the median, first, and third quartile. Statistical analysis was performed using the likelihood-ratio test. ∗∗p < 0.05 (BH corrected). See also Figure S3 and Tables S2, S3, S4, S5, and S6.
Figure 4
Figure 4
Colocalization of cells in the tumor microenvironment is associated with response to ICB (A) Schematic representation of a tumor in which TILs are highly segregated away from tumor cells, yielding a low MH index (upper), and a tumor in which TILs are highly colocalized with tumor cells, yielding a high MH index (lower). (B) Example images from a tumor with high colocalization of CD3+Foxp3- T cells and CD3+Foxp3+ Tregs. (C) Boxplot illustrating significantly higher MH index scores for colocalization of T cells with Tregs (T_Treg) in patients who achieved a pCR. The data are depicted as individual dots for each sample, along with the median, first, and third quartile (n = 54 patients). Statistical analysis was performed using the likelihood-ratio test. ∗∗p < 0.05 (BH corrected). (D) Example images from a tumor with high colocalization of CD3+PD-1+ T cells and PD-L1+ cells. (E) Boxplot illustrating significantly higher MH index scores for colocalization of PD-1+ T cells with any PD-L1+ cell (PD1T_PDL1) in patients who achieved a pCR. The data are depicted as individual dots for each sample, along with the median, first, and third quartile (n = 54 patients). Statistical analysis was performed using the likelihood-ratio test. ∗∗p < 0.05 (BH corrected). (F) Association dot matrix showing the level and direction of association between each MH index (columns) and pCR in the population/model as labeled (rows). Only those biomarkers that were significant (p < 0.05; after Benjamini-Hochberg multiple testing correction) in at least one cohort are shown. See Figure 3 legend for number of patients in each cohort (multi-IF platform). Color of dot indicates direction of association (red, higher in pCR; blue, higher in non-pCR). Size of dot is proportional to significance (larger dots → smaller p values). Background square color indicates: BH FDR p < 0.05 (white), nominal p < 0.05 (light gray), not significant (dark gray). See also Figure S4 and Tables S4 and S5.
Figure 5
Figure 5
Spatial proximity of cells in the tumor microenvironment is associated with response to ICB (A) Example of a tumor stained with mIF panel 1, the corresponding phenotype map, and a nearest-neighbor plot in which lines are drawn from each tumor cell (yellow) to the nearest T cell (green). A plot of G(r), the fraction of tumor cells with a T cell with a radius r, by r (μm) is shown. A spatial proximity score (SPS) is calculated from the area under this curve where r = 0 to 20 μm (red shaded area). (B) Nearest-neighbor plot in which lines are drawn from each tumor cell (red) to the nearest T cell (blue) and associated G(r) plot from a tumor with a low tumor-to-T cell spatial proximity score (Tm_T.SPS). (C) Nearest-neighbor plot in which lines are drawn from each tumor cell (red) to the nearest T cell (blue) and associated G(r) plot from a tumor with a high tumor-to-T cell spatial proximity score (Tm_T.SPS). (D) Boxplot illustrating significantly higher Tm_T.SPS in patients who achieved a pCR. The data are depicted as individual dots for each sample, along with the median, first, and third quartile (n = 54 patients). Statistical analysis was performed using the likelihood-ratio test. ∗∗p < 0.05 (BH corrected). (E) Nearest-neighbor plot in which lines are drawn from each PD-1+ T cell (green) to the nearest PD-L1+ cell (magenta) and associated G(r) plot from a tumor with a low PD-1+ T cell to PD-L1+ cell spatial proximity score (PD1T_PDL1.SPS). (F) Nearest-neighbor plot in which lines are drawn from each PD-1+ T cell (green) to the nearest PD-L1+ cell (magenta) and associated G(r) plot from a tumor with a high PD-1+ T cell to PD-L1+ cell spatial proximity score (PD1T_PDL1.SPS). (G) Boxplot illustrating significantly higher PD1T_PDL1.SPS in patients who achieved a pCR. The data are depicted as individual dots for each sample, along with the median, first, and third quartile (n = 54 patients). Statistical analysis was performed using the likelihood-ratio test. ∗∗p < 0.05 (BH corrected). (H) Association dot matrix showing the level and direction of association between spatial proximity scores (columns) and pCR in the population/model as labeled (rows). Only those biomarkers that were significant (p < 0.05; after Benjamini-Hochberg multiple testing correction) in at least one cohort are shown. See Figure 3 legend for number of patients in each cohort (multi-IF platform). Color of dot indicates direction of association (red, higher in pCR; blue, higher in non-pCR). Size of dot is proportional to significance (larger dots → smaller p values). Background square color indicates: BH FDR p < 0.05 (white), nominal p < 0.05 (light gray), not significant (dark gray). See also Figure S5 and Tables S4 and S5.
Figure 6
Figure 6
Immune signaling pathways and DNA damage and repair biomarkers associated with response to ICB (A) Association dot matrix showing the level and direction of association between gene expression and RPPA biomarkers (columns) and pCR in the population/model as labeled (rows). Only those biomarkers that were significant (p < 0.05; after Benjamini-Hochberg multiple testing correction) in at least one cohort are shown. See Figure 3 legend for number of patients in each cohort (mRNA and RPPA platforms). Color of dot indicates direction of association (red, higher in pCR; blue, higher in non-pCR). Size of dot is proportional to significance (larger dots → smaller p values). Background square color indicates: BH FDR p < 0.05 (white), nominal p < 0.05 (light gray), not significant (dark gray). (B) Boxplots illustrating the associations of various biomarkers related to immune pathways and DNA damage/repair with pCR in the Pembro arm. The data are depicted as individual dots for each sample, along with the median, first, and third quartile. Statistical analysis was performed using the likelihood-ratio test. ∗p < 0.05 (not corrected), ∗∗p < 0.05 (BH corrected). See also Figures S6 and S7 and Tables S2, S3, S4, S5, and S6.
Figure 7
Figure 7
Illustration of different tumor immune microenvironments as characterized by mIF and their associated pCR rates, overall and by receptor subtypes (A) TILs were defined as CD3+ T cells plus CD20+ B cells. The cut-point for low/high TILs was set at 12.5% (percent of total cell counts). Colocalization of PD-1+Tc and PD-L1+ cells (immune or tumor) was defined using the Morisita-Horn index. A median cut-point was used to define low/high colocalization scores. Bar graphs indicate pCR rates for the Pembro arm, all cases or split out by receptor subtypes, for each of the depicted immune microenvironments: low TILs, high TILs, high TILs & low colocalization score, high TILs & high colocalization score. (B) Immune microenvironments defined by percent TILs and colocalization of PD-1+Tc with PD-L1+ cells (immune or tumor) are significantly associated with response (Fisher exact test). (C) Immune microenvironments defined by immune response predictive subtype (RPS) are significantly associated with response (Fisher exact test).

References

    1. Burtness B., Harrington K.J., Greil R., Soulières D., Tahara M., de Castro G., Psyrri A., Basté N., Neupane P., Bratland Å., et al. Pembrolizumab alone or with chemotherapy versus cetuximab with chemotherapy for recurrent or metastatic squamous cell carcinoma of the head and neck (KEYNOTE-048): a randomised, open-label, phase 3 study. Lancet. 2019;394:1915–1928. doi: 10.1016/S0140-6736(19)32591-7. - DOI - PubMed
    1. Larkin J., Chiarion-Sileni V., Gonzalez R., Grob J.-J., Rutkowski P., Lao C.D., Cowey C.L., Schadendorf D., Wagstaff J., Dummer R., et al. Five-Year Survival with Combined Nivolumab and Ipilimumab in Advanced Melanoma. N. Engl. J. Med. 2019;381:1535–1546. doi: 10.1056/NEJMoa1910836. - DOI - PubMed
    1. Motzer R.J., Tannir N.M., McDermott D.F., Arén Frontera O., Melichar B., Choueiri T.K., Plimack E.R., Barthélémy P., Porta C., George S., et al. Nivolumab plus Ipilimumab versus Sunitinib in Advanced Renal-Cell Carcinoma. N. Engl. J. Med. 2018;378:1277–1290. doi: 10.1056/NEJMoa1712126. - DOI - PMC - PubMed
    1. Reck M., Rodríguez-Abreu D., Robinson A.G., Hui R., Csőszi T., Fülöp A., Gottfried M., Peled N., Tafreshi A., Cuffe S., et al. Pembrolizumab versus Chemotherapy for PD-L1-Positive Non-Small-Cell Lung Cancer. N. Engl. J. Med. 2016;375:1823–1833. doi: 10.1056/NEJMoa1606774. - DOI - PubMed
    1. Schmid P., Cortes J., Pusztai L., McArthur H., Kümmel S., Bergh J., Denkert C., Park Y.H., Hui R., Harbeck N., et al. Pembrolizumab for Early Triple-Negative Breast Cancer. N. Engl. J. Med. 2020;382:810–821. doi: 10.1056/NEJMoa1910549. - DOI - PubMed

MeSH terms