. 2025 Jan 1;328(1):C199-C211.
doi: 10.1152/ajpcell.00528.2024. Epub 2024 Nov 7.

Convergent and divergent immune aberrations in COVID-19, post-COVID-19-interstitial lung disease, and idiopathic pulmonary fibrosis

Affiliations

Convergent and divergent immune aberrations in COVID-19, post-COVID-19-interstitial lung disease, and idiopathic pulmonary fibrosis

Bochra Tourki et al. Am J Physiol Cell Physiol. .

Abstract

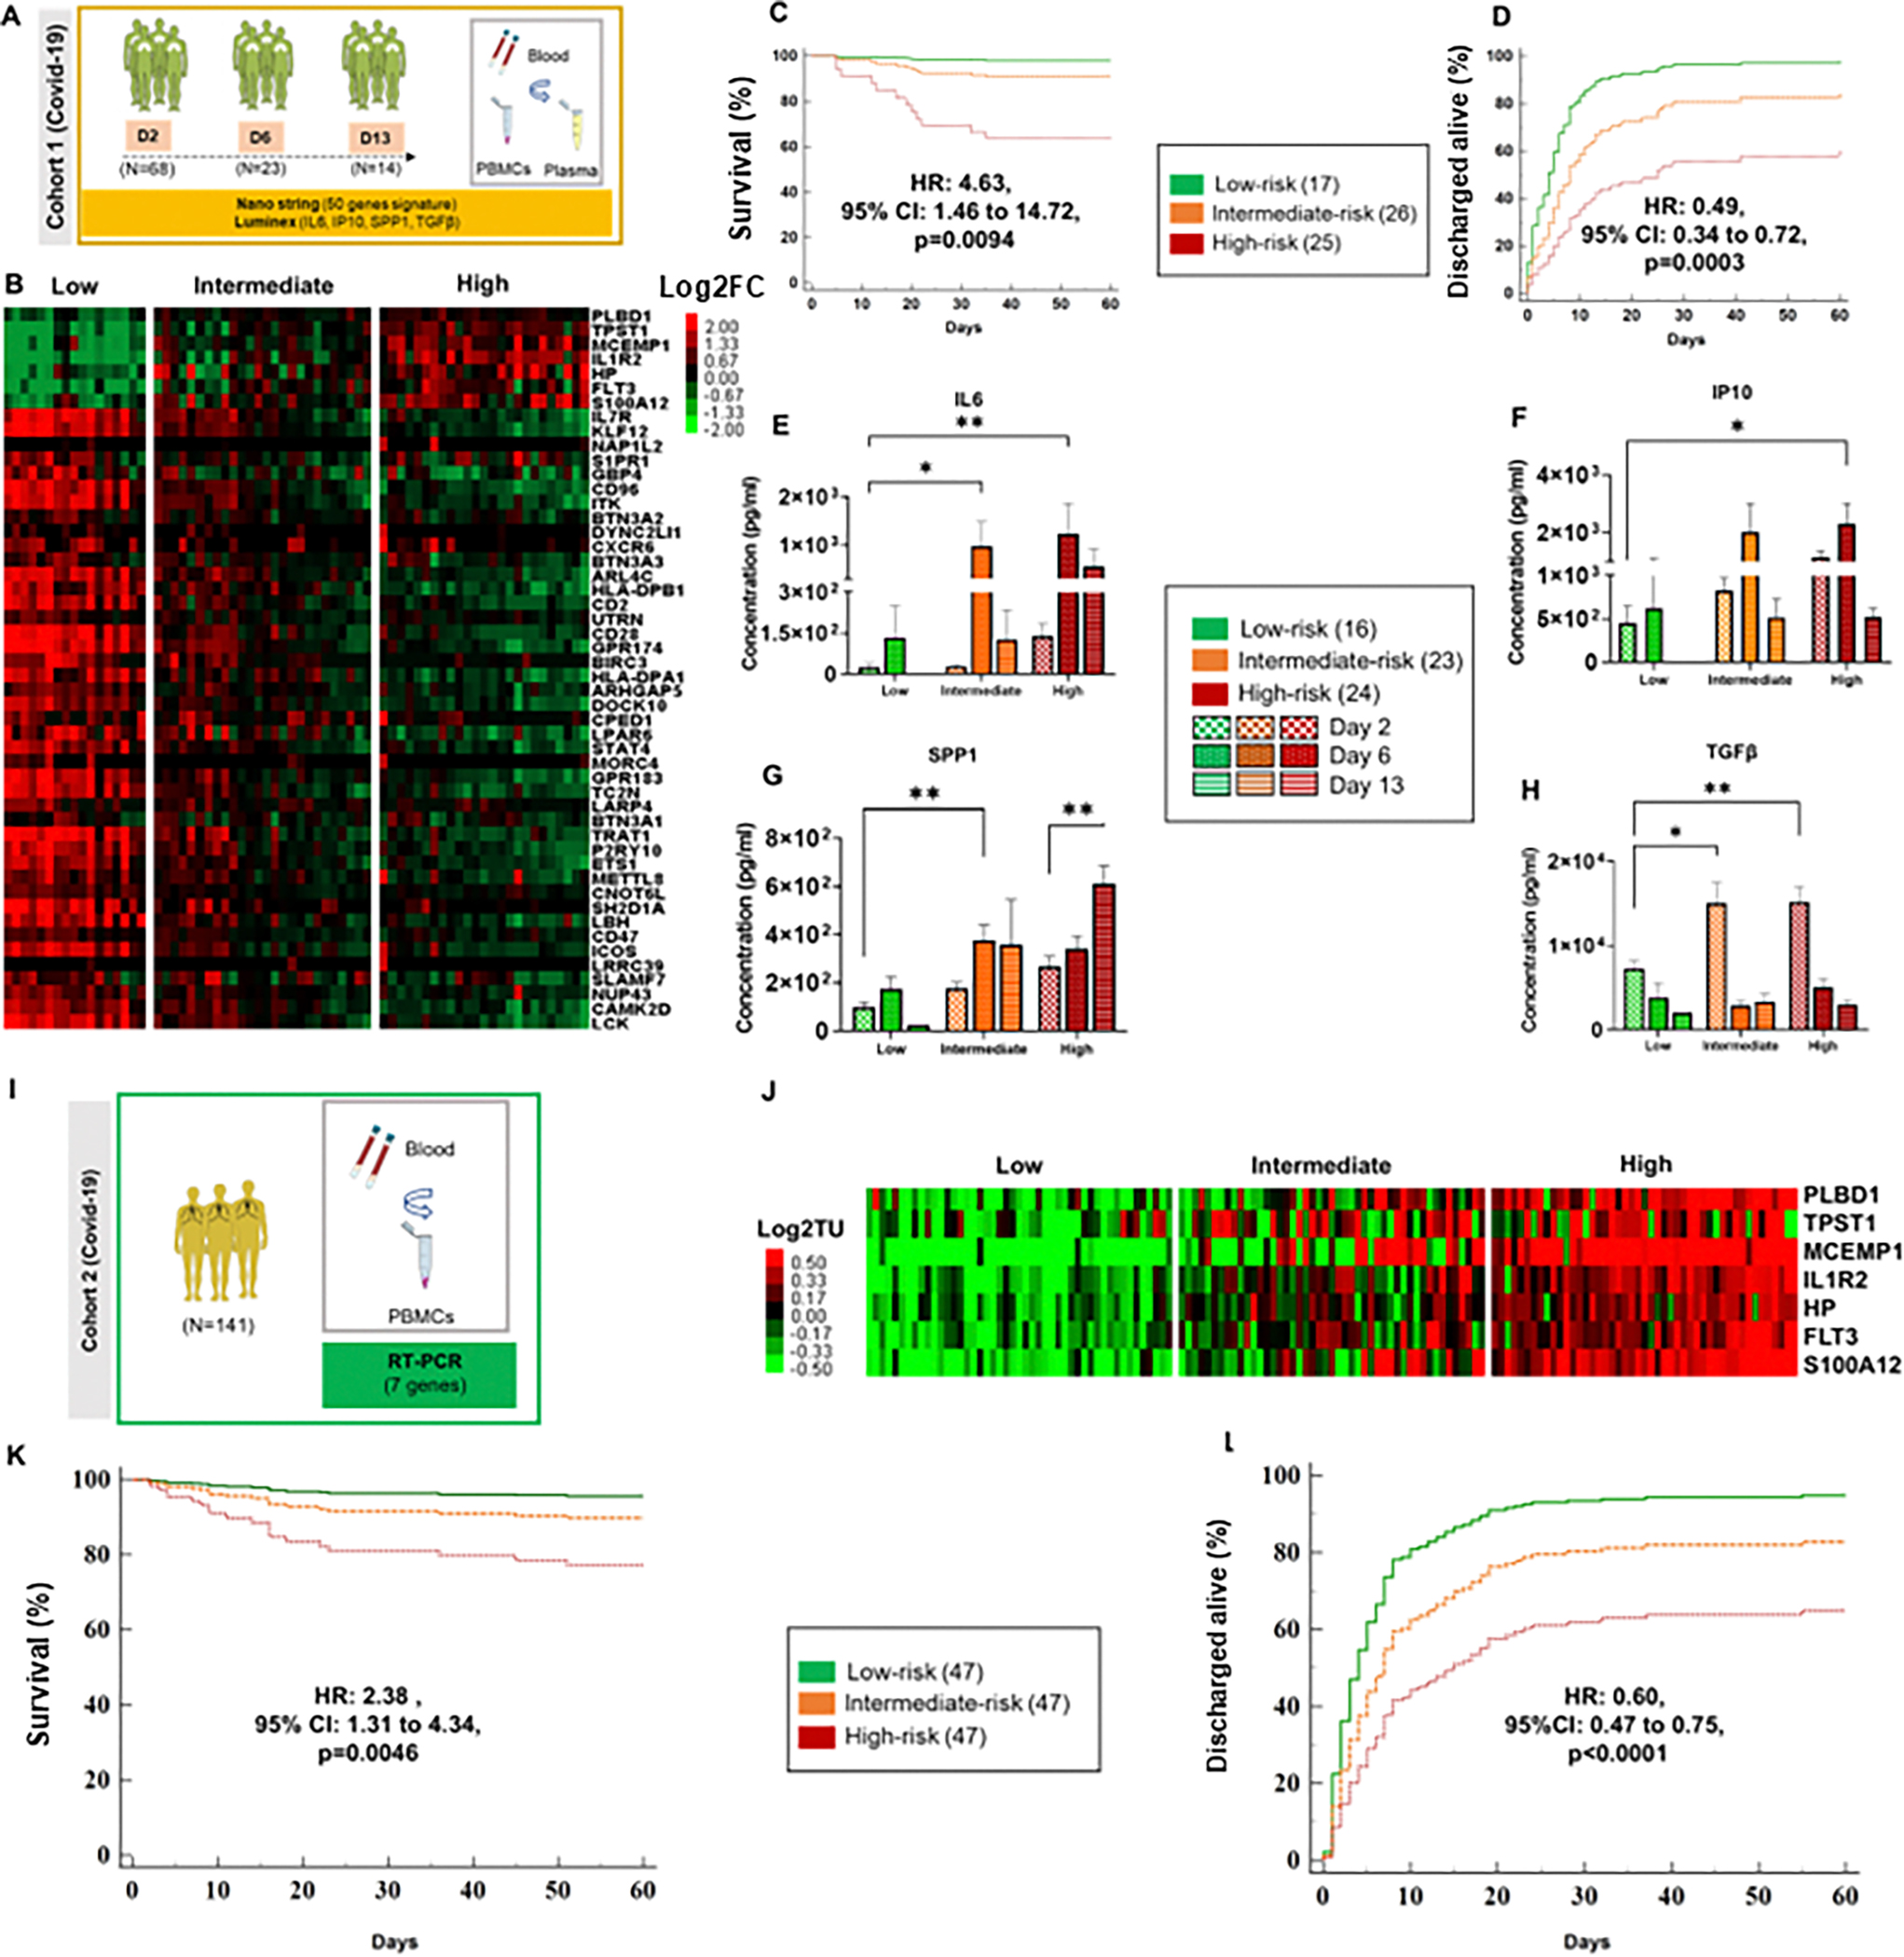
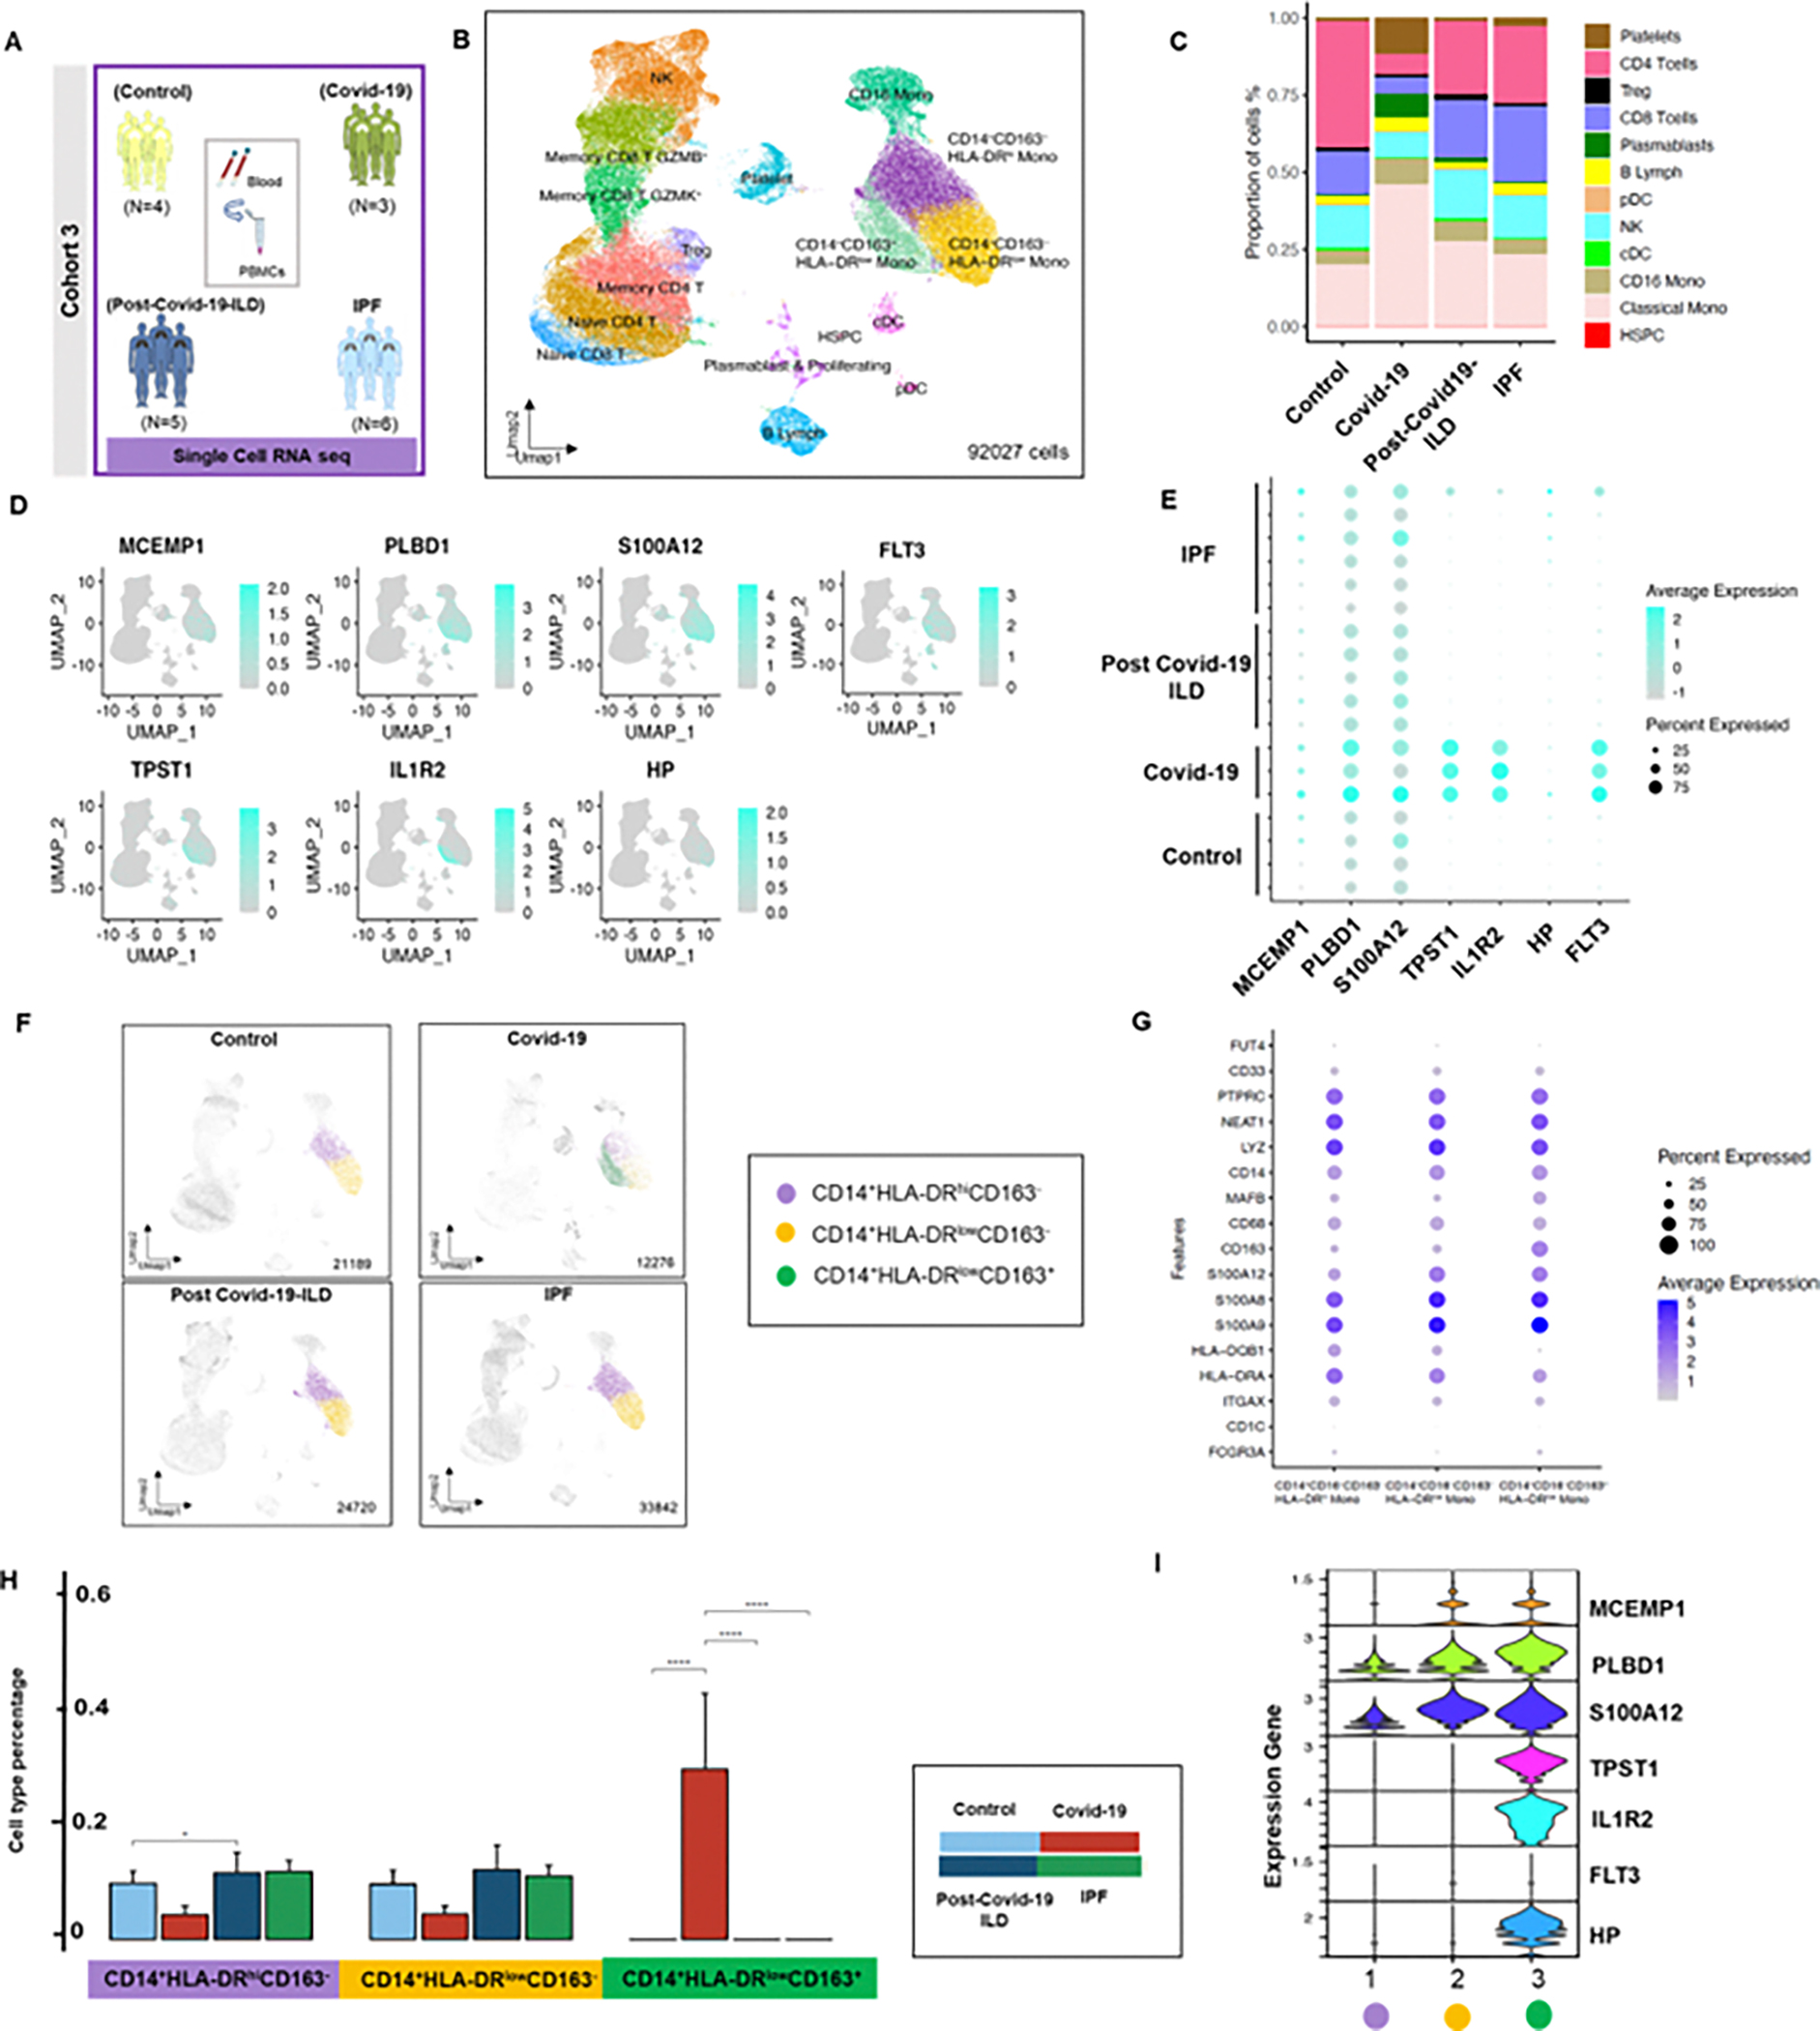
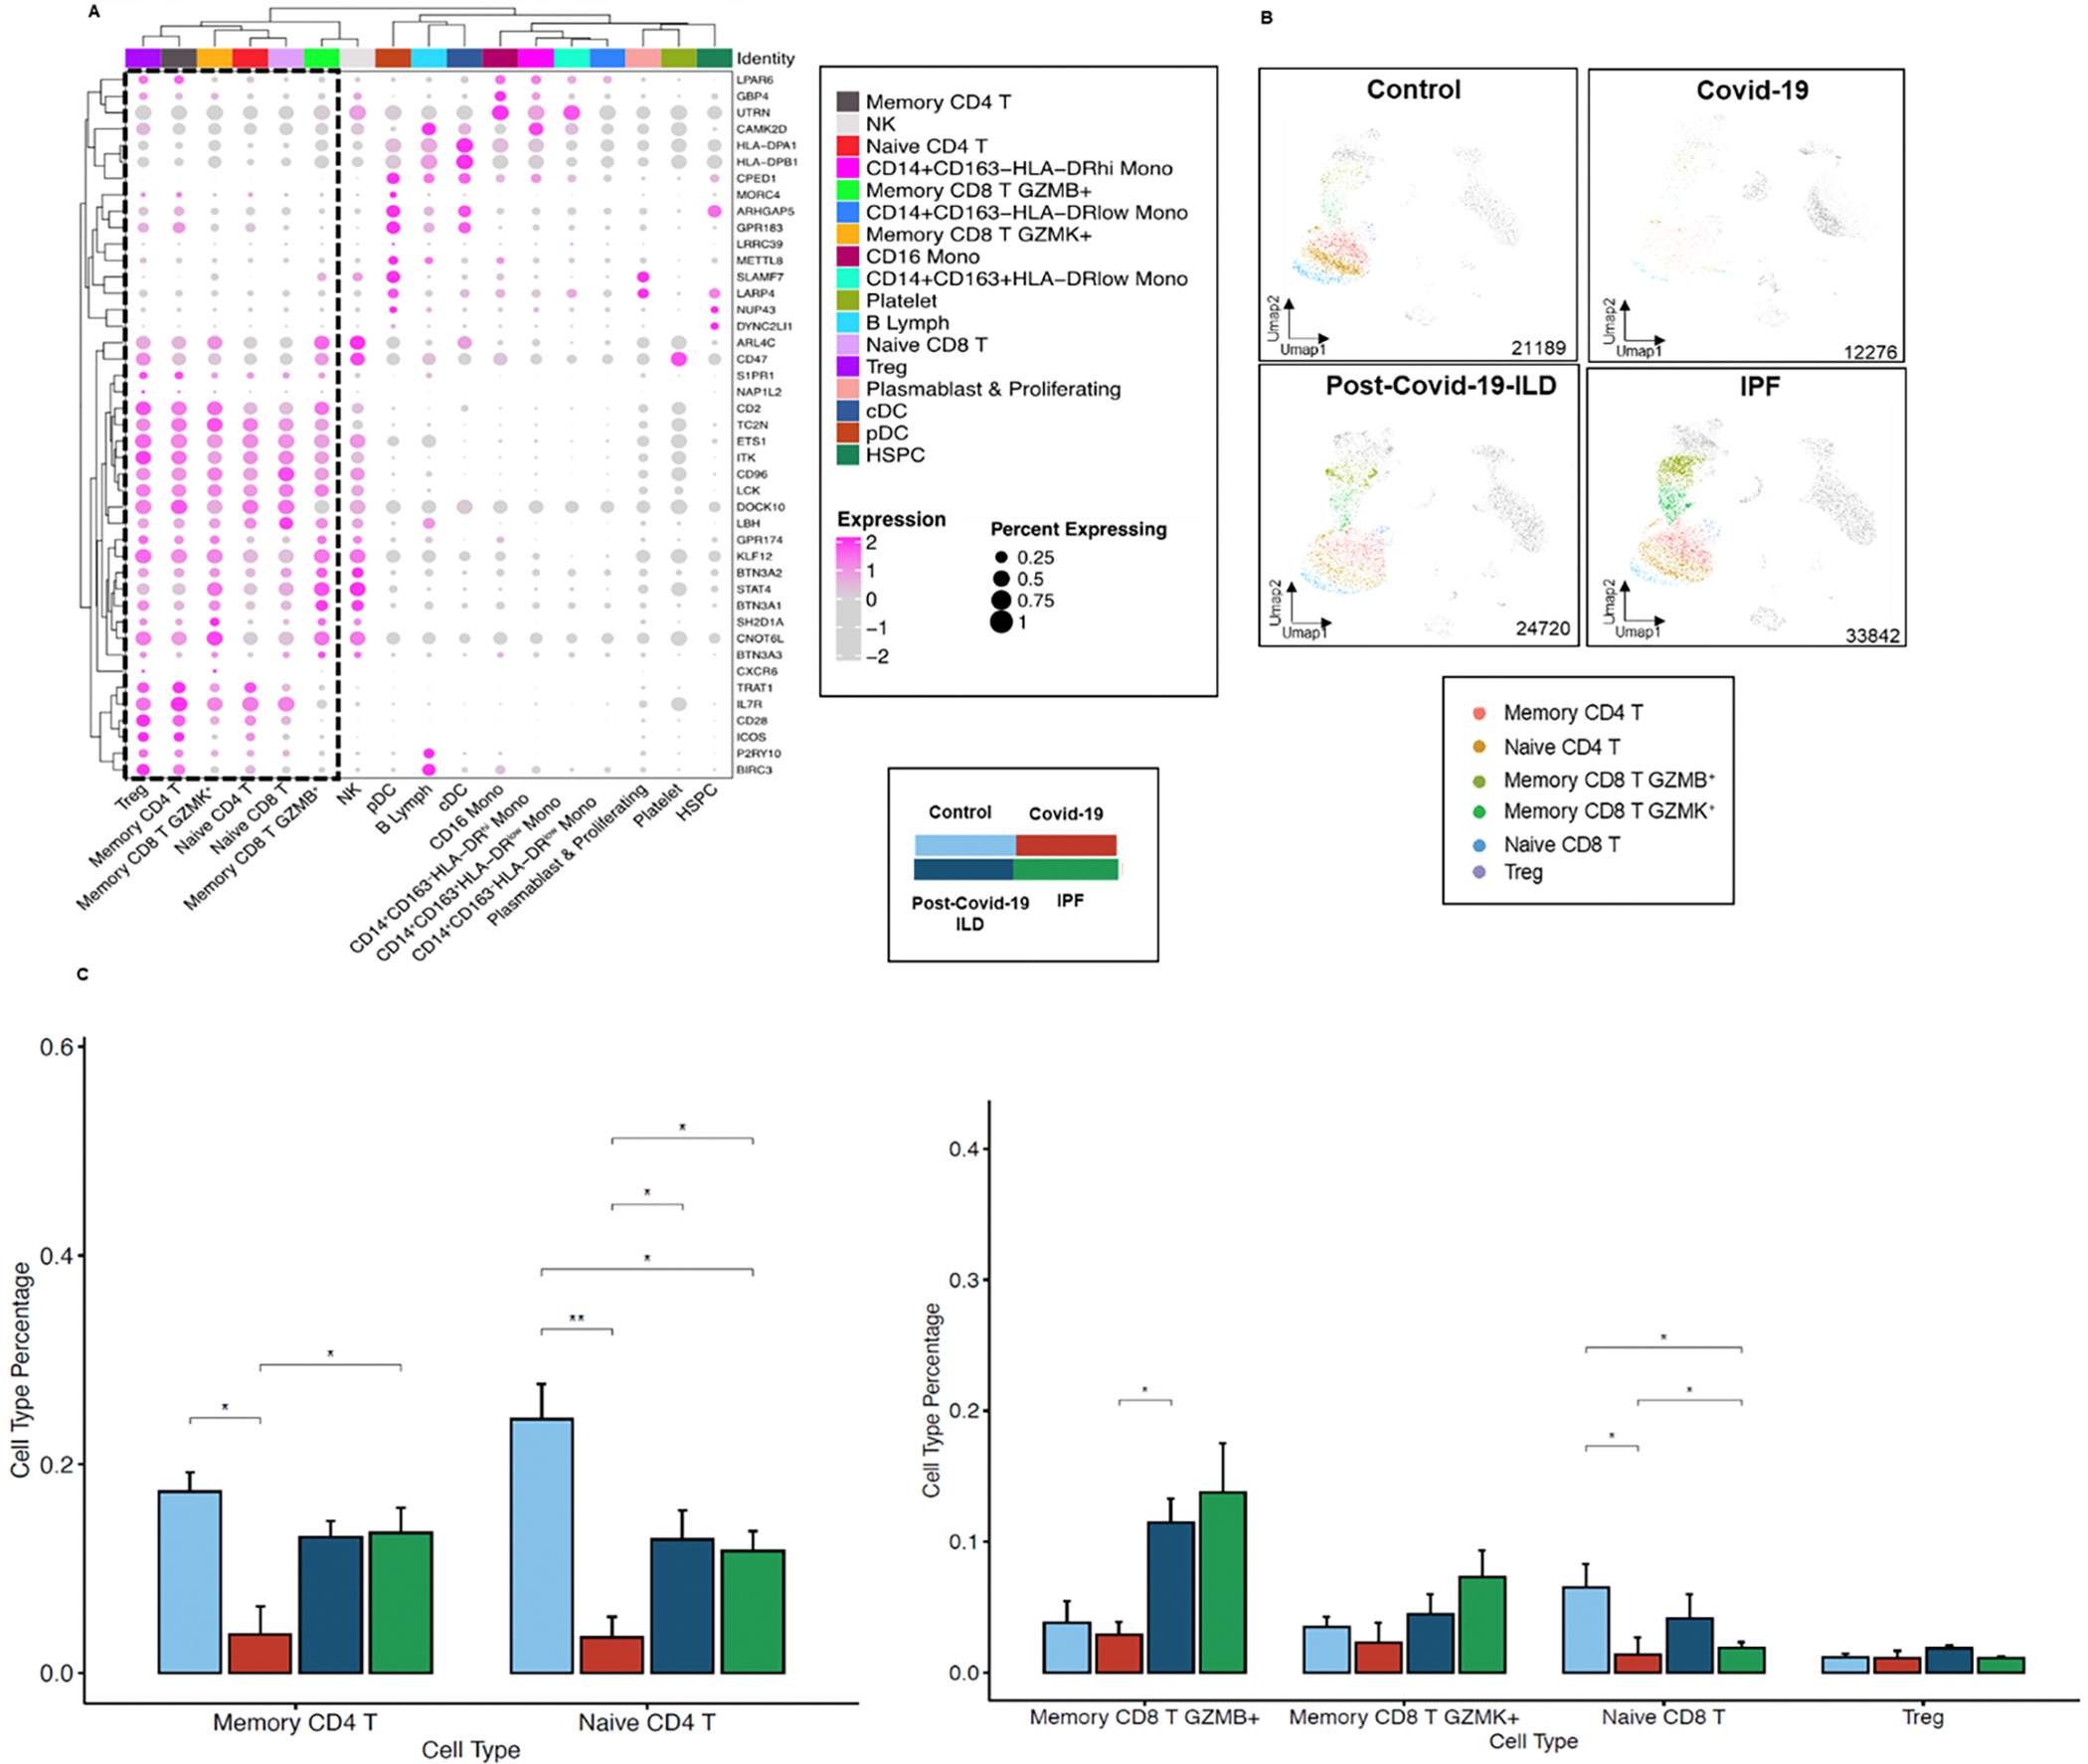
We aimed to study transcriptional and phenotypic changes in circulating immune cells associated with increased risk of mortality in COVID-19, resolution of pulmonary fibrosis in post-COVID-19-interstitial lung disease (ILD), and persistence of idiopathic pulmonary fibrosis (IPF). Whole blood and peripheral blood mononuclear cells (PBMCs) were obtained from 227 subjects with COVID-19, post-COVID-19 interstitial lung disease (ILD), IPF, and controls. We measured a 50-gene signature (nCounter, Nanostring) previously found to be predictive of IPF and COVID-19 mortality along with plasma levels of several biomarkers by Luminex. In addition, we performed single-cell RNA sequencing (scRNA-seq) in PBMCs (10x Genomics) to determine the cellular source of the 50-gene signature. We identified the presence of three genomic risk profiles in COVID-19 based on the 50-gene signature associated with low-, intermediate-, or high-risk of mortality and with significant differences in proinflammatory and profibrotic cytokines. Patients with COVID-19 in the high-risk group had increased expression of seven genes in CD14+HLA-DRlowCD163+ monocytic-myeloid-derived suppressive cells (7Gene-M-MDSCs) and decreased expression of 43 genes in CD4 and CD8 T cell subsets. The loss of 7Gene-M-MDSCs and increased expression of these 43 genes in T cells was seen in survivors with post-COVID-19-ILD. On the contrary, patients with IPF had low expression of the 43 genes in CD4 and CD8 T cells. Collectively, we showed that a 50-gene, high-risk profile, predictive of IPF and COVID-19 mortality is characterized by a genomic imbalance in monocyte and T-cell subsets. This imbalance reverses in survivors with post-COVID-19-ILD highlighting genomic differences between post-COVID-19-ILD and IPF.NEW & NOTEWORTHY Changes in the 50-gene signature, reflective of increase in CD14+HLA-DRlowCD163+ monocytes and decrease in CD4 and CD8 T cells, are associated with increased mortality in COVID-19. A reversal of this pattern can be seen in post-COVID-19-ILD, whereas its persistence can be seen in IPF. Modulating the imbalance between HLA-DRlow monocytes and T cell subsets should be investigated as a potential strategy to treat pulmonary fibrosis associated with severe COVID-19 and progressive IPF.

Keywords: 50-gene signature; 7Gene-M-MDSCs; COVID-19; IPF; post-COVID-19-ILD.


Conflict of interest statement

Conflict of interest: The authors declare no competing financial interests.

Figures

Figure 1.
Figure 1.. A high-risk genomic profile is associated with increased mortality and increased time to discharge in two independent COVID-19 cohorts.
A. Study design of the 50-gene signature and cytokine analysis in COVID-19 patients (Cohort 1). B. Heatmap of COVID-19 patients based on the 50-gene signature discriminates three risk groups (low, intermediate, and high) based on SAMS. Every column represents a patient, and every row represents a gene. Log-based two-color scale is adjacent to the heatmap. Red denotes increased expression and green denotes decreased expression. Gene expression data is represented as Log2FC normalized expression values. C-D. Time to death and time to discharge by day 60 in hospitalized patients with COVID-19, respectively. E-H. Plasma cytokine concentrations (IL6, IP-10, SPP1 and TGFβ) in low, intermediate, and high-risk profile patients with COVID-19 at days 2, 6 and 13 post admission. The data is presented as an average of triplicate values ± SEM for each group. Two-way ANOVA test (GraphPad software) Tukey’s multiple comparisons were used; * p<0.05. I. Study design of 7-gene signature analysis by RT-qPCR in PBMCs from COVID-19 patients (Cohort 2). J. Heatmap of COVID-19 patients based on the 50-gene signature discriminates three risk groups (low, intermediate, and high) based on SAMS Up scores. Heatmap nomenclature is the same as in Figure 1B. K-L. Time to death and time to discharge by day 60 in hospitalized patients with COVID-19 respectively in cohort two. The data is presented as an average of triplicated Log2TUs values ± SEM for each group. * p<0.05
Figure 2.
Figure 2.. Increased expression of seven genes associated with increased risk of mortality in COVID-19 can be identified in a novel subtype of Monocytic-Myeloid Derived Suppressive Cells.
A. Study design of scRNA-seq in cohort three. B. Uniform manifold approximation and projection (UMAP) embedding plots of 92027 single-cells of the four studied conditions: controls, COVID-19, post-COVID-19-ILD and IPF patients, showing the cellular landscape with cluster-colored annotations. C. Stacked bar graph of cell count percentage of immune cells in each condition. D. Aggregated UMAPs of the four studied conditions projecting the major expression of each gene of the 7-gene signature: MCEMP1, PLBD1, S100A12, FLT3, TPST1, IL1R2, HP on immune cells (aqua blue color). E. Dot plot of seven high-risk genes across controls, COVID-19, post-COVID-19-ILD and IPF. F. UMAPs of 21189 cells from four controls patients, 12276 cells from three COVID-19, 24720 cells from five post-COVID-19 and 33842 from six IPF patients were analyzed and integrated in four separate UMAPs to represent three monocyte subpopulations, grouped in a color-coded manner. G. Dot plots comparing expression of 15 selected markers for clustering classical monocytes populations (CD14+CD16). Dot size is proportional to the percentage of cells expressing the gene in each subcluster. Color intensity is proportional to the average scaled log2-normalized expression within the subcluster. H. Bar graphs of cell percentages in the three classical monocyte subpopulations identified (CD14+CD16) HLA-DRhiCD163, HLA-DRlowCD163 and HLA-DRlowCD163+, stratified by conditions. I. Violin plot presenting the expression of the aforementioned seven genes in the three classical monocyte subgroups identified in panel H. Data are presented scale/log normalized as average expression of all cells within a given group. The propeller method and T test were used to compare cell frequencies in each group. * p < 0.05, ** p < 0.01, *** p< 0.001, and **** p < 0.0001.
Figure 3.
Figure 3.. CD4 T and CD8 T cell subsets are the main source of the 43-gene signature.
A. Clustered dot plot of the 43 genes signature in all aggregated groups (controls, COVID-19, post-COVID-19-ILD and IPF patients) in each identified cell cluster. B. Separate UMAPs representing T immune cells subpopulations distributions in controls, COVID-19, post-COVID-19-ILD and IPF patients in a color-coded manner. Data are presented scale/log normalized as average expression of all cells within a given group. C. Bar graphs of T-cell subset percentages stratified per conditions. The propeller method and T test were used to compare cell frequencies in each group. * p < 0.05, ** p < 0.01, *** p< 0.001, and **** p < 0.0001
Figure 4.
Figure 4.. Resurgence of the 43-gene signature in survivors with post-COVID-19-ILD.
Dot plot of genes of the 43 gene signature in Tregs (Panel A), memory CD4 T cells (Panel B), memory CD8 T GZMK+ (Panel C), naive CD4 T (Panel D), naive CD8 T (Panel E) and memory CD8 T GZMB+ cells (Panel F), respectively. Dot size is proportional to the percentage of cells expressing the gene in each subcluster. Color intensity is proportional to the average scaled, log-normalized expression within the disease group. Data are represented as average of log2. Log-based two-color scale is adjacent to the dot-plots.

References

    1. Guan W-j Ni Z-y, Hu Y Liang W-h, Ou C-q He J-x, et al. Clinical Characteristics of Coronavirus Disease 2019 in China. New England Journal of Medicine. 2020. - PMC - PubMed
    1. Thomas SJ, Moreira ED Jr., Kitchin N, Absalon J, Gurtman A, Lockhart S, et al. Safety and Efficacy of the BNT162b2 mRNA Covid-19 Vaccine through 6 Months. N Engl J Med. 2021;385(19):1761–73. - PMC - PubMed
    1. Karampitsakos T, Sotiropoulou V, Katsaras M, Tsiri P, Georgakopoulou VE, Papanikolaou IC, et al. Post-COVID-19 interstitial lung disease: Insights from a machine learning radiographic model. Front Med (Lausanne). 2022;9:1083264. - PMC - PubMed
    1. Ntatsoulis K, Karampitsakos T, Tsitoura E, Stylianaki EA, Matralis AN, Tzouvelekis A, et al. Commonalities Between ARDS, Pulmonary Fibrosis and COVID-19: The Potential of Autotaxin as a Therapeutic Target. Front Immunol. 2021;12:687397. - PMC - PubMed
    1. Grillo F, Barisione E, Ball L, Mastracci L, Fiocca R. Lung fibrosis: an undervalued finding in COVID-19 pathological series. Lancet Infect Dis. 2021;21(4):e72. - PMC - PubMed

MeSH terms

LinkOut - more resources