. 2024 Dec;300(12):107966.
doi: 10.1016/j.jbc.2024.107966. Epub 2024 Nov 5.

Mechanisms of amphibian arrestin 1 self-association and dynamic distribution in retinal photoreceptors

Affiliations

Mechanisms of amphibian arrestin 1 self-association and dynamic distribution in retinal photoreceptors

Cassandra L Barnes et al. J Biol Chem. 2024 Dec.

Abstract

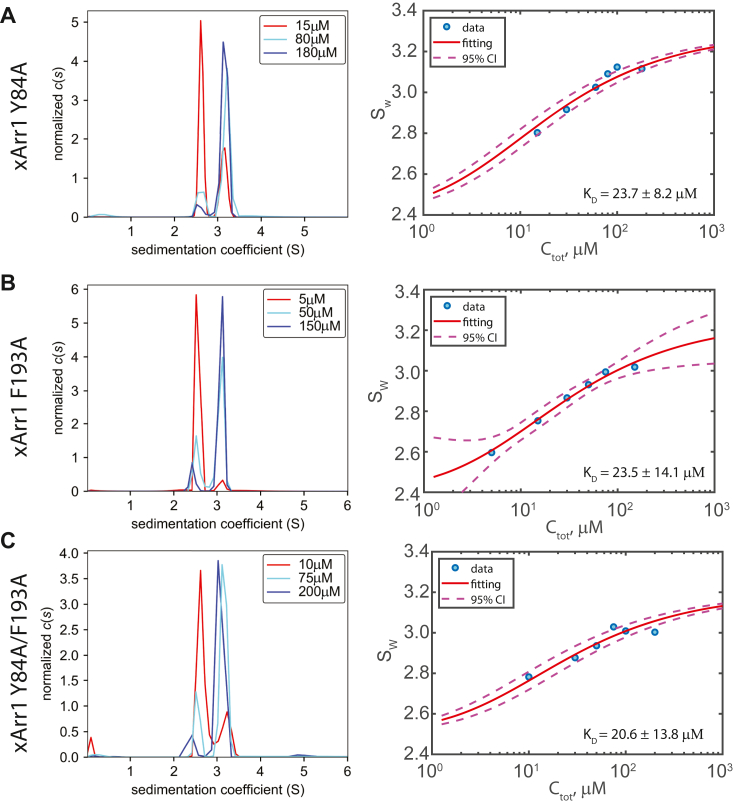
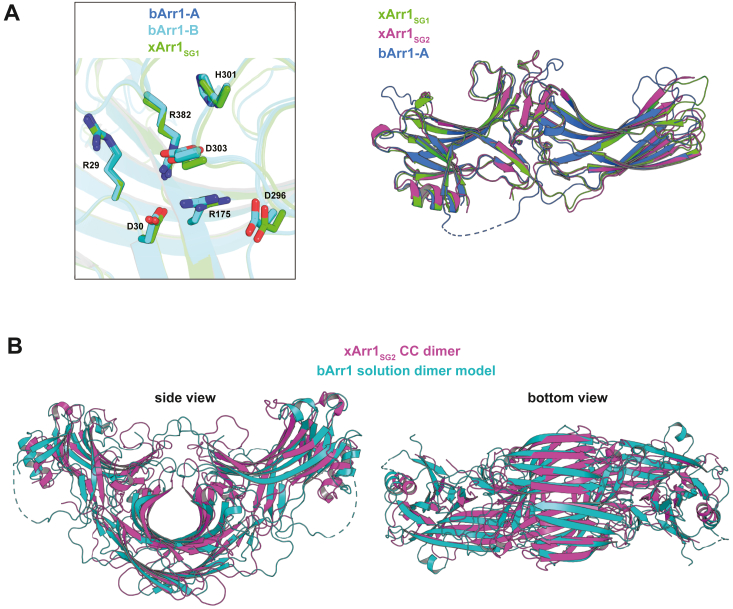
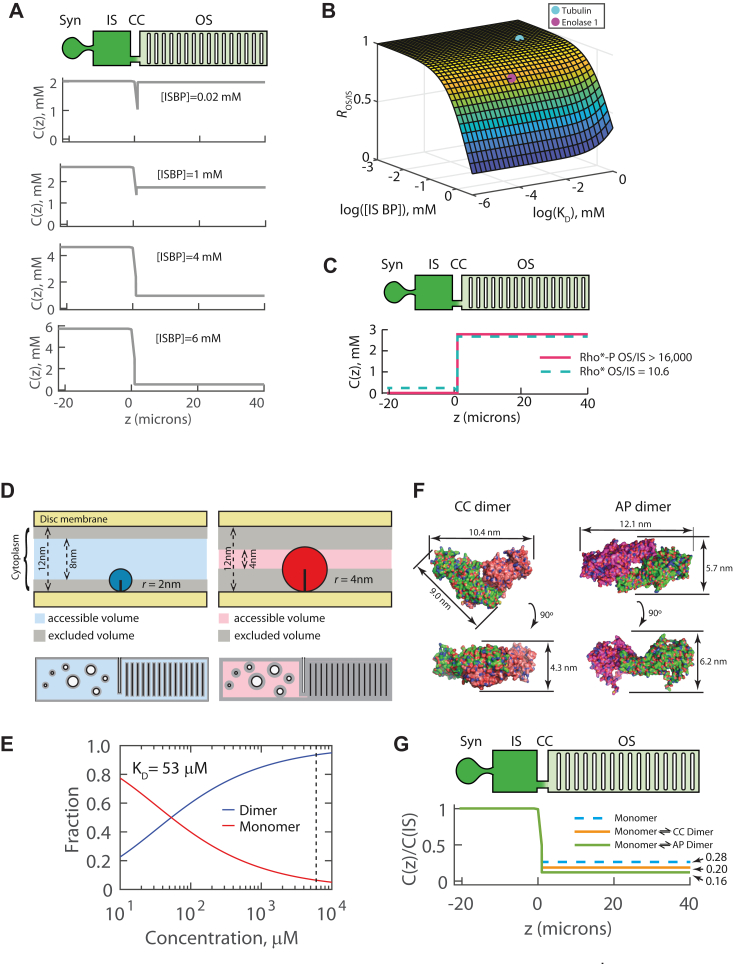
Visual arrestin 1 (Arr1) is an essential protein for termination of the light response in photoreceptors. While mammalian Arr1s form dimers and tetramers at physiological concentrations in vitro, oligomerization in other vertebrates has not been studied. Here we examine self-association of Arr1 from two amphibian species, Xenopus laevis (xArr1) and Ambystoma tigrinum (salArr1). Sedimentation velocity analytical ultracentrifugation showed that xArr1 and salArr1 oligomerization is limited to dimers. The KD for dimer formation was 53 μM for xArr1 and 44 μM for salArr1, similar to the 69 μM KD for bovine Arr1 (bArr1) dimers. Mutations of orthologous amino acids important for mammalian Arr1 oligomerization had no impact on xArr1 dimerization. Crystallography showed that the fold of xArr1 closely resembles that of bArr1 and crystal structures in different space groups revealed two potential xArr1 dimer forms: a symmetric dimer with a C-domain interface (CC dimer), resembling the bArr1 solution dimer, and an asymmetric dimer with an N-domain/C-domain interface. Mutagenesis of residues predicted to interact in either of these two dimer forms yielded modest reduction in dimer affinity, suggesting that the dimer interfaces compete or are not unique. Indeed, small-angle X-ray scattering and protein painting data were consistent with a symmetric anti-parallel solution dimer (AP dimer) distinct from the assemblies observed by crystallography. Finally, a computational model evaluating xArr1 binding to compartment-specific partners and partitioning based on heterogeneity of available cytoplasmic spaces shows that Arr1 distribution in dark-adapted photoreceptors is largely explained by the excluded volume effect together with tuning by oligomerization.

Keywords: X-ray crystallography; arrestin; computer modeling; oligomerization; photoreceptor; small-angle X-ray scattering (SAXS).


Conflict of interest statement

Conflicts of interest The authors declare that they have no conflicts of interests with the contents of this article.

Figures

Figure 1
Figure 1
Comparison of Xenopus laevis and Ambystoma tigrinum Arr1 with mammalian Arr1 sequences. Sequence alignment of X. laevis and A. tigrinum Arr1 (xArr1 and salArr1, respectively) with bovine (b), mouse (m), and human (h) Arr1s. The alignment was performed with Clustal Omega (88). White letters on red background indicates exact conservation at a site and boxed red letters show partial conservation at a site. Conservation was assigned based on % equivalence of physicochemical properties using a global score of 0.7, as defined in Espript (89). Red arrowheads mark residues that form the polar core, brown arrowheads mark sites involved in the bArr1 dimer interface, and black arrowheads mark conserved cysteine residues. Secondary structural elements derived from crystal structures are shown above and below the sequence alignment. β – beta sheet, α – alpha helix, η – 310 helix.
Figure 2
Figure 2
WT Xenopus and Salamander Arr1 form dimers, but not higher-order oligomers, in a concentration-dependent manner.A, c(s) distributions for xArr1 at concentrations of 5, 90, and 185 μM (left panel) show two peaks at ∼ 2.5 and ∼3 S, consistent with expectations for monomer and dimer. The mass in the peaks shifted from 2.5 S to 3 S with increasing concentration, indicating concentration-dependent self-association to dimers. Right panel: symbols are weighted-average S values plotted as a function of concentration. Solid red line is the best fitting of the results to the MD model, where monomer and dimer S values were constrained by the average peak positions found in panel C, yielding KD = 52.8 ± 14.6 μM. Dashed red lines indicate the 95% confidence interval boundaries of the fitting. B, c(s) distributions for salArr1 at concentrations of 5, 75, and 194 μM (left panel) show similar peaks at ∼ 2.5 and ∼ 3 S, with similar concentration-dependent shift in mass from 2.5 to 3 S. Right panel: symbols and lines as in (A), where MD model fitting yielded KD = 44.0 ± 14.9 μM. C, peak S values (symbols) for the putative monomers and dimers of xArr1 plotted as a function of concentration. Lines represent linear regressions where the slopes were near zero. Mean peak values: 2.53 ± 0.08 and 3.06 ± 0.08 (mean ± SD). r represents the Pearson correlation coefficient.
Figure 3
Figure 3
WT bovine Arr1 forms larger oligomers.A, c(s) distributions for bArr1 show two peaks that shift to higher S values with increasing concentration. B, overlay of two concentrations each of xArr1 and bArr1 showing that the monomer and dimer of both species sediment at similar Svedberg values at lower concentrations. The Svedberg value of the right-most peak of bArr1 (220 μM) is approximately consistent with that expected for a globular protein with molecular weight of an Arr1 tetramer. C, weighted S isotherm analysis. Symbols indicate the weighted average Svedberg values at indicated concentration. Blue symbols represent Sw values for endogenous bArr1 purified from bovine rod outer segments. Orange symbols represent Sw values for recombinantly expressed bArr1. The red line is the best fitting of the MDT binding model to the pooled endogenous and recombinant values, yielding KD, dimer ∼ 69 μM and KD tetramer ∼ 25 μM. Dashed lines are 95% confidence interval boundaries.
Figure 4
Figure 4
Mutations homologous to those that disrupt mammalian Arr1 oligomerization do not impact xArr1 dimerization.AC, left panels show overlays of the c(s) distributions for three concentrations from each mutant xArr1 including the lowest and highest concentrations that were examined. Right panels show the weighted S values and fittings to the MD model, as described in Fig. 3.
Figure 5
Figure 5
Comparison of two crystal structures of xArr1.A, global superposition of xArr1SG1 and xArr1SG2, highlighting the regions with significant differences. B, differences between xArr1SG1 and xArr1SG2 at the 3-element interaction (left panel, superposition based on residues 99–112) and the polar core (right panel, global superposition) regions. C, NC dimer of xArr1SG1 (left) and CC dimer of xArr1SG2 (right) found in their respective crystal lattices. D, details of the dimer interfaces featured in the NC (left) and CC (right) crystals. Dashed lines represent hydrogen bonds between monomers.
Figure 6
Figure 6
Comparison between structures of bArr1 and xArr1.A, global superposition of the polar core in basal bArr1 (PDB ID 7JSM, chains A and B) with xArr1SG1 (left panel). Residue numbering is based on the bArr1 sequence. Global superposition of xArr1SG1, xArr1SG2, and basal bArr1 (PDB ID 7JSM, chain A) (right panel). B, global superposition of the CC dimer of xArr1SG2 with the CC dimer of bArr1, extracted from the solution tetramer model (23).
Figure 7
Figure 7
Differences between bArr1 and xArr1 CC dimers.A, position of F197 in the CC dimer solution model of bArr1 (23) (left panel) compared to the corresponding F193 in the CC dimer of xArr1SG2 (right panel). The side chain atoms for xArr1 F193 were omitted from the final model owing to weak electron density but are shown here in a geometrically reasonable position for illustrative purposes. B, bArr1 CC dimer predicted from the solution tetramer model (23) and xArr1 crystallographic CC dimer. Overlaying the N-domains of one monomer from each dimer reveals a differential rotation of the opposite N-domains, showing that an xArr1 tetramer with the same arrangements as the bArr1 tetramer would not be possible. C, position of F85 in the solution tetramer model of bArr1, at the interface between the N-domains of adjacent dimers (left panel). The right panel shows the positioning of xArr1 Y84 relative to the opposing N-domain when two xArr1SG2 dimers are superimposed onto the bArr1 solution structure (superposition based on a single chain of the dimer). This comparison suggests that the differing orientation of the xArr1 CC dimer could prevent the tetramerization observed for bArr1. Complete models are shown in Fig. S5.
Figure 8
Figure 8
AUC SV analysis of xArr1 mutants designed based on the two xArr1 crystal structures.A, position of residues P182-R185 (cyan) and T188-Q191 (lime), from strand XI and adjacent loops, in the context of the xArr1 CC dimer. B, position of residues S136-D137 from the middle loop, in the context of the xArr1 CC dimer. C, position of residues L156, E157, T188-Q191, D337, and S340 in the context of the xArr1 NC dimer. D, monomer-dimer isotherm fittings of the weighted S values from AUC SV analysis of the indicated xArr1 mutants. Solid red lines are fittings and dashed magenta lines are 95% confidence boundaries. Fitted KD values are shown.
Figure 9
Figure 9
SAXS analysis of xArr1 reveals the solution dimer structure differs from the predicted crystal dimers.A, Guinier plot of xArr1 at 0.5, 2, 4.5, and 7.6 mg/ml. B, radius of gyration (Rg) and mass as predicted by Bayesian inference from scattering analysis from indicated xArr1 concentrations. C, monomer and dimer volume fraction determined from PRIMU and GNOM. Lines represent fittings to a monomer-dimer binding isotherms with KD ∼ 20 μM. D, I(q) plots from monomer and NC and CC dimers and dimer model 91 predicted from the crystal structure of xArr1 using Crysol. Model 91 has the lowest χ2 value suggesting it provides the best fit. E, bar chart of χ2 values from 100 models of the xArr1 dimer generated by SASREF and analyzed by Crysol. The five models generating the lowest χ2 are highlighted in magenta. F, Ab initio model of the SAXS envelope generated in GASBOR. The left-most panel shows the envelope alone and each of the other panels is a fitting of the indicated model into the envelope using the UCSF ChimeraX fit function. G, enlarged envelope with model 91 displayed in two views shows the best fitting. H, model 91 with crystal predicted dimerization interface residues highlighted in green, cyan, and yellow. Residues Y84 and F193 that were identified as important for bArr1 oligomerization are indicated. I, model 91 with R375 and K379 identified in protein painting/mass spectrometry are found on the putative antiparallel dimer interface.
Figure 10
Figure 10
Evaluation of the relative impact of inner segment binding partners and partitioning by steric volume exclusion on the depletion of xArr1 from the outer segment of dark-adapted rods.A, the top panel is a schematic of a rod. Lower panels represent computed concentration distributions of Arr1 in photoreceptors with indicated concentration of a prototypical inner segment binding partner (ISBP). The average Arr1 concentration, relative to the plasma membrane envelope, was 2 mM. ISBP was treated as an immobile binding partner present only in the Syn and IS, with Arr1 binding KD = 40 μM, which corresponds to bArr1 binding to tubulin dimers and microtubules (55). An ISBP concentration of 6 mM was required to achieve an OS/IS concentration ratio, ROS/IS = 0.1. B, plot of the relationship between the OS enrichment index (ROS/IS), the KD of the ISBP binding with xArr1, and the IS concentration of the ISBP. The cyan symbol indicates the predicted ROS/IS for tubulin interactions (59, 60). The magenta symbol indicates the predicted ROS/IS for Arr1 binding to enolase 1, with KD ∼ 1 μM and inner segment concentration of ∼ 0.4 μM (see text for details). These results show that physiological concentrations of tubulin would produce negligible partitioning of Arr1 to the cell body and pre-synapse whereas enolase 1 would be expected to produce 20% IS localization provided that enolase 1 is indeed present at 0.4 μM concentration in the IS, a value that is currently undetermined. C, predicted distributions of Arr1 in rods where all rhodopsins are light activated with or without phosphorylation (Rho∗-P or Rho∗, respectively). In either case, Arr1 is predicted to be strongly localized to the outer segment, where the localization is essentially quantitative for Rho∗-P and produces ∼10 fold enrichment for Rho∗. D, schematic representation of the steric volume exclusion effect within the interdiscal space (upper panels) and the photoreceptor overall (lower panels), for two molecules with different hydrated radii. The excluded volume refers to the volume near cell structures that is inaccessible to the centers of mass of soluble molecules. In geometrically constrained spaces, like the interdiscal spaces, the excluded volume significantly reduces the volume available and thus increases the effective concentration of the molecules. Larger molecules experience this effect more acutely than smaller molecules; however, the effect impacts all molecules. E, plot of fractions of xArr1 monomer (red) and dimer (blue) as a function of concentration assuming KD = 53 μM. Dashed lines indicate the concentration of Arr1 (relative to momomer) in the subcellular structure-excluded cytoplasm when expressed at WT levels (4 mM). F, solvent accessible surface of xArr CC dimer predicted from xArr1SG2 crystal and the antiparallel dimer (AP dimer) with dimensions. G, predicted distribution of monomer and dimer xArr1s in a rod based on the size and shape as computed in Najafi et al. 2021 (17). Note that even monomer xArr1 is strongly partitioned to the cell body. The CC dimer and AP dimer models distributions differ ∼1.2-fold while the monomer and AP dimer distributions differ ∼1/75-fold. The results show that increasing the size of Arr1 by dimerization with the KD measured here is expected to enhance the cell body enrichment by ∼ 8 to 12%. Syn, presynaptic spherule; IS, inner segment/cell body; cc, connecting cilium; OS, outer segment.
Supplemental Fig. S1
Figure S1:Analysis of residues involved in protein-protein contacts in the two xArr1 crystal forms. The top panel shows a Venn diagram containing the numbers of residues involved in protein-protein contacts, (i.e., within 3.6 Å of another molecule related by crystallographic symmetry). Residues shown as orange sticks in the bottom panel correspond to the shared contact residues in the upper panel. Note the clustering of these residues within the C-domain, suggesting that it is particularly prone to engaging in protein-protein contacts.
Supplemental Fig. S2
Figure S2:C-C dimer interface: In red are the residues involved in interactions across the C-C dimer interfaces of the bArr1 solution tetramer model (green) and the xArr1SG2 crystal structure (cyan). Only one monomer per dimer is shown.
Supplemental Fig. S3
Figure S3: Comparison of the CC dimer in xArr1SG2 crystal structure with AlphaFold3 (AF3) model-1 for xArr1.A, Side views of xArr1SG2 (left), AF3 model-1 (center), and both models superimposed (residues 7-357) (right). B, Bottom views of xArr1SG2 (left) and AF3 model-1 (right).
Supplemental Fig. S4
Figure S4: 2Fo-Fc electron density maps, contoured at 1 RMSD, for the structures shown in Fig. 5B. (A, xArr1SG1 polar core. B, xArr1SG2 polar core. C, xArr1SG1 3-element interaction. D, xArr1SG2 3-element interaction.
Supplemental Fig. S5
Figure S5:Zoomed-out models from Fig. 7C. (Top, left panel): solution structure of the bArr1 tetramer. (Top, right panel): full model of a hypothetical dimer CC dimer of xArr1, built using the bArr1 solution structure as template for interface contact between CC dimers, as explained in the legend of Figure. 7C. The color scheme for both top panels is the same as in Fig. 7A, C. (Bottom panels): same models as in the top panels, but with each monomer in different colors, for clarity.

References

    1. Gurevich V.V., Gurevich E.V. The structural basis of arrestin-mediated regulation of G-protein-coupled receptors. Pharmacol. Ther. 2006;110:465–502. - PMC - PubMed
    1. Wilden U., Hall S.W., Kuhn H. Phosphodiesterase activation by photoexcited rhodopsin is quenched when rhodopsin is phosphorylated and binds the intrinsic 48-kDa protein of rod outer segments. Proc. Natl. Acad. Sci. U. S. A. 1986;83:1174–1178. - PMC - PubMed
    1. Palczewski K., Rispoli G., Detwiler P.B. The influence of arrestin (48K protein) and rhodopsin kinase on visual transduction. Neuron. 1992;8:117–126. - PubMed
    1. Dolph P.J., Ranganathan R., Colley N.J., Hardy R.W., Socolich M., Zuker C.S. Arrestin function in inactivation of G protein-coupled receptor rhodopsin in vivo. Science. 1993;260:1910–1916. - PubMed
    1. Xu J., Dodd R.L., Makino C.L., Simon M.I., Baylor D.A., Chen J. Prolonged photoresponses in transgenic mouse rods lacking arrestin. Nature. 1997;389:505–509. - PubMed

Publication types