. 2024 Dec;300(12):107971.
doi: 10.1016/j.jbc.2024.107971. Epub 2024 Nov 5.

RNA G-quadruplexes and calcium ions synergistically induce Tau phase transition in vitro

Affiliations

RNA G-quadruplexes and calcium ions synergistically induce Tau phase transition in vitro

Yasushi Yabuki et al. J Biol Chem. 2024 Dec.

Abstract

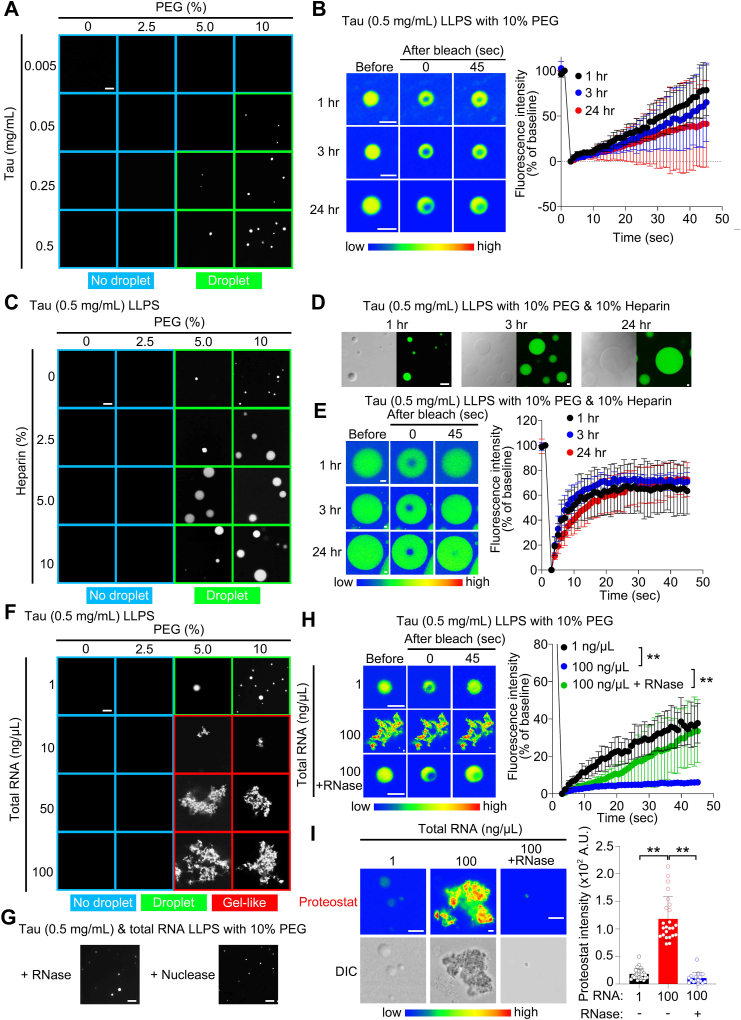
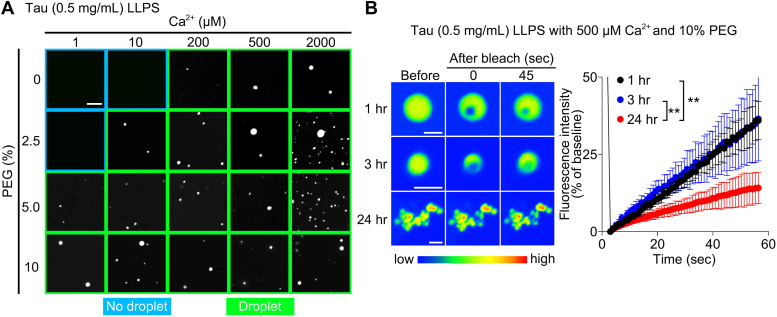
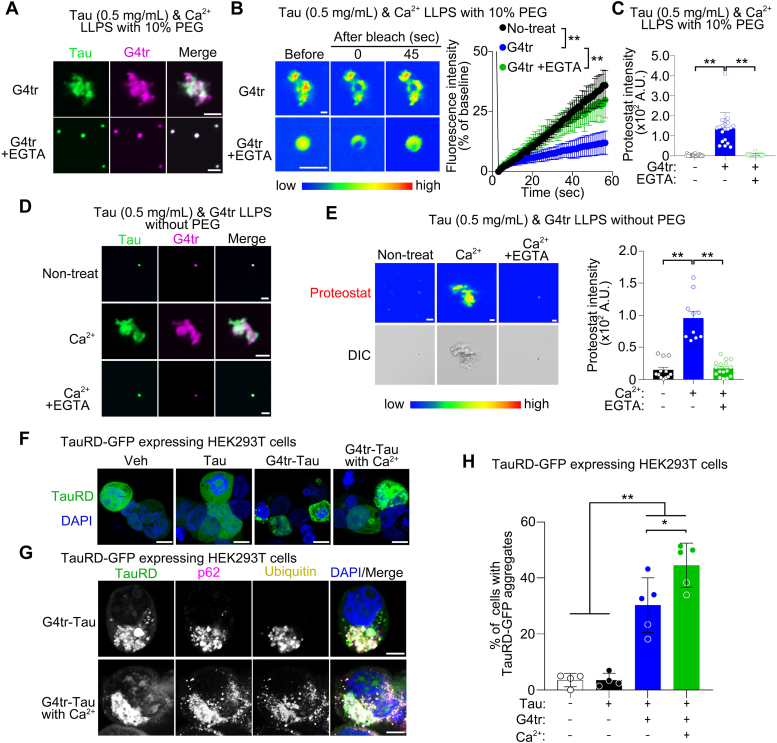
Tau aggregation is a defining feature of neurodegenerative tauopathies, including Alzheimer's disease, corticobasal degeneration, and frontotemporal dementia. This aggregation involves the liquid-liquid phase separation (LLPS) of Tau, followed by its sol-gel phase transition, representing a crucial step in aggregate formation both in vitro and in vivo. However, the precise cofactors influencing Tau phase transition and aggregation under physiological conditions (e.g., ion concentration and temperature) remain unclear. In this study, we unveil that nucleic acid secondary structures, specifically RNA G-quadruplexes (rG4s), and calcium ions (Ca2+) synergistically facilitated the sol-gel phase transition of human Tau under mimic intracellular ion conditions (140 mM KCl, 15 mM NaCl, and 10 mM MgCl2) at 37 °C in vitro. In the presence of molecular crowding reagents, Tau formed stable liquid droplets through LLPS, maintaining fluidity for 24 h under physiological conditions. Notably, cell-derived RNA promoted Tau sol-gel phase transition, with rG4s emerging as a crucial factor. Surprisingly, polyanion heparin did not elicit a similar response, indicating a distinct mechanism not rooted in electrostatic interactions. Further exploration underscored the significance of Ca2+, which accumulate intracellularly during neurodegeneration, as additional cofactors in promoting Tau phase transition after 24 h. Importantly, our findings demonstrate that rG4s and Ca2+ synergistically enhance Tau phase transition within 1 h when introduced to Tau droplets. Moreover, rG4-Tau aggregates showed seeding ability in cells. In conclusion, our study illuminates the pivotal roles of rG4s and Ca2+ in promoting Tau aggregation under physiological conditions in vitro, offering insights into potential triggers for tauopathy.

Keywords: RNA G-quadruplex; Tau; calcium ions; liquid–liquid phase separation; liquid–solid phase transition.


Conflict of interest statement

Conflict of interests The authors declare that they have no conflicts of interest with the contents of this article.

Figures

Figure 1
Figure 1
RNA initiates Tau liquid–solid phase transition.A, representative images of in vitro Tau phase separation dependent on PEG and Tau protein concentration, when incubated at 37 °C for 1 h. The scale bar represents 5 μm. B, FRAP assays of Tau LLPS with 10% PEG at 1, 3, and 24 h after incubation. The scale bar represents 2 μm. n = 6 (1 h), n = 9 (3 h), and n = 9 (24 h). C, representative images of in vitro Tau (0.5 mg/ml) phase separation dependent on PEG and heparin concentration when incubated at 37 °C for 1 h. The scale bar represents 5 μm. D, representative images of in vitro Tau (0.5 mg/ml) phase separation with 10% PEG and 10% heparin at 1, 3, and 24 h after incubation. The scale bar represents 5 μm. E, FRAP assays of Tau LLPS with 10% PEG and 10% heparin at 1, 3, and 24 h after incubation. The scale bar represents 5 μm. n = 6 (1 h), n = 7 (3 h), and n = 6 (24 h). F, representative images of in vitro Tau (0.5 mg/ml) phase separation dependent on PEG and total RNA concentration at 1 h after incubation. The scale bar represents 5 μm. G, representative images of in vitro Tau (0.5 mg/ml) phase separation with 10% PEG and 100 ng/μl total RNA in the presence of RNase A (right) and nuclease (left) incubated at 37 °C for 1 h. The scale bar represents 5 μm. H, FRAP assays of Tau LLPS with 10% PEG and total RNA (1 or 100 ng/μl) with or without RNase A at 1 h after incubation. The scale bar represents 2 μm. n = 5 (1 ng/μl), n = 7 (100 ng/μl), and n = 6 (100 ng/μl + RNase A). I, analysis of Proteostat intensity within Tau LLPS with 10% PEG and total RNA (1 or 100 ng/μl) with or without RNase A at 1 h after incubation. The scale bar represents 2 μm. n = 30 (1 ng/μl), n = 24 (100 ng/μl), and n = 16 (100 ng/μl + RNase A). Data are presented as the mean ± SD. ∗∗p < 0.01 by two-way (B, E, and H) and one-way (I) analysis of variance with Bonferroni’s multiple comparisons test. LLPS, liquid–liquid phase separation.
Figure 2
Figure 2
rG4 accelerates Tau liquid–solid phase transition.A, representative images of in vitro Tau (0.5 mg/ml) phase separation with 10% PEG and 1 μM RNA nucleotides at 1, 3, and 24 h after incubation. The scale bar represents 5 μm. B, FRAP assays of Tau LLPS with 10% PEG and 1 μM G4tr at 1, 3, and 24 h after incubation. The scale bar represents 5 μm. n = 7 (1 h), n = 7 (3 h), and n = 6 (24 h). C, FRAP assays of Tau LLPS with 10% PEG in the presence of 1 μM G4tr or G4mt at 24 h after incubation. The scale bar represents 2 μm. n = 7 (1 h), n = 7 (3 h), and n = 6 (24 h). D, analysis of Proteostat intensity within Tau LLPS with 10% PEG and 1 μM RNA at 24 h after incubation. The scale bar represents 5 μm. n = 31 (untreated), n = 15 (G4tr), n = 40 (G4mt), n = 28 ((CAG)8), and n = 40 ((AAA)8). E, representative images of Tau (green) and G4tr (magenta) with 10% PEG incubated at 37 °C for 1 and 24 h. Data are presented as the mean ± SD. ∗∗p < 0.01 by two-way (B and C) and one-way (D) ANOVA with Bonferroni’s multiple comparisons test. rG4, RNA G-quadruplex.
Figure 3
Figure 3
Ca2+promotes Tau LLPS and liquid–solid phase transition.A, representative images of in vitro Tau (0.5 mg/ml) phase separation dependent on PEG and Ca2+ concentrations when incubated at 37 °C for 1 h. The scale bar represents 5 μm. B, FRAP assays of Tau LLPS with 10% PEG at 1, 3, and 24 h after incubation. The scale bar represents 2 μm. n = 9 per time point. Data are presented as the mean ± SD. ∗∗p < 0.01 by two-way (B) ANOVA with Bonferroni’s multiple comparisons test. Ca2+, calcium ions.
Figure 4
Figure 4
Synergistic effect of Ca2+and G4tr on Tau liquid–solid phase transition.A, representative images of in vitro Tau (0.5 mg/ml; green) and G4tr (1 μM; magenta) phase separation in the presence of 10% PEG and 500 μM Ca2+ with or without 2.5 mM EGTA when incubated at 37 °C for 1 h. The scale bar represents 2 μm. B, FRAP assays of Tau LLPS in the presence of 10% PEG, 1 μM G4tr, and 500 μM Ca2+ with or without 2.5 mM EGTA when incubated at 37 °C for 1 h. The scale bar represents 2 μm. n = 9 (untreated), n = 8 (G4tr), and n = 6 (G4tr + EGTA). C, analysis of Proteostat intensity within Tau LLPS with 10% PEG, 1 μM G4tr, and 500 μM Ca2+ with or without 2.5 mM EGTA when incubated at 37 °C for 1 h. The scale bar represents 5 μm. n = 35 (untreated), n = 20 (G4tr), and n = 22 (G4tr + EGTA). D, representative images of in vitro Tau (0.5 mg/ml; green) and G4tr (1 μM; magenta) phase separation with or without 500 μM Ca2+ and 2.5 mM EGTA when incubated at 37 °C for 1 h. The scale bar represents 2 μm. E, analysis of Proteostat intensity within Tau LLPS with 1 μM G4tr in the presence or absence of 500 μM Ca2+ and 2.5 mM EGTA when incubated at 37 °C for 1 h. The scale bar represents 2 μm. n = 12 (G4tr), n = 10 (G4tr + Ca2+), and n = 16 (G4tr + Ca2+ + EGTA). F, representative images of TauRD-GFP (green) and DAPI (blue) in TauRD-GFP transfected HEK293T cells following treatment with in vitro Tau aggregates induced by G4tr in the presence or absence of Ca2+. The scale bars represents 10 μm. G, representative images of TauRD-GFP (green), p62 (magenta), ubiquitin (yellow), and DAPI (blue) in TauRD-GFP expressing HEK293T cells following G4tr-Tau with or without Ca2+. The scale bars represents 5 μm. H, the ratio of cells with p62- and ubiquitin-positive TauRD aggregates. n = 4 (vehicle), n = 4 (Tau), n = 5 (G4tr-Tau), and n = 5 (G4tr-Tau with Ca2+). Data are presented as the mean ± SD. ∗p < 0.05, ∗∗p < 0.01 by two-way (B) and one-way (C, E, and H) ANOVA with Bonferroni’s multiple comparisons test. DAPI, 4′,6-diamidino-2-phenylindole; Ca2+, calcium ions.

References

    1. Lee G., Cowan N., Kirschner M. The primary structure and heterogeneity of tau protein from mouse brain. Science. 1988;239:285–288. - PubMed
    1. Weingarten M.D., Lockwood A.H., Hwo S.Y., Kirschner M.W. A protein factor essential for microtubule assembly. Proc. Natl. Acad. Sci. 1975;72:1858–1862. - PMC - PubMed
    1. Vacchi E., Kaelin-Lang A., Melli G. Tau and alpha synucleins synergistically effect neurodegenerative diseases when the periphery is the core. Int. J. Mol. Sci. 2020;21:5030. - PMC - PubMed
    1. Barghorn S., Zheng-Fischhofer Q., Ackmann M., Biernat J., von Bergen M., Mandelkow E.M., et al. Structure, microtubule interactions, and paired helical filament aggregation by tau mutants of frontotemporal dementias. Biochem. 2000;39:11714–11721. - PubMed
    1. Hong M., Zhukareva V., Vogelsberg-Ragaglia V., Wszolek Z., Reed L., Miller B.I., et al. Mutation-specific functional impairments in distinct tau isoforms of hereditary FTDP-17. Science. 1998;282:1914–1917. - PubMed

Publication types

LinkOut - more resources