. 2024 Nov 7;8(1):e202402760.
doi: 10.26508/lsa.202402760. Print 2025 Jan.

Mass spectrometry-based proteomic exploration of diverse murine macrophage cellular models

Affiliations

Mass spectrometry-based proteomic exploration of diverse murine macrophage cellular models

Jack Gudgeon et al. Life Sci Alliance. .

Abstract

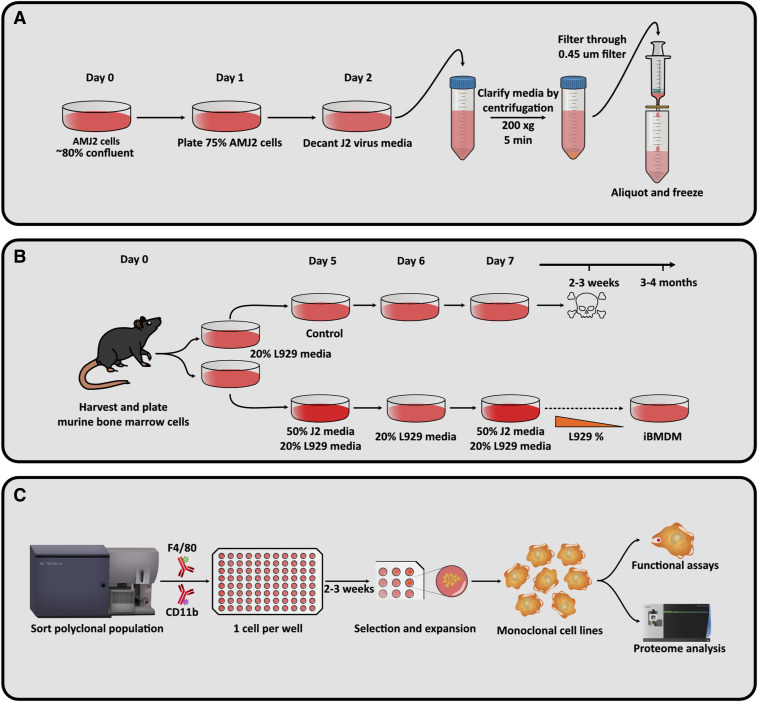
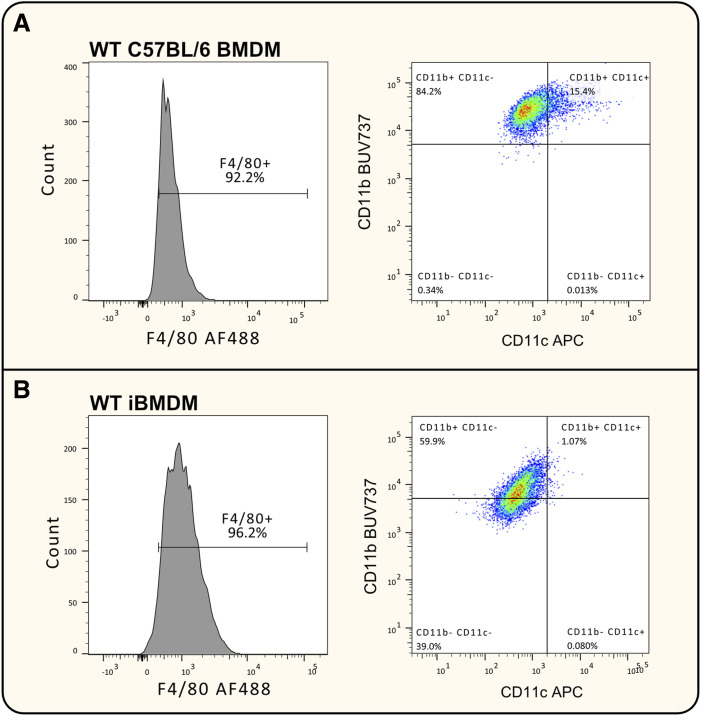
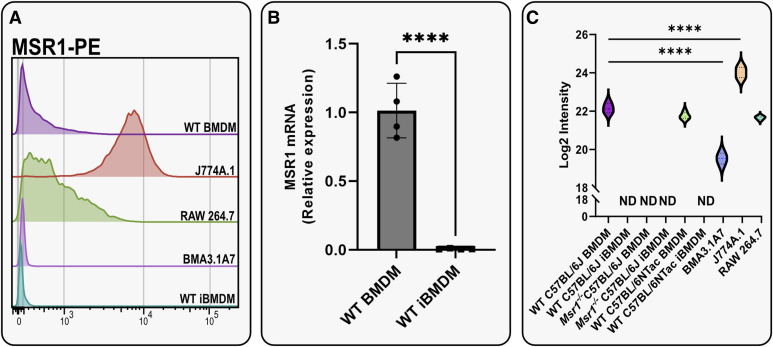
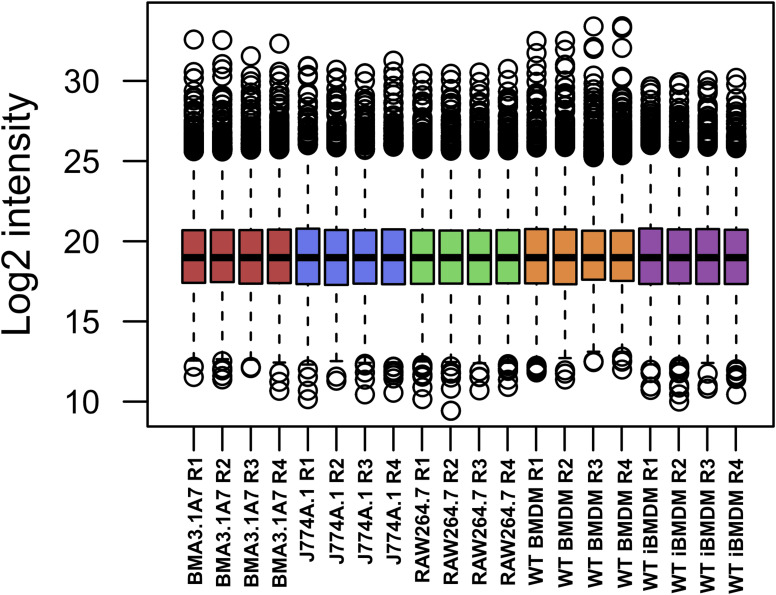
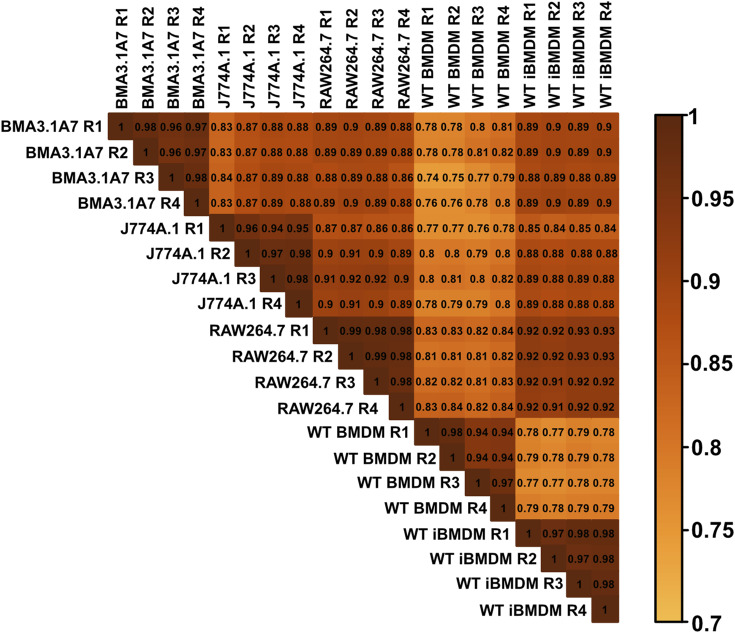
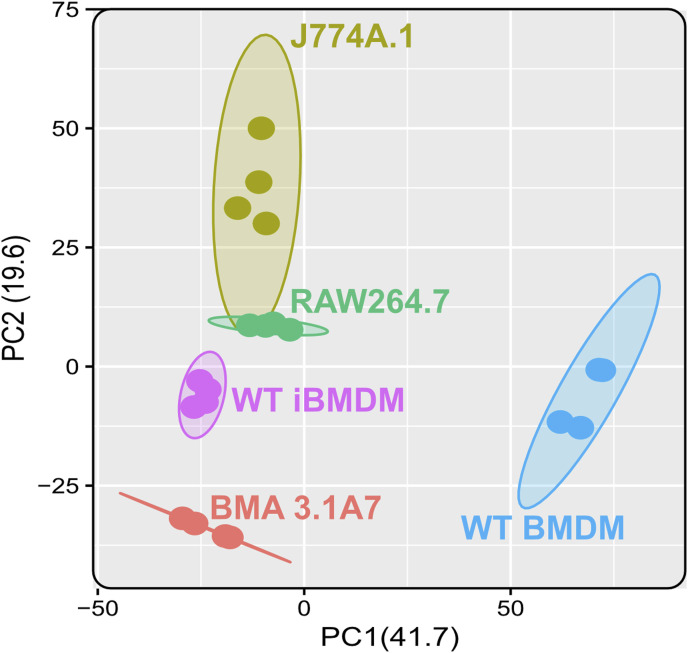
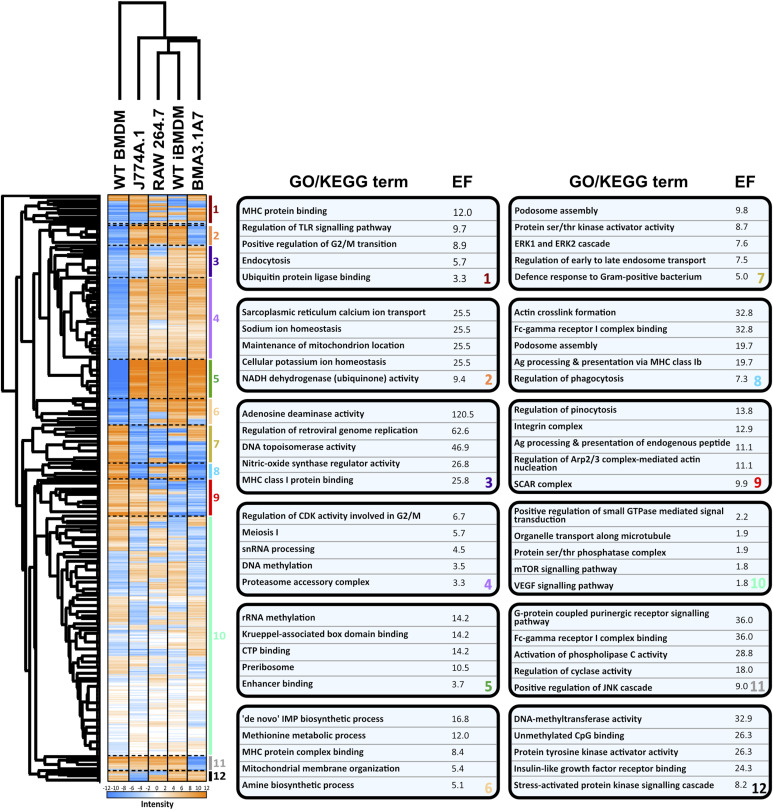
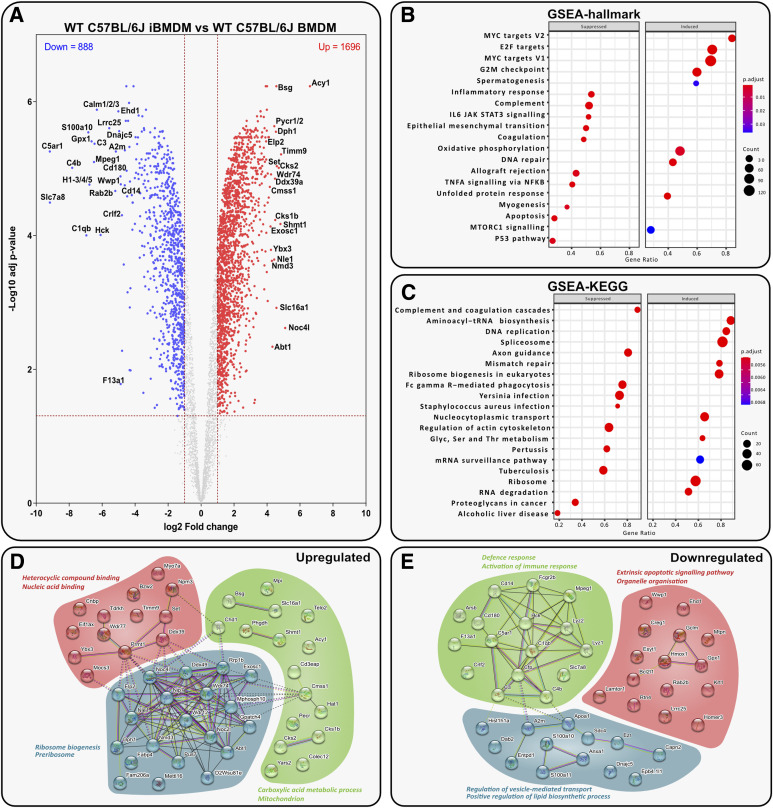
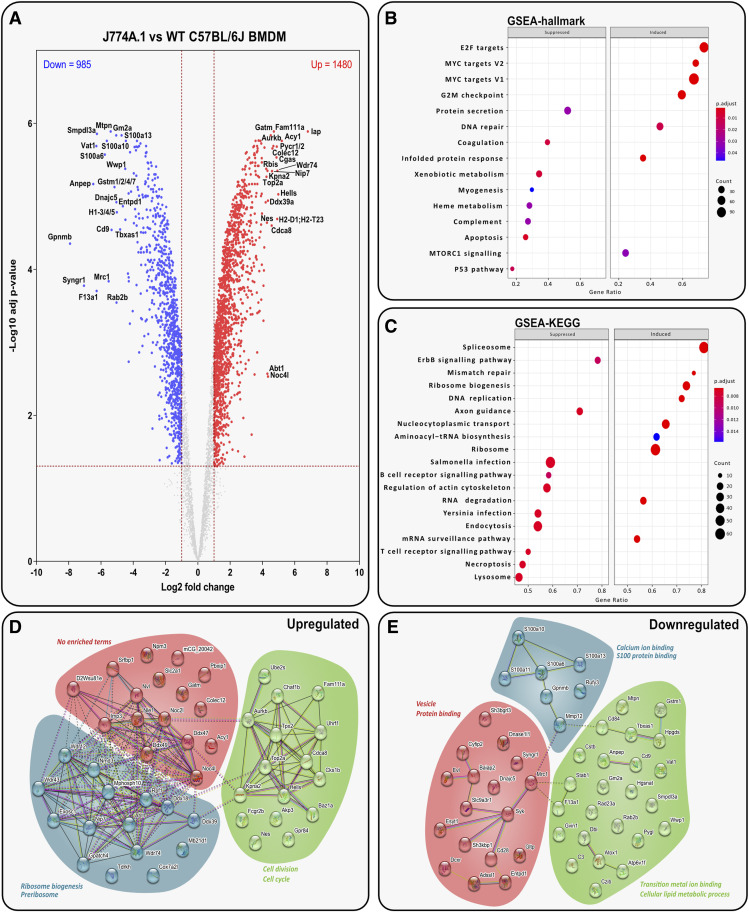
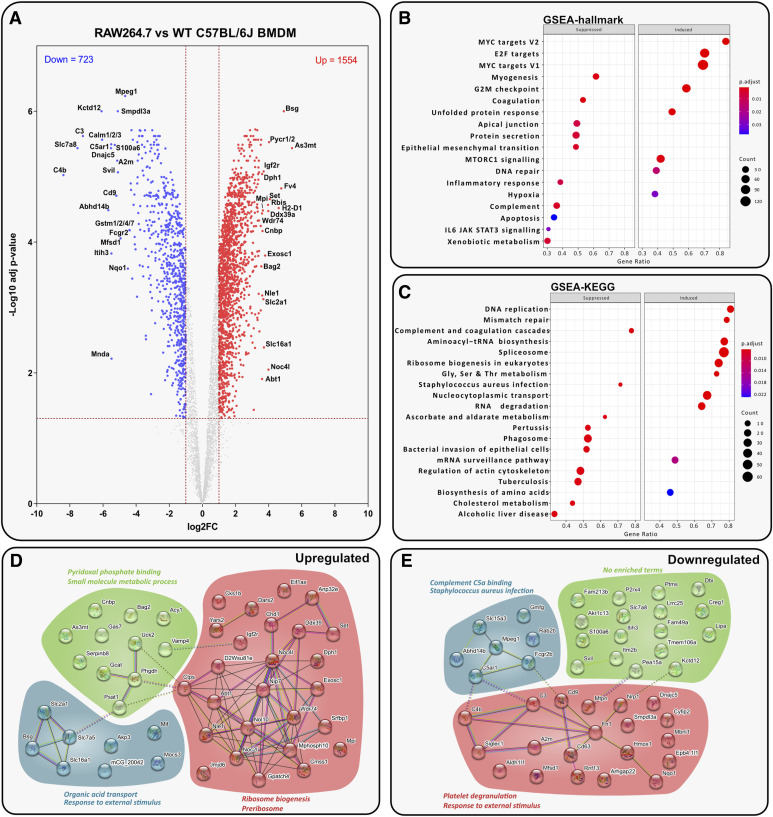
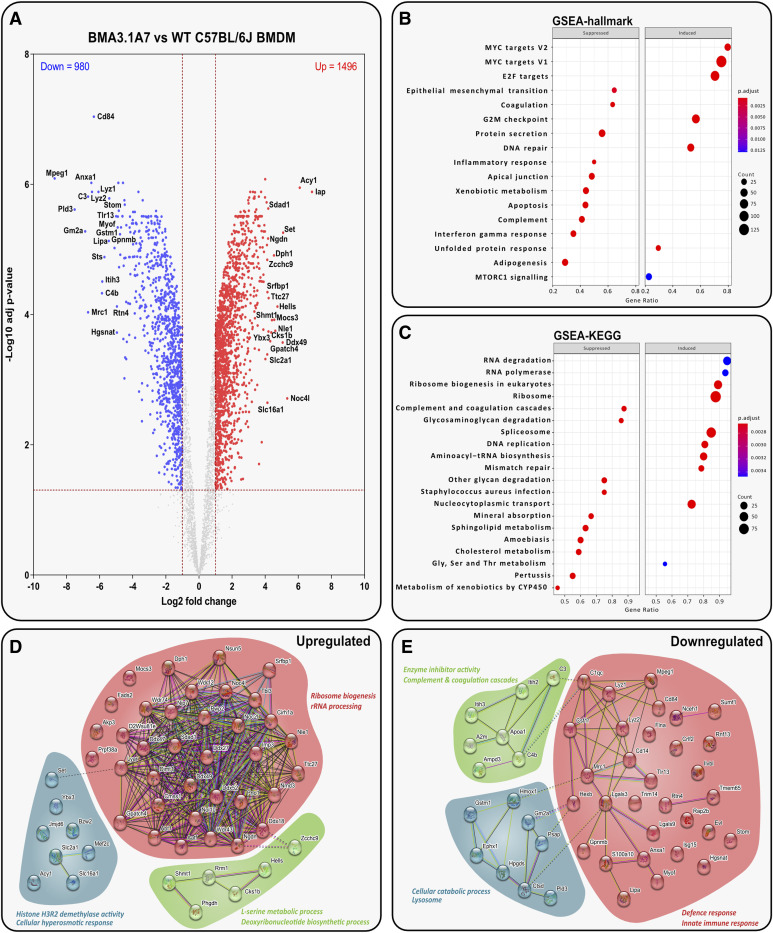
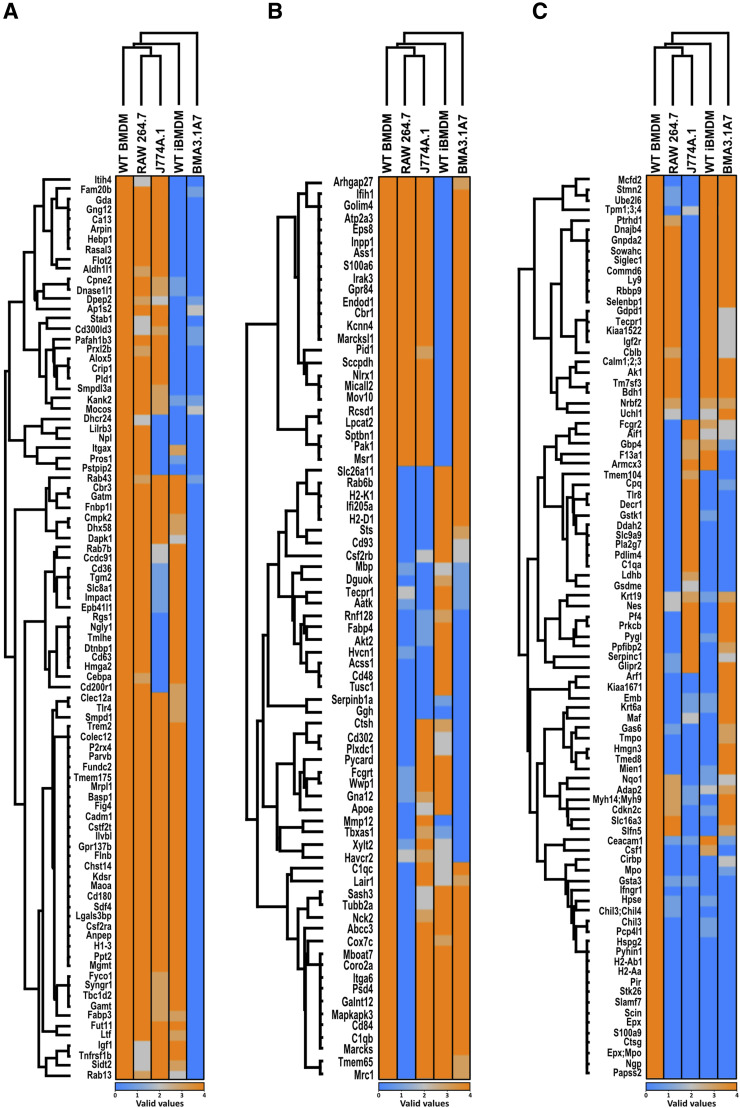
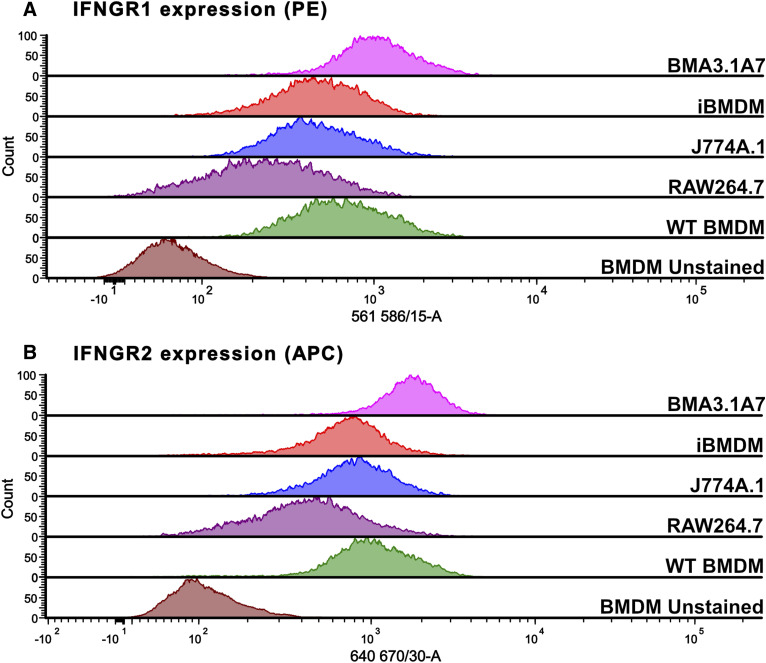
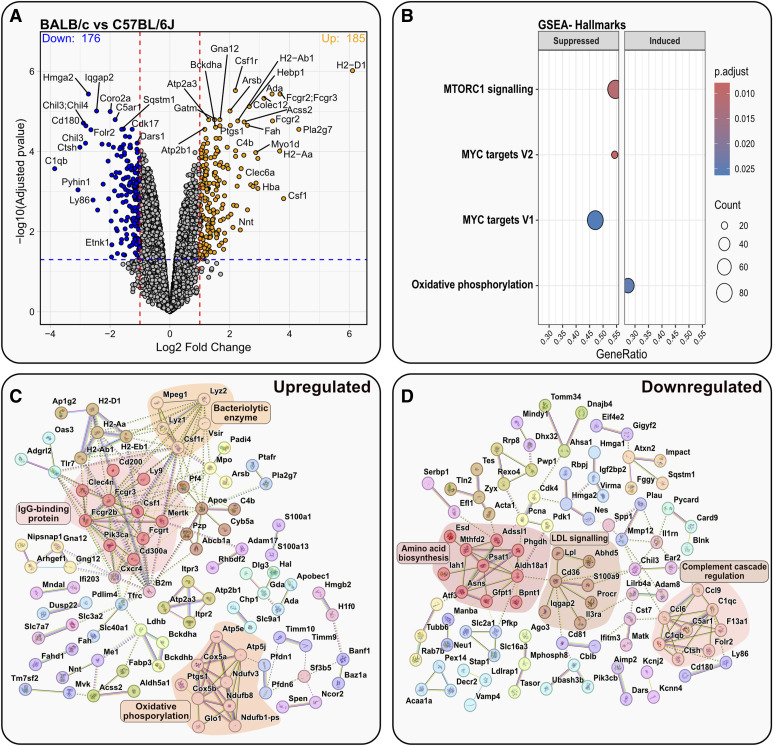
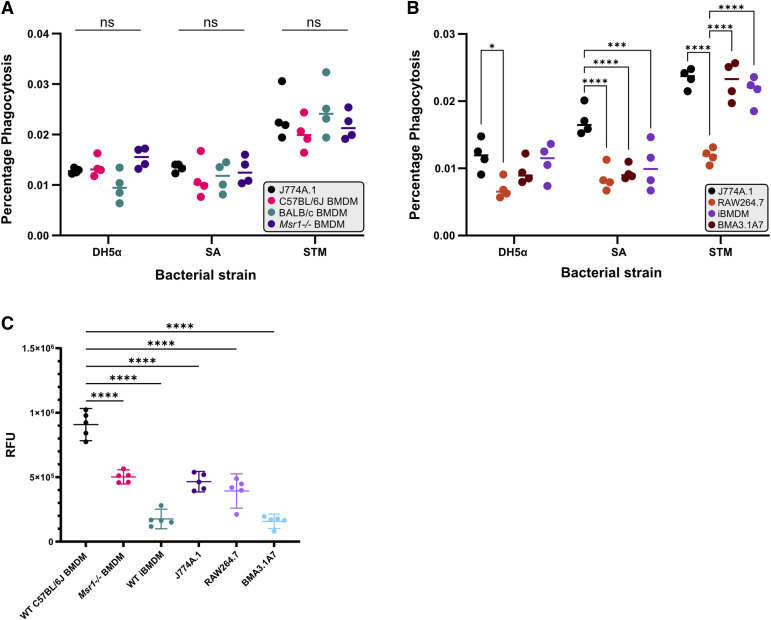
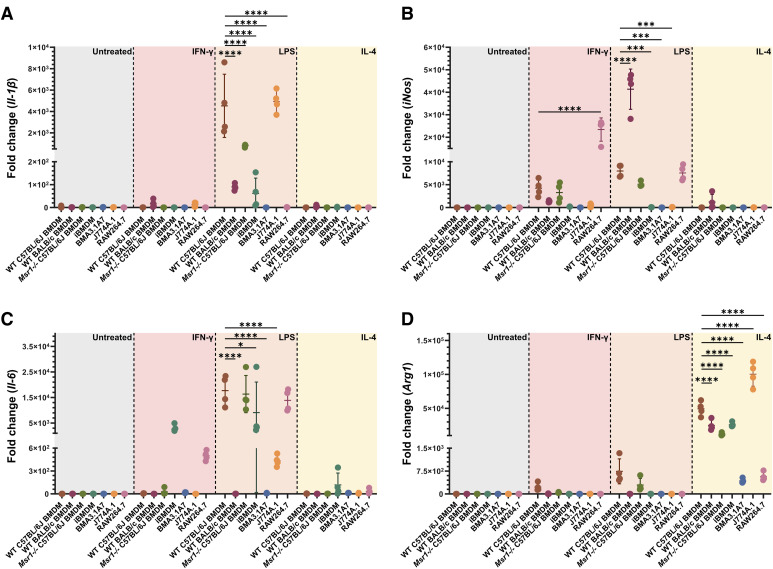
Immortalised cell lines that mimic their primary cell counterparts are fundamental to research, particularly when large cell numbers are required. Here, we report that immortalisation of bone marrow-derived macrophages (iBMDMs) using the J2 virus resulted in the loss of a protein of interest, MSR1, in WT cells by an unknown mechanism. This led us to perform an in-depth mass spectrometry-based proteomic characterisation of common murine macrophage cell lines (J774A.1, RAW264.7, and BMA3.1A7), in comparison with the iBMDMs, as well as primary BMDMs from both C57BL/6 and BALB/c mice. This analysis revealed striking differences in protein profiles associated with macrophage polarisation, phagocytosis, pathogen recognition, and interferon signalling. Among the cell lines, J774A.1 cells were the most similar to the gold standard primary BMDM model, whereas BMA3.1A7 cells were the least similar because of the reduction in abundance of several key proteins related closely to macrophage function. This comprehensive proteomic dataset offers valuable insights into the use and suitability of macrophage cell lines for cell signalling and inflammation research.


Conflict of interest statement

The authors declare that they have no conflict of interest.

Figures

Figure S1.
Figure S1.. Workflow for generation and characterisation of monoclonal immortalised bone marrow–derived macrophages (iBMDMs).
(A) Production of the J2 virus supernatant from AMJ2-C11 cells. (B) Harvest and immortalisation of BMDMs by gradually decreasing L929 medium concentration over time. (C) FACS of polyclonal iBMDMs expressing F4/80 and CD11b, followed by further selection and validation of iBMDM clones.
Figure S2.
Figure S2.. Immunophenotype characterisation of polyclonal WT iBMDMs.
(A, B) Histogram of surface levels of F4/80 and plot of CD11b and CD11c in F4/80-positive cells, analysed in (A) primary BMDMs and (B) WT iBMDMs. AF488, Alexa Fluor 488; BUV737, brilliant ultraviolet 737; and APC, allophycocyanin. N = 1.
Figure 1.
Figure 1.. Both gene expression and protein expression of MSR1 were lost after J2-mediated immortalisation of BMDMs.
(A) Flow cytometry characterisation of macrophage cell lines. The surface expression level of MSR1-PE was compared between WT BMDMs, J774A.1, RAW264.7, BMA3.1A7, and WT iBMDMs. N = 1. (B) Quantification of mRNA levels of Msr1 in WT BMDMs and WT iBMDMs (n = 4/group). Data are presented as the mean ± SD (unpaired t test); ∗∗∗∗P < 0.0001. (C) Proteomic log2 intensity data of MSR1 across all cell lines and primary macrophages (N = 4). ND, not detected; ****P < 0.0001 by ordinary one-way ANOVA.
Figure S3.
Figure S3.. Boxplot of median normalised log2 intensity values of macrophage cell lines and C57BL/6J BMDM mass spectrometry results.
Figure S4.
Figure S4.. Correlation plot of macrophage cell lines and C57BL/6J BMDM mass spectrometry results.
Figure S5.
Figure S5.. Macrophage cell lines cluster away from primary BMDMs.
Principal component analysis plot of macrophage cell lines and primary BMDMs. Each cell line clustered away from primary BMDMs and separately from each other. Ellipses represent the 95% confidence interval. N = 4.
Figure 2.
Figure 2.. Hierarchical heatmap analysis shows the variation between primary macrophage cells and cell lines, highlighting the enriched GO or KEGG terms in each specific cluster.
Proteins were normalised by Z-score, filtered for at least three valid values in each group, and processed using ANOVA statistical testing with a Benjamini–Hochberg FDR correction cut-off of 0.05; ANOVA significant hits were then submitted to a post hoc test with an FDR of 0.05, and the heatmap was generated. Cluster analysis was performed to generate the enrichment factor (EF) of specific terms in 12 clusters using the Fisher exact test with a Benjamini–Hochberg FDR threshold of 0.02. All GO/KEGG terms displayed had a P-value < 0.0005. N = 4.
Figure 3.
Figure 3.. J2-mediated immortalisation drives significant changes in the proteome of BMDMs.
(A) Volcano plot displaying t test data of WT iBMDMs versus WT BMDMs (log2 fold change > 1 or < −1; > 1.3 –log10 [adjusted P-value]). Top 20 up- or down-regulated proteins are annotated. (B, C) Analysis of WT iBMDMs versus WT BMDMs shows the top suppressed or induced (B) hallmark gene sets defined by MSigDB and (C) gene sets defined by KEGG. (D, E) STRING analysis of the top 50 up- and down-regulated proteins in WT iBMDMs versus WT BMDMs.
Figure 4.
Figure 4.. J774A.1 cells hold the most similar proteome compared with WT BMDMs.
(A) Volcano plot displaying adjusted t test data of J774A.1 cells vs WT BMDMs (log2 fold change > 1 or < −1; > 1.3 –log10 [adjusted P-value]). Top 20 up- or down-regulated proteins are annotated. (B, C) Analysis of J774A.1 cells versus WT BMDMs shows the top suppressed or induced (B) hallmark gene sets defined by MSigDB and (C) gene sets defined by KEGG. (D, E) STRING analysis of the top 50 up- and down-regulated proteins in J774A.1 cells versus WT BMDMs.
Figure 5.
Figure 5.. Inflammatory response is altered in RAW264.7 cells compared with WT BMDMs.
(A) Volcano plot displaying t test data of RAW264.7 cells versus WT BMDMs (log2 fold change > 1 or < −1; > 1.3 –log10 [adjusted P-value]). Top 20 up- or down-regulated proteins are annotated. (B, C) Analysis of RAW264.7 cells versus WT BMDMs shows the top suppressed or induced (B) hallmark gene sets defined by MSigDB and (C) gene sets defined by KEGG. (D, E) STRING analysis of the top 50 up- and down-regulated proteins in RAW264.7 cells versus WT BMDMs.
Figure 6.
Figure 6.. BMA3.1A7 phenotype is significantly different to that of WT BMDMs.
(A) Volcano plot displaying t test data of BMA3.1A7 cells versus WT BMDMs (log2 fold change > 1 or < −1; > 1.3 –log10 [adjusted P-value]). Top 20 up- or down-regulated proteins are annotated. (B, C) Analysis of BMA3.1A7 cells versus WT BMDMs shows the top suppressed or induced (B) hallmark gene sets defined by MSigDB and (C) gene sets defined by KEGG. (D, E) STRING analysis of the top 50 up- and down-regulated proteins in BMA3.1A7 cells versus WT BMDMs.
Figure 7.
Figure 7.. Cell lines lack key proteins that are present in WT BMDMs.
Presence/absence was determined using the number of valid values identified by mass spectrometry for each protein. Presence was defined as three or more valid values (orange), and absence was defined as zero valid values (blue). Only proteins displaying four valid values in WT BMDMs were included. (A, B, C) Hierarchical clustering was performed in Perseus with the resulting heatmap separated into three main clusters (A, B, C). N = 4.
Figure S6.
Figure S6.. Flow cytometry validation of IFNGR1 and IFNGR2 expression on the surface of various macrophage models.
(A, B) Surface expression level of (A) IFNGR1-PE and (B) IFNGR2-APC was compared between WT BMDMs, J774A.1, RAW264.6, BMA3.1A7, and iBMDMs. Representative image of duplicate experiments.
Figure S7.
Figure S7.. Boxplot of median normalised log2 intensity values of BALB/c and C57BL/6J.
Figure S8.
Figure S8.. Correlation plot of BALB/c and C57BL/6J mass spectrometry results.
Figure S9.
Figure S9.. BALB/c and C57BL/6J BMDMs cluster separately.
Principal component analysis plot of BALB/c and C57BL/6J BMDMs. Ellipses represent the 95% confidence interval. N = 4.
Figure 8.
Figure 8.. Comparison of the proteomes of BALB/c and C57BL/6J BMDMs.
(A) Volcano plot displaying proteomic data of BALB/c BMDMs versus C57BL/6J BMDMs (log2 fold change > 1 or < −1; > 1.3 –log10 [adjusted P-value]). Top 20 up- or down-regulated proteins are annotated. (B) GSEA of BALB/c BMDMs versus C57BL/6J BMDMs showing the suppressed or induced hallmark gene sets defined by MSigDB. (C, D) STRING analysis of the significantly up- and down-regulated proteins in BALB/c BMDMs versus C57BL/6J BMDMs; clusters were identified using the Markov Cluster Algorithm method.
Figure 9.
Figure 9.. Comparison of the phagocytic ability of macrophage cell lines compared with primary macrophages.
(A, B) Percentage of phagocytosis of Escherichia coli DH5α (DH5α), Salmonella enterica subsp. enterica serovar Typhimurium (STM), and Staphylococcus aureus (SA) by cell lines (J774A.1, RAW264.7, iBMDM, BMA3.1A7) and primary macrophages isolated from C57BL/6J WT, Msr1−/−, and BALB/c mouse bone marrow. The assay measures CFUs of phagocytosed bacteria at 1-h post-infection of the respective cell lines or primary macrophages and is normalised to the CFUs in the pre-inoculum to calculate the percentage of phagocytosis. *P < 0.05; ***P < 0.001; ****P < 0.0001; ns, not significant; by ordinary two-way ANOVA. N = 4. (C) Phagocytosis of Alexa Fluor 488–labelled carboxylated beads by BMDMs from WT C57BL/6J and Msr1−/− BMDMs, and cell lines (J774A.1, RAW264.7 and BMA3.1A7, and iBMDM); the assay measures relative fluorescent units; trypan blue was used to quench the fluorescence from extracellular beads. ****P < 0.0001 by ordinary one-way ANOVA. N = 5.
Figure 10.
Figure 10.. Response to pro-inflammatory (IFN-γ and LPS) or anti-inflammatory (IL-4) stimuli differs between macrophage models.
(A, B, C, D) Fold change in expression, measured by RT–qPCR, of (A) Il-1β, (B) iNos, (C) Il-6, and (D) Arg1 after stimulation with IFN-γ (20 ng/ml, 16 h), LPS (100 ng/ml, 16 h), or IL-4 (20 ng/ml, 48 h). *P < 0.05; ***P < 0.001; ****P < 0.0001 by ordinary one-way ANOVA. N = 4.

Similar articles

Cited by

References

    1. Abdelaziz MH, Abdelwahab SF, Wan J, Cai W, Huixuan W, Jianjun C, Kumar KD, Vasudevan A, Sadek A, Su Z, et al. (2020) Alternatively activated macrophages; a double-edged sword in allergic asthma. J Transl Med 18: 58. 10.1186/s12967-020-02251-w - DOI - PMC - PubMed
    1. Anwar A, Keating AK, Joung D, Sather S, Kim GK, Sawczyn KK, Brandão L, Henson PM, Graham DK (2009) Mer tyrosine kinase (MerTK) promotes macrophage survival following exposure to oxidative stress. J Leukoc Biol 86: 73–79. 10.1189/JLB.0608334 - DOI - PMC - PubMed
    1. Assouvie A, Daley-Bauer LP, Rousselet G (2018) Growing murine bone marrow-derived macrophages. In Macrophages: Methods and Protocols, Rousselet G (ed.), pp 29–33. New York, NY: Springer. - PubMed
    1. Azad AK, Rajaram MVS, Schlesinger LS (2014) Exploitation of the macrophage mannose receptor (CD206) in infectious disease diagnostics and therapeutics. J Cytol Mol Biol 1: 1000003. 10.13188/2325-4653.1000003 - DOI - PMC - PubMed
    1. Banete A, Achita P, Harding K, Mulder R, Basta S (2015) Immortalized murine macrophage cell line as a model for macrophage polarization into classically activated M(IFNγ+LPS) or alternatively activated M(IL-4) macrophages. J Clin Cell Immunol 6: 318. 10.4172/2155-9899.1000318 - DOI

LinkOut - more resources