. 2025 Jan 22;45(4):e2189232024.
doi: 10.1523/JNEUROSCI.2189-23.2024.

Repetitive Sensory Stimulation Potentiates and Recruits Sensory-Evoked Cortical Population Activity

Affiliations

Repetitive Sensory Stimulation Potentiates and Recruits Sensory-Evoked Cortical Population Activity

Leena Eve Williams et al. J Neurosci. .

Abstract

Sensory experience and learning are thought to be associated with plasticity of neocortical circuits. Repetitive sensory stimulation can induce long-term potentiation (LTP) of cortical excitatory synapses in anesthetized mice; however, it is unclear if these phenomena are associated with sustained changes in activity during wakefulness. Here we used time-lapse, calcium imaging of layer (L) 2/3 neurons in the primary somatosensory cortex (S1), in awake male mice, to assess the effects of a bout of rhythmic whisker stimulation (RWS) at a frequency by which rodents sample objects. We found that RWS induced a 1 h increase in whisker-evoked L2/3 neuronal activity in most cells. This was not observed for whiskers functionally connected to distant cortical columns. We also found that RWS could heterogeneously recruit or suppress whisker-evoked activity in different populations of neurons. Vasoactive intestinal-peptide-expressing (VIP) interneurons, which promote plasticity through disinhibition of pyramidal neurons, were found to exclusively elevate activity during RWS. These findings indicate that cortical neurons' representation of sensory input can be modulated over hours through repetitive sensory stimulation, which may be gated by activation of disinhibitory circuits.

Keywords: VIP interneurons; barrel cortex; disinhibition; long-term potentiation; somatosensory cortex; synaptic plasticity.


Conflict of interest statement

The authors declare no competing financial interests.

Figures

Figure 1.
Figure 1.
PRWS potentiates whisker-evoked responses in L2/3 neurons. A, Left, Examples of averaged baseline and stimulus-related raw iOS images, evoked by one train of whisker deflections. Right, Example barrel map overlayed over a bright-field image of the blood vessels. Green dots represent the location of GCaMP6s-expressing cells in the C2 barrel column. B, Average 2PLSM image of GCaMP6s-expressing neurons. C, Experimental design: the PW, which corresponds to the barrel column containing the GCaMP6s-expressing cells, is always used to read out the sensory stimulus-evoked response. The PW for PRWS (blue) or a control far-away whisker (CW) for CRWS (orange) is stimulated during rhythmic whisker stimulation (RWS, 8 Hz, 10 min). D, Experimental protocol: the PW is stimulated at 0.1 Hz for 10 min (600 s) pre- and post-RWS. RWS (8 Hz, 10 min) is performed on either the PW (PRWS, blue) or a far-away CW (CRWS, orange). E, F, Left, Example trace of the GCaMP6s fluorescence, in response to PW stimulation (0.1 Hz, 10 min) pre- and post-PRWS (E) or CRWS (F). The signals in E are from the cell circled in B. Right, The PW-evoked response strength (RS, amplitude × whisker-evoked signal probability (ΔF/F0)/NStim) pre- and post-PRWS (E, n = 1,099 cells; **p = 0.002; N = 11 mice; p = 0.5; pre = 0.060 ± 0.007; post = 0.070 ± 0.005) or CRWS (F, n = 829 cells; p = 0.4; N = 11 mice; p = 0.6; pre = 0.08 ± 0.01; post = 0.08 ± 0.08). Gray lines, paired responses. Violin plots depict median (solid) and quartiles (dotted) bars. Squares, the mean over cells (±SEM). Circles, the mean over mice (±SEM). G, Pre- versus post-RWS RS [(ΔF/F0)/NStim] with the simple linear regression for PRWS (blue, n = 1,099 cells) and CRWS (orange, n = 829 cells). Comparing slopes (PRWS = 0.62 ± 0.014; CRWS = 0.85 ± 0.019; F = 92.9; DFn = 1; DFd = 1,924; ****p < 0.0001). H, Frequency distribution of the pre-RWS RS for PRWS & CRWS, bin size 0.01 (ΔF/F0)/NStim. High responders (resp) were identified as outliers (dots above, iterative Grubb's outlier test; a = 0.0001). I, J, Violin plot of the RS pre- and post-PRWS and CRWS, for low and moderate responders (I, PRWS, n = 1,058 cells, ****p < 0.0001; N = 11 mice, p = 0.006, pre = 0.030 ± 0.002, post = 0.050 ± 0.006; CRWS, n = 792 cells, p = 0.3; N = 11 mice, p = 0.7, pre = 0.050 ± 0.005, post = 0.050 ± 0.006) and for high responders (J, PRWS, paired t test, n = 41 cells, ***p = 0.0008; N = 11 mice, p = 0.04, pre = 0.75 ± 0.11, post = 0.05 ± 0.10; CRWS, n = 37 cells, ****p < 0.0001; N = 11 mice, p = 0.0001, pre = 0.76 ± 0.14, post = 0.55 ± 0.14). K, The pre-RWS/post-RWS ratio (in %) for PRWS and CRWS low and moderate and high responders (mixed effects model, N = 11 mice, p = 0.0004; multiple comparisons: PRWS low and moderate vs high, ***p = 0.0004; CRWS low and moderate vs high, p = 0.1; low and moderate PRWS vs CRWS, *p = 0.018; high PRWS vs CRWS, p = 0.7).
Figure 2.
Figure 2.
Whisker movements during the stimulus protocol. A, Calculating the whisker movement index (MI, arbitrary units, a.u.). Left, Whiskers of mice were imaged at 112 Hz using a CCD digital camera placed under the snout. Right, ROIs were drawn spanning whiskers ipsi- (purple) and contralateral (pink) to the capillary tube. Control ROIs (gray) were drawn within these ROIs. To estimate whisker movement, the pixel intensity of each individual frame (orange) was correlated to the average intensity across the entire movie (green). B, Calculating mean overall whisker movement. Left, MI of the ipsilateral whiskers across the 10 min protocol pre- (red) and post-RWS (blue) for one mouse, with control traces overlayed (black) to illustrate background noise. Stimulations are marked in gray. Right, Same but for contralateral whiskers. C, Normalized mean MI for the ipsi- and contralateral whiskers of four mice pre- and post-RWS (ipsi pre = 1.0, post = 0.98 ± 0.03; contra pre = 1.19 ± 0.11, post = 1.12 ± 0.09; one-way ANOVA; p = 0.24). D, Calculating stimulus-evoked whisker movement pre- and post-RWS. Schematic illustrating the calculation of the average MI 2 s (224 frames) before the start of a stimulus (from dashed box in B) and 2 s after the end of the stimulus. E, Comparing ipsilateral whisker movement before and after the stimulus. Left, Normalized mean MI for each mouse for ipsilateral whiskers (left, pre before = 1.0, after = 0.86 ± 0.06; post before = 0.93 ± 0.01, after = 0.90 ± 0.07; one-way ANOVA; p = 0.25). Right, Scatterplot comparing the MI of ipsilateral whiskers before and after stimulus presentation pre- (n = 236 stims; r = 0.47; p < 0.0001) and post-RWS (n = 236 stims; r = 0.47; p < 0.0001). F, Comparing contralateral whisker movement before and after the stimulus. Left, Normalized mean MI for each mouse for contralateral whiskers (right, pre before = 1.0, after = 0.93 ± 0.05; post before = 0.95 ± 0.05, after = 0.89 ± 0.06; one-way ANOVA; p = 0.44) whiskers. Right, Scatterplot comparing the MI of contralateral whiskers before and after stimulus presentation pre- (n = 236 stims; r = 0.43; p < 0.0001) and post-RWS (n = 236 stims; r = 0.44; p < 0.0001).
Figure 3.
Figure 3.
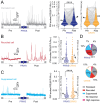
PRWS recruits L2/3 neurons to the active pool. A, Left, Example trace of GCaMP6s fluorescence from a neuron showing persistent PW-evoked responses (0.1 Hz, 10 min) pre- and post-PRWS. Right, Violin and pairwise representation of pre- and post-PRWS (n = 465 cells, ****p < 0.0001; N = 11 mice, p = 0.003, pre = 0.060 ± 0.004, post = 0.090 ± 0.008) or CRWS (paired t test, n = 279 cells, p = 0.06; N = 11 mice, p = 0.2, pre = 0.080 ± 0.006, post = 0.096 ± 0.008). B, C, Left, Example trace of GCaMP6s fluorescence from neurons of which responses were recruited (B) or suppressed (C) post-PRWS. B, Right, The mean PW-evoked response strength (RS) of recruited neurons, post-PRWS (n = 307 cells) and CRWS (unpaired t test, n = 131 cells, p = 0.1; N = 11 mice, p = 0.5, PRWS = 0.040 ± 0.007, CRWS = 0.050 ± 0.01). C, Right, The mean response strength of suppressed neurons pre-PRWS (n = 205 cells) and CRWS (unpaired t test, n = 258 cells, ****p < 0.0001; N = 11 mice p = 0.037 PRWS = 0.025 ± 0.004, CRWS = 0.030 ± 0.005). D, Pie charts with the percentages (%) of persistent (gray), recruited (red), suppressed (blue), no response (white), and high (pink) responders for PRWS (n = 1,099 cells) and CRWS (n = 829 cells; chi-square = 19.8; DF = 4; ***p < 0.0001).
Figure 4.
Figure 4.
Longitudinal imaging upon RWS. A, Raster plot of GCaMP6s fluorescence intensity (ΔF/F0) for PRWS at each acquisition for pre-PRWS (−10 min) and post-PRWS (10, 60, 120, and 180 min). Neurons sorted from top to bottom by decreasing response strength pre- versus post-PRWS (n = 410 cells). Arrowheads, examples of the five subpopulations: persistent (persist.), recruited (recruit.), suppressed (suppr.), no response (no resp.), and high (hi resp.) responders. B, Top, Example 2PLSM images of neurons expressing AAV1-hSyn-mRubyGSG-P2A-GCaMP6s across the longitudinal experimental protocol −10 min pre-PRWS, and 10, 60, 120, and 180 min post-PRWS. mRuby (red) serves as an activity-independent marker, whereas GCaMP6s (green) reports Ca2+ signals upon PW stimulation. The lower images represent high magnifications of the cells in the square inset on top. B, Bottom, PW-evoked RS pre-PRWS (−10 min) or CRWS and post-PRWS or CRWS (10, 60, 120, and 180 min; PRWS n = 382 cells, or CRWS n = 304 cells; two-way RM ANOVA, ***p = 0.0006; N = 6 mice; p = 0.026). Multiple comparisons for PRWS (Dunnett's, −10 min vs 10 min ****p < 0.0001; or 60 min ***p = 0.0001). C, PW-evoked Ca2+ signal probability (PS [#events/NStim]; PRWS n = 382 cells, CRWS n = 304 cells; two-way RM ANOVA, ****p < 0.0001; N = 6 mice; p = 0.026). Multiple comparisons for PRWS (Dunnett's, −10 min vs 10 min ****p < 0.0001; or 60 min **p = 0.001; or 120 min p = 0.7; or 180 min p = 0.99) and CRWS (−10 min vs 10 min p = 0.99; or 60 min, p = 0.3; or 120 min p = 0.2; or 180 min p = 0.3). D, PW-evoked Ca2+ signal amplitudes (ĀSF/F0]; PRWS n = 382 cells, CRWS n = 304 cells; two-way RM ANOVA; ****p < 0.0001; N = 6; p = 0.25). Multiple comparisons for PRWS (Dunnett's, −10 min vs 10 min *p = 0.01; or 60 min **p = 0.002; or 120 min p = 0.8; or 180 min p = 0.4) and CRWS (−10 min vs 10 min p = 0.2; or 60 min p = 0.6; or 120 min p = 0.1; or 180 min p = 0.5). E, PW-evoked response strength, pre- and 24 h post-PRWS or CRWS (PRWS n = 162 cells, CRWS n = 134 cells; two-way RM ANOVA, p = 0.36; PRWS 3 mice, CRWS 2 mice, p = 0.054).
Figure 5.
Figure 5.
RWS selectively activates L2/3 neurons. A, B, Left, Example traces of GCaMP6s (black) or mRuby fluorescence (red) for a 20 s baseline before and during PRWS or CRWS. Violin and pairwise representation of fluorescence intensities (integrated over 20 s; violin plot median, white bar; quartiles, dotted bars) baseline versus PRWS (n = 290 cells, paired t test, ****p < 0.0001; N = 3 mice, p = 0.027, baseline = 0.18 ± 0.13, PRWS = 0.30 ± 0.11) or CRWS (n = 115 cells, paired t test, p = 0.6; N = 3 mice, p = 0.8, baseline = 0.5 ± 0.03, CRWS = 0.5 ± 0.08). C, Fluorescence intensity (integrated over 20 s) during PRWS versus PW-evoked response strength change (post/pre; n = 115 cells; Pearson’s r correlation; r = 0.0002; p = 1.0). Inset, pre- and post-PRWS response strength (n = 115 cells; pre = 0.027 ± 0.002; post = 0.031 ± 0.002; paired t test; p = 0.027). D, Fluorescence intensity during PRWS (integrated over 20 s) versus pre-PRWS. Pink line simple linear regression, black dotted lines 95% confidence intervals (n = 115 cells, Pearson’s r correlation, r = −0.35, ***p = 0.0001; simple linear regression, slope = −0.008, nonzero? p = 0.0001).
Figure 6.
Figure 6.
RWS nonselectively activates VIP interneurons. A, Left, Example 2PLSM image of flex.mRuby.GCaMP6s-expressing VIP interneurons in the VIP-Cre mouse line. Right, Representative confocal image after post hoc anti-VIP immunocytochemistry on slices of barrel cortex from 2PLSM imaged VIP-Cre mice (green, anti-VIP; red, AAV1.CAG.Flex.mRuby.P2A.GCaMP6s; blue, Hoechst staining). B, Pre-RWS PW-evoked response strength (RS) of VIP interneurons (n = 341 cells; N = 7 mice; VIP = 0.15 ± 0.04), and low and moderate (n = 1,058 cells; N = 11 mice; low/mod = 0.030 ± 0.002) and high (n = 41; N = 11 mice; high = 0.030 ± 0.002; one-way ANOVA; ****p < 0.0001) responding L2/3 neurons. Squares and circles represent the means ± SEM over cells and mice, respectively. C, Left, Example trace of GCaMP6s (black) or mRuby fluorescence from a VIP interneuron, pre- and post-PRWS. Right, Pre- and post-PRWS PW-evoked RS of VIP neurons (paired t test, n = 341 cells, p = 0.2; N = 7 mice, p = 0.45, pre = 0.14 ± 0.04, post = 0.13 ± 0.02). Gray lines, paired responses. Violin plots depict median (solid) and quartiles (dotted) bars. D, E, Left, Example trace of GCaMP6s fluorescence (black) or mRuby (integrated over 20 s) from a VIP interneuron before and during PRWS (D) or CRWS (E). Right, Paired response and violin plots of normalized fluorescence intensity (norm.) during baseline, PRWS (paired t test, n = 341 cells, ****p < 0.0001; N = 7 mice, p = 0.047, baseline = 0.31 ± 0.07, PRWS = 0.61 ± 0.10) or CRWS (paired t test, n = 231 cells, ****p < 0.0001; N = 5 mice, p = 0.08, baseline = 0.04 ± 0.09, CRWS = 1.15 ± 0.38). F, VIP interneurons were imaged at two planes in top layers of S1, plane (P) 1 is closest to the pia and P2 is 100 µm below. G, H, Left, Average VIP interneuron GCaMP6s fluorescence for P1 (darker green) and P2 (light green) for baseline (integrated over 20 s) and during PRWS (G) or CRWS (H). Right, Normalized integrated fluorescence intensities during PRWS (G, P1 vs P2, paired t test, **p = 0.006) or CRWS (H, P1 vs P2, paired t test, p = 0.18). I, Circuit diagram summarizing the RWS-evoked plasticity model. PRWS (blue) activates first-order thalamocortical (TC; red) as well as higher-order TC and feedback inputs (green), which activate disinhibitory VIP interneurons (gray). These combined inputs drive a potentiation of PW-evoked responses and a recruitment of neuronal responsivity (28%). CRWS (orange) may only activate higher-order TC and feedback inputs, also activating disinhibitory VIP interneurons, but this is not sufficient to drive potentiation and favors suppression of neurons (30%).

Similar articles

References

    1. Ayzenshtat I, Karnani MM, Jackson J, Yuste R (2016) Cortical control of spatial resolution by VIP+ interneurons. J Neurosci 36:11498–11509. 10.1523/JNEUROSCI.1920-16.2016 - DOI - PMC - PubMed
    1. Brandalise F, Carta S, Leone R, Helmchen F, Holtmaat A, Gerber U (2022) Dendritic branch-constrained N-methyl-d-aspartate receptor-mediated spikes drive synaptic plasticity in hippocampal CA3 pyramidal cells. Neuroscience 489:57–68. 10.1016/j.neuroscience.2021.10.002 - DOI - PubMed
    1. Brecht M, Roth A, Sakmann B (2003) Dynamic receptive fields of reconstructed pyramidal cells in layers 3 and 2 of rat somatosensory barrel cortex. J Physiol 553:243–265. 10.1113/jphysiol.2003.044222 - DOI - PMC - PubMed
    1. Carvell GE, Simons DJ (1990) Biometric analyses of vibrissal tactile discrimination in the rat. J Neurosci 10:2638–2648. 10.1523/JNEUROSCI.10-08-02638.1990 - DOI - PMC - PubMed
    1. Chen TW, et al. (2013) Ultrasensitive fluorescent proteins for imaging neuronal activity. Nature 499:295–300. 10.1038/nature12354 - DOI - PMC - PubMed

Substances

LinkOut - more resources