

Enhancing the diagnostic capacity of [18F]PSMA-1007 PET/MRI in primary prostate cancer staging with artificial intelligence and semi-quantitative DCE: an exploratory study
- PMID: 39510993
- PMCID: PMC11543981
- DOI: 10.1186/s41824-024-00225-5
Enhancing the diagnostic capacity of [18F]PSMA-1007 PET/MRI in primary prostate cancer staging with artificial intelligence and semi-quantitative DCE: an exploratory study
Abstract
Background: To investigate the ability of artificial intelligence (AI)-based and semi-quantitative dynamic contrast enhanced (DCE) multiparametric MRI (mpMRI), performed within [18F]-PSMA-1007 PET/MRI, in differentiating benign from malignant prostate tissues in patients with primary prostate cancer (PC).
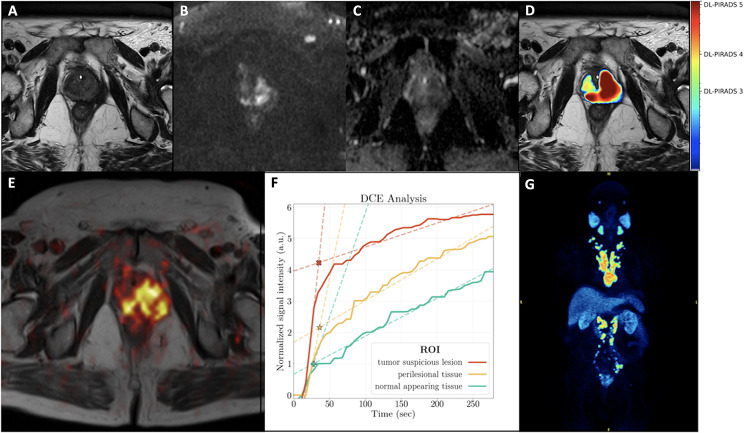
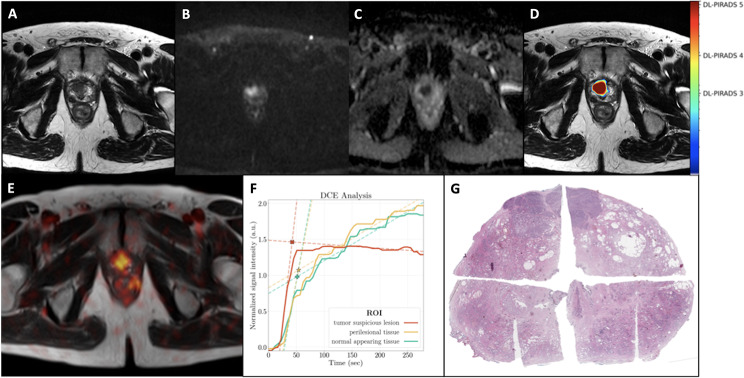
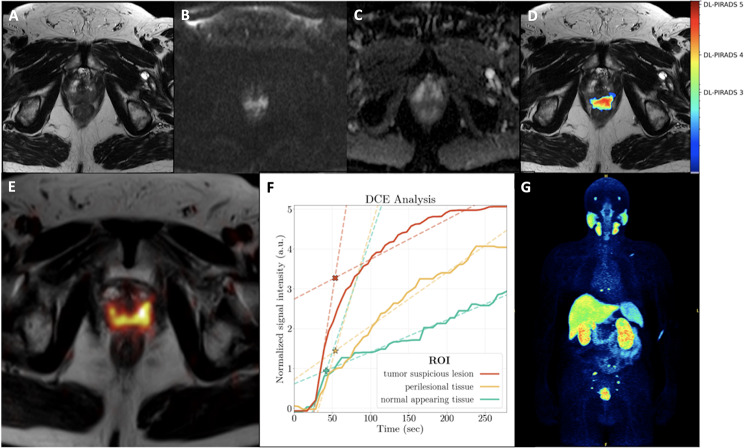
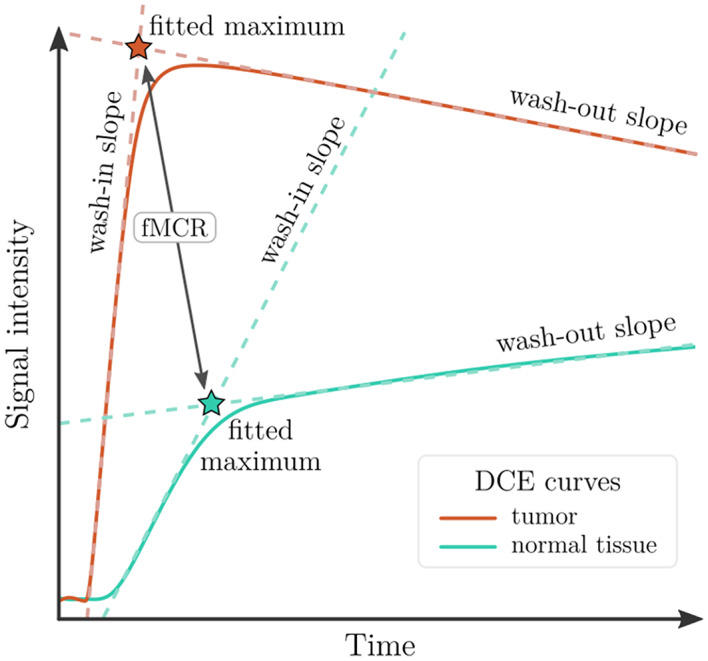
Results: A total of seven patients underwent whole-body [18F]-PSMA-1007 PET/MRI examinations including a pelvic mpMRI protocol with T2w, diffusion weighted imaging (DWI) and DCE image series. Conventional analysis included visual reading of PET/MRI images and Prostate Imaging Reporting & Data System (PI-RADS) scoring of the prostate. On the prostate level, we performed manual segmentations for time-intensity curve parameter formation and semi-quantitative analysis based on DCE segmentation data of PC-suspicious lesions. Moreover, we applied a recently introduced deep learning (DL) pipeline previously trained on 1010 independent MRI examinations with systematic biopsy-enhanced histopathological targeted biopsy lesion ground truth in order to perform AI-based lesion detection, prostate segmentation and derivation of a deep learning PI-RADS score. DICE coefficients between manual and automatic DL-acquired segmentations were compared. On patient-based analysis, PET/MRI revealed PC-suspicious lesions in the prostate gland in 6/7 patients (Gleason Score-GS ≥ 7b) that were histologically confirmed. Four of these patients also showed lymph node metastases, while two of them had bone metastases. One patient with GS 6 showed no PC-suspicious lesions. Based on DCE segmentations, a distinction between PC-suspicious and normal appearing tissue was feasible with the parameters fitted maximum contrast ratio (FMCR) and wash-in-slope. DICE coefficients (manual vs. deep learning) were comparable with literature values at a mean of 0.44. Further, the DL pipeline could identify the intraprostatic PC-suspicious lesions in all six patients with clinically significant PC.
Conclusion: Firstly, semi-quantitative DCE analysis based on manual segmentations of time-intensity curves was able to distinguish benign from malignant tissues. Moreover, DL analysis of the MRI data could detect clinically significant PC in all cases, demonstrating the feasibility of AI-supported approaches in increasing diagnostic certainty of PSMA-radioligand PET/MRI.
Keywords: 18F-PSMA-1007; AI; DCE; PET/MRI; Primary staging; Prostate cancer.
© 2024. The Author(s).
Conflict of interest statement
The authors have no relevant financial or non-financial interests to disclose regarding this topic.
Figures
Similar articles
-
The Role of Dynamic Contrast Enhanced Magnetic Resonance Imaging in Evaluating Prostate Adenocarcinoma: A Partially-Blinded Retrospective Study of a Prostatectomy Patient Cohort With Whole Gland Histopathology Correlation and Application of PI-RADS or TNM Staging.Prostate. 2025 Apr;85(5):413-423. doi: 10.1002/pros.24843. Epub 2024 Dec 19. Prostate. 2025. PMID: 39702937 Free PMC article.
-
Deep Learning-Based DCE-MRI Automatic Segmentation in Predicting Lesion Nature in BI-RADS Category 4.J Imaging Inform Med. 2025 Aug;38(4):2053-2062. doi: 10.1007/s10278-024-01340-2. Epub 2024 Nov 25. J Imaging Inform Med. 2025. PMID: 39586911 Free PMC article.
-
The diagnostic accuracy and cost-effectiveness of magnetic resonance spectroscopy and enhanced magnetic resonance imaging techniques in aiding the localisation of prostate abnormalities for biopsy: a systematic review and economic evaluation.Health Technol Assess. 2013 May;17(20):vii-xix, 1-281. doi: 10.3310/hta17200. Health Technol Assess. 2013. PMID: 23697373 Free PMC article.
-
Diagnostic value of [18F]PSMA-1007 PET/CT based on PRIMARY score combined with mpMRI in clinically significant prostate cancer.Front Oncol. 2025 Jun 18;15:1589212. doi: 10.3389/fonc.2025.1589212. eCollection 2025. Front Oncol. 2025. PMID: 40606999 Free PMC article.
-
123I-MIBG scintigraphy and 18F-FDG-PET imaging for diagnosing neuroblastoma.Cochrane Database Syst Rev. 2015 Sep 29;2015(9):CD009263. doi: 10.1002/14651858.CD009263.pub2. Cochrane Database Syst Rev. 2015. PMID: 26417712 Free PMC article.
Cited by
-
Integration of prostate-specific membrane antigen-PET and multiparametric MRI for gross tumour volume definition in localised and locally advanced prostate cancer treated with image-guided radiotherapy.Curr Opin Urol. 2025 Sep 1;35(5):554-561. doi: 10.1097/MOU.0000000000001321. Epub 2025 Jul 15. Curr Opin Urol. 2025. PMID: 40665782 Free PMC article. Review.
References
-
- Bonekamp D, Macura KJ (2008) Dynamic contrast-enhanced magnetic resonance imaging in the evaluation of the prostate. Top Magn Reson Imaging 19:273–284 - PubMed
-
- Bonekamp D, Kohl S, Wiesenfarth M, Schelb P, Radtke JP, Götz M et al (2018) Radiomic Machine Learning for Characterization of Prostate Lesions with MRI: comparison to ADC values. Radiology 289:128–137 - PubMed
-
- Bonekamp D, Schelb P, Wiesenfarth M, Kuder TA, Deister F, Stenzinger A et al (2019) Histopathological to multiparametric MRI spatial mapping of extended systematic sextant and MR/TRUS-fusion-targeted biopsy of the prostate. Eur Radiol 29:1820–1830 - PubMed
LinkOut - more resources
Full Text Sources
Research Materials
Miscellaneous