Meta-Analysis
. 2024 Nov 7;15(1):9424.
doi: 10.1038/s41467-024-53467-z.

Genome-wide meta-analysis conducted in three large biobanks expands the genetic landscape of lumbar disc herniations

Collaborators, Affiliations
Meta-Analysis

Genome-wide meta-analysis conducted in three large biobanks expands the genetic landscape of lumbar disc herniations

Ville Salo et al. Nat Commun. .

Abstract

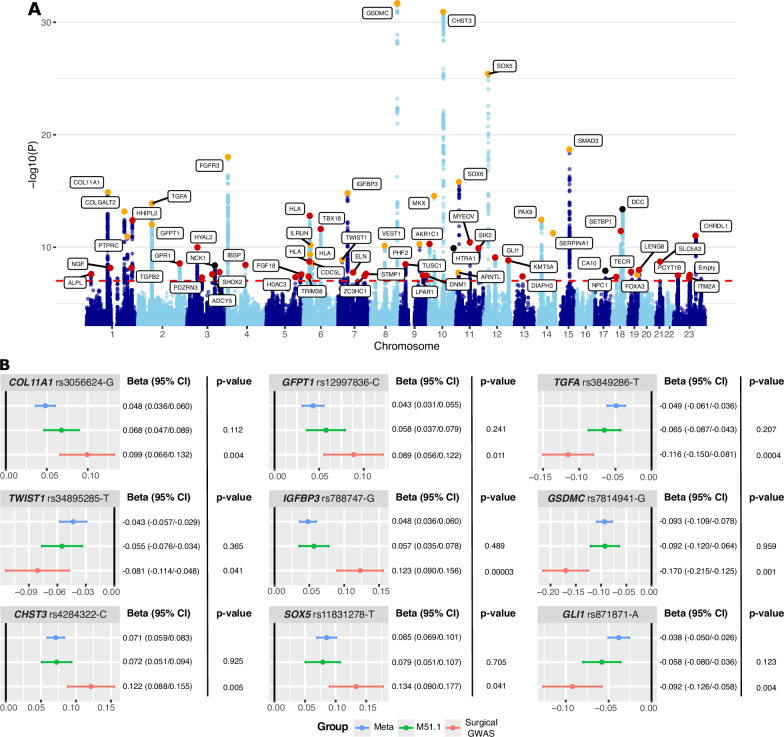
Given that lumbar disc herniation (LDH) is a prevalent spinal condition that causes significant individual suffering and societal costs, the genetic basis of LDH has received relatively little research. Our aim is to increase understanding of the genetic factors influencing LDH. We perform a genome-wide association analysis (GWAS) of LDH in the FinnGen project and in Estonian and UK biobanks, followed by a genome-wide meta-analysis to combine the results. In the meta-analysis, we identify 41 loci that have not been associated with LDH in prior studies on top of the 23 known risk loci. We detect LDH-associated loci in the vicinity of genes related to inflammation, disc-related structures, and synaptic transmission. Overall, our research contributes to a deeper understanding of the genetic factors behind LDH, potentially paving the way for the development of new therapeutics, prevention methods, and treatments for symptomatic LDH in the future.


Conflict of interest statement

The authors declare no competing interests.

Figures

Fig. 1
Fig. 1. Manhattan plot and lead variant effect size comparison with sensitivity analyses.
A The Manhattan plot of the genome-wide meta-analysis of LDH with 80 724 cases and 748 975 controls. Previously reported loci are indicated with orange colour, 37 previously unreported loci are highlighted in red, and 4 unreported loci for LDH, but previously associated with back pain are indicated with black. Candidate genes possibly explaining the LDH associations were used as loci identifiers. The red dashed line depicts the genome-wide significance limit (p < 5 × 10−8). B A comparison of the effect sizes of the lead variants discovered in the original meta-analysis (ICD-10:M51: 80 724 cases, 748 975 controls, [blue]), and in sensitivity analyses with more strict case definitions (ICD-10:M51.1: 18 857 cases, 270 964 controls, [green] or a surgery: 7347 cases, 270 964 controls, [red]). Dots indicate effect size and vertical lines are the corresponding 95% confidence intervals. For effect differences statistical comparison, we used a two-tailed test, using group-specific effect estimates of the variants and the corresponding standard errors diff = ((Effect_Meta-Effect_M51.1)/sqrt(standarderror_Meta2+standarderror_M51.12)), P-value = 2*(1-diff). P-value < 0.05 was considered the limit of a significant effect size difference. Significant effect size differences were observed for nine variants in surgical GWAS compared to the original meta-analysis. No statistically significant effect differences were found between the meta-analysis and M51.1. Other variants can be seen in Supplementary Fig 43. Source data are provided in the Source Data file.
Fig. 2
Fig. 2. Results of functional analyses.
A MAGMA29 gene-based test in a Manhattan plot. X-axis chromosomes, y-axis -log10(p-value). B MAGMA gene-set enrichment analysis. The plot shows significantly (pFDR < 0.05) enriched pathways (pFDR < 0.05), curated gene sets, and GO-annotations ranked by p-value -log10(P). The size of the circles refers to the size of the gene set. Small grey < 15, blue 15–100, violet 100–200, and red > 200 genes. The analysis was done using FUMA. The gene sets and GO annotations are from MSigDB. C Colocalizations between LDH GWAS and eQTL signals were estimated with approximate Bayesian factor analyses, implemented with the ‘coloc.abf’ function available in the ‘coloc’ R-library. Candidate genes and genes closest to the association signal were selected for the analysis if the closest gene was a different gene than the candidate gene (Supplementary Table 7). Variant-gene expression associations for selected tissues (whole blood, cultured fibroblasts, tibial nerve, and cervical spinal cord), were downloaded from GTEx v8. Colocalizations with posterior probabilities ≥ 0.8 for the variant were considered significant. Source data are provided in Source Data file.
Fig. 3
Fig. 3. Cumulative LDH diagnoses.
Cumulative LDH diagnoses for (AGSDMC, B CHST3, C IGFBP3, D SOX6 variants in the Kaplan-Meier plots. Age in years is on the x-axis, and the corresponding fraction of the cases is on the y-axis. The orange line depicts homozygotes for the effect allele, the grey homozygotes for the other allele, and the blue line corresponds to heterozygotes having one copy of each allele. Additionally, candidate genes, rsid, CHR:POS, and alleles were used to identify variants in the plots. Analyses were conducted in FinnGen (n = 308 600); the exact survival rates and ranges are listed in the Source data. Cumulative diagnoses for the (AGSDMC and (BCHST3 variants before the age of 30 can be seen in more detail in Supplementary Fig 46. Corresponding plots obtained using the subset of cases with radiculopathy (M51.1) and data from Estonian Biobank are given in the supplementary information (Supplementary Fig 47, Supplementary Fig 48). CHR:POS, chromosome and position (genome build hg38). Source data are provided in Source Data file.
Fig. 4
Fig. 4. Genetic correlations (rg) between LDH and other traits.
Analyses were conducted using the LDSC-software, and analysis was done utilizing our meta-analysis summary statistics (N = 829 699). All traits were extracted from the GWAS database provided by the MRC-IEU database (n ranges from 7637 to 575 601; the trait-specific sample sizes are provided in Supplementary Data 3). Only the strongest observed (rg < −0.4 & rg> 0.45) correlations with a significant false discovery corrected p-value than(pFDR < 0.05) are shown in the figure. rg, genetic correlation coefficient value; pFDR, false discovery rate-corrected p-value. The forest plot visually represents observed rg (95% CI) values. Genetic correlations for all 437 phenotypes can be seen in Supplementary Data 3. Source data are provided in the Source Data file.
Fig. 5
Fig. 5. Exposures potentially causal for LDH (above, Supplementary Table 9), and outcomes that LDH was potentially found to be causal for (below, Supplementary Table 10).
The analysis was performed using the TwoSampleMR R library, and data from FinnGen LDH-GWAS results (N = 308 600) and MRC-IEU database (n ranges from 28 498 to 461 857; the trait-specific sample sizes are provided in Supplementary Table 11). Inverse variance weighted model was our primary analysis, for which statistical significance was considered at false discovery rate corrected p-value (pFDR) < 0.05. As a sensitivity analysis, we also performed analysis by using MR Egger. nsnp, number of SNP’s; OR (95% CI), odds ratio and its 95% confidence interval; Beta (95% CI), beta estimate and it’s 95% confidence interval; pFDR, false discovery rate-corrected p-value. The forest plot visually represents observed OR (95% CI) and Beta (95% CI). Source data are provided in Source Data file.

References

    1. Fardon, D. F. et al. Lumbar disc nomenclature: version 2.0. Spine J.14, 2525–2545 (2014). - PubMed
    1. Zhang, J. et al. Identification of lumbar disc disease hallmarks: a large cross-sectional study. Springerplus5, (2016). - PMC - PubMed
    1. Dower, A., Davies, M. A. & Ghahreman, A. Pathologic basis of lumbar radicular pain. World Neurosurg.128, 114–121 (2019). - PubMed
    1. Cosamalón-Gan, I. et al. Inflammation in the intervertebral disc herniation. Neurocirugia (Engl. Ed.)32, 21–35 (2021). - PubMed
    1. Patel, E. A. & Perloff, M. D. Radicular pain syndromes: cervical, lumbar, and spinal stenosis. Semin Neurol.38, 634–639 (2018). - PubMed

Publication types

MeSH terms

Supplementary concepts

LinkOut - more resources