. 2024 Nov 7;15(1):9621.
doi: 10.1038/s41467-024-53798-x.

TET2 germline variants promote kidney disease by impairing DNA repair and activating cytosolic nucleotide sensors

Affiliations

TET2 germline variants promote kidney disease by impairing DNA repair and activating cytosolic nucleotide sensors

Xiujie Liang et al. Nat Commun. .

Abstract

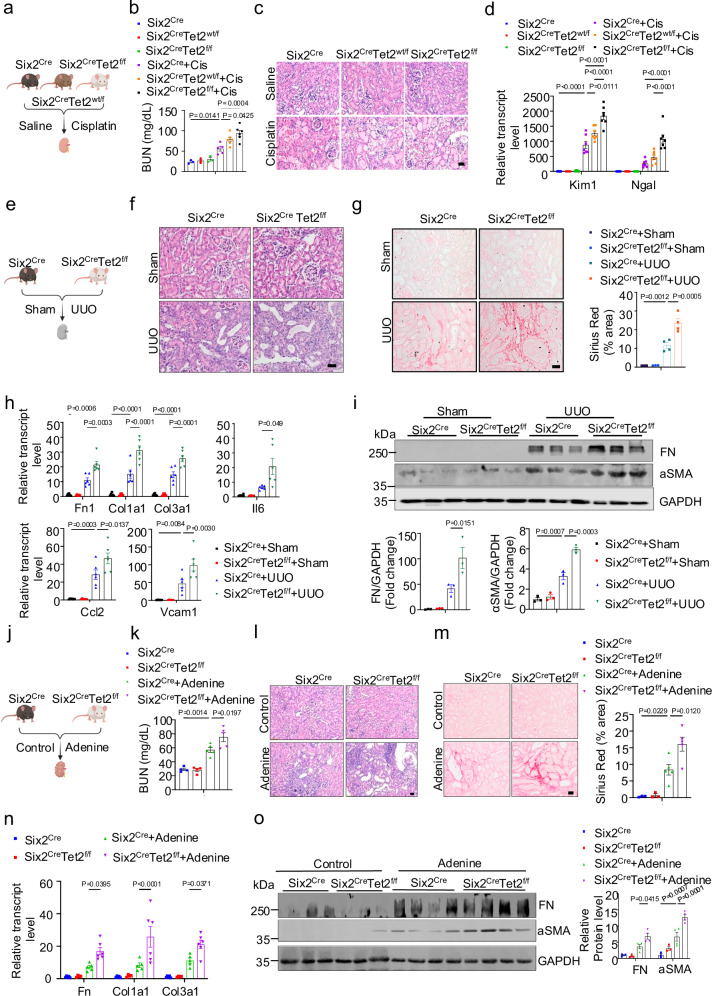
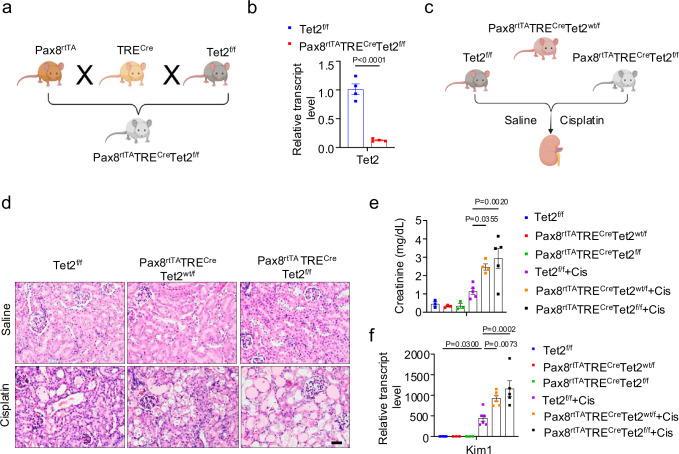
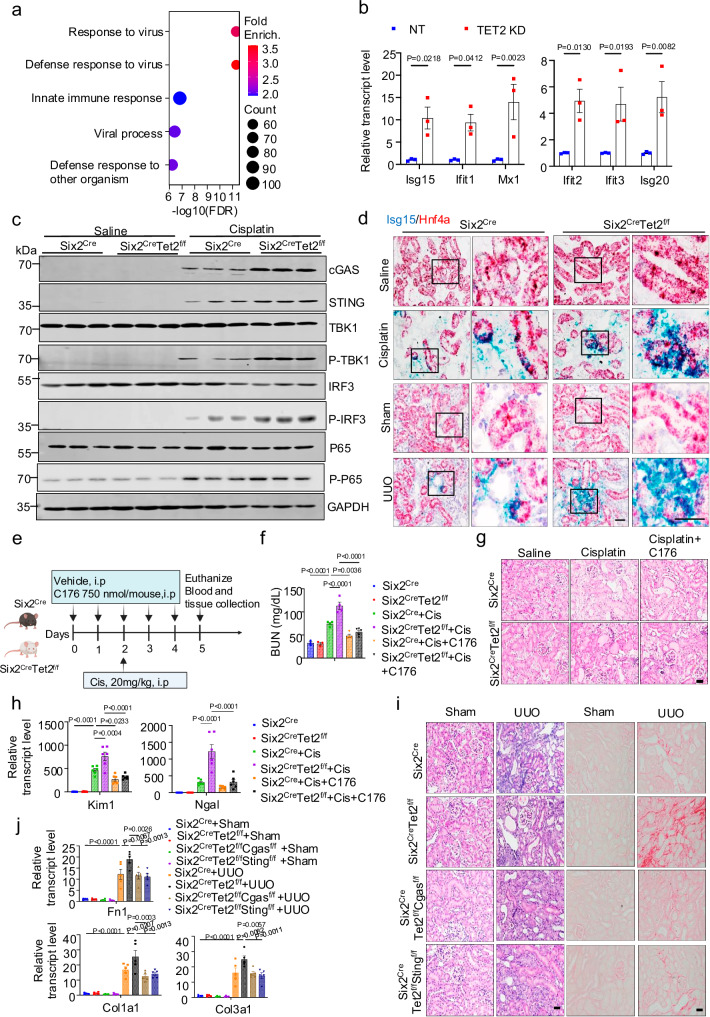
Genome-wide association studies (GWAS) have identified over 800 loci associated with kidney function, yet the specific genes, variants, and pathways involved remain elusive. By integrating kidney function GWAS with human kidney expression and methylation quantitative trait analyses, we identified Ten-Eleven Translocation (TET) DNA demethylase 2 (TET2) as a novel kidney disease risk gene. Utilizing single-cell chromatin accessibility and CRISPR-based genome editing, we highlight GWAS variants that influence TET2 expression in kidney proximal tubule cells. Experiments using kidney/tubule-specific Tet2 knockout mice indicated its protective role in cisplatin-induced acute kidney injury, as well as in chronic kidney disease and fibrosis induced by unilateral ureteral obstruction or adenine diet. Single-cell gene profiling of kidneys from Tet2 knockout mice and TET2-knockdown tubule cells revealed the altered expression of DNA damage repair and chromosome segregation genes, notably including INO80, another kidney function GWAS target gene itself. Remarkably, both TET2-null and INO80-null cells exhibited an increased accumulation of micronuclei after injury, leading to the activation of cytosolic nucleotide sensor cGAS-STING. Genetic deletion of cGAS or STING in kidney tubules, or pharmacological inhibition of STING, protected TET2-null mice from disease development. In conclusion, our findings highlight TET2 and INO80 as key genes in the pathogenesis of kidney diseases, indicating the importance of DNA damage repair mechanisms.


Conflict of interest statement

The Susztak lab is supported by Boehringer Ingelheim, Regeneron, Bayer, GSK, Gilead, Jnana, Maze, Novartis, ONO and Novo Nordisk for work that is unrelated to the current manuscript. The remaining authors declare no competing interests.

Figures

Fig. 1
Fig. 1. Identification of TET2 as a kidney disease risk gene.
a LocusZoom plots of eGFR GWAS (genotype and eGFRcrea association, n = 1,746,932) and fine mapping for chr4: 105,934,478-106,315,964. Each dot represents a SNP, with color indicating LD association. b LocusZoom plots of eGFR GWAS (genotype and eGFRcrea association, n = 2.2M), kidney CpG cg11878490 meQTL (genotype and cg11878490 methylation association, n = 443), and kidney TET2 eQTLs (genotype and TET2 expression association, n = 686). The y-axis displays the -log10 (p-values) of association tests from GWAS, meQTL, and eQTLs studies. c Genotype (rs6533181, x-axis) and normalized CpG methylation (cg11878490, y-axis) in human kidneys (n = 443). The effect size (Beta) is 0.51. Center line represents the median, the box limits show 25th and 75th percentiles, and whiskers extend to 5th and 95th percentiles. P-value was derived from linear regression meQTL model. d From top: Gene browser view of the eGFR GWAS SNPs in the specified regions; single-nucleus Assay for Transposase-Accessible Chromatin using sequencing (snATAC-seq) analysis of chromatin accessibility of human kidneys, including S1, S2, and S3 segments of the proximal tubules (PT-S1, PT-S2, PT-S3), loop of Henle (LOH), distal convoluted tubule (DCT), connecting tubule (CNT), intercalated cells (IC), collecting duct principal cell types (PC), podocytes (Podo), endothelial cells (Endo), immune cells (Immune), lymphocyte (Lymph). Human kidney histone modifications by chromatin immunoprecipitation (ChIP-seq) and chromatin states are also shown. e Relative transcript levels of TET2 after CRISPR-mediated deletion of the locus, with a sample size of n = 3. GAPDH was used for normalization. Data are shown as mean ± SEM and were analyzed using one-way ANOVA followed by Tukey’s post hoc test for multigroup comparison. The diagram was created with BioRender.com. Source data are provided as a Source Data file.
Fig. 2
Fig. 2. Tubule-specific Tet2 loss exacerbated renal injury and fibrosis.
a Experimental design. Six2Cre, Six2creTet2wt/f, and Six2creTet2f/f mice were injected with saline or cisplatin and euthanized 3 days later. Created with BioRender.com. b BUN levels were measured in Six2Cre, Six2creTetwt/f, and Six2creTet2f/f mice injected with saline (n = 3) or cisplatin (Six2Cre n = 5, Six2creTetwt/f n = 6, Six2creTet2f/f n = 6). c Representative images of H&E-stained kidneys sections from Six2Cre and Six2creTet2f/f mice injected with saline or cisplatin. d Relative transcript level of Kim1 and Ngal in kidneys of Six2Cre, Six2creTetwt/f, and Six2creTet2f/f mice injected with saline or cisplatin. Gapdh was used for normalization. Saline-injected group: Six2Cre (n = 6), Six2creTetwt/f (n = 4), and Six2creTet2f/f (n = 6). Cisplatin-injected groups: n = 7 each. e Experimental setup. Six2Cre and Six2creTet2f/f mice underwent sham-operation or unilateral ureteral obstruction (UUO) and were euthanized 4 days post-surgery. Created with BioRender.com. f Representative images of H&E-stained kidney sections from Six2Cre and Six2creTet2f/f mice subjected to sham-operation or UUO surgery. g Representative images of Sirius Red-stained kidney sections with quantification from Six2Cre and Six2creTet2f/f mice subjected to sham-operation or UUO surgery. Sham-operated group: Six2Cre (n = 4) and Six2creTet2f/f (n = 3); UUO-operated groups: n = 4 each. h Relative transcript levels of Fibronectin1 (Fn1), Collagen1a1 (Col1a1), Collagen1a1 (Col3a1), Interleukin 6 (Il6), C-C motif chemokine ligand 2 (Ccl2), and Vascular cell adhesion molecule 1 (Vcam1) in kidneys of Six2Cre and Six2creTet2f/f mice after sham-operation or UUO surgery (n = 6 per group). i Representative Western blots and densitometric quantification of FN and alpha-smooth muscle (aSMA) in kidneys of Six2Cre and Six2creTet2f/f mice subjected to sham-operation or UUO surgery (n = 3 biological replicates). j Experimental design for adenine-induced chronic kidney disease model. Six2Cre and Six2creTet2f/f mice were placed on control or adenine diet for 4 weeks. Created with BioRender.com. k Serum BUN levels in Six2Cre and Six2creTet2f/f mice on control (n = 4) or adenine diets (n = 5). l Representative images of H&E-stained kidney sections from Six2Cre and Six2creTet2f/f mice on control or adenine diet. m Representative images of Sirius Red-stained kidney sections with quantification from Six2Cre and Six2creTet2f/f mice on control (n = 3) or adenine diet (n = 5). n Relative transcript levels of Fn1, Col1a1, and Col3a1 in kidneys of Six2Cre and Six2creTet2f/f mice on a control diet (Six2Cre: n = 5; Six2creTet2f/f: n = 4) or adenine diet (Six2Cre: n = 5; Six2creTet2f/f: n = 6). o Representative Western blots and densitometric quantification of FN and aSMA in kidneys of Six2Cre and Six2creTet2f/f mice on a control diet (n = 3 per group) or an adenine diet (n = 4 per group). Scale bar = 20 μm. Data are presented as mean ± SEM and were analyzed using one-way ANOVA followed by Tukey’s post hoc test (b, d, g-i, k, m-o). Data are representative of three independent experiments (c,f,l). Source data are provided as a Source Data file.
Fig. 3
Fig. 3. Tubule-specific Tet2 deficiency exacerbates cisplatin-induced kidney injury.
a Experimental scheme for the generation of Pax8rtTACreTRETet2f/f mice. Created with BioRender.com. b Relative transcript levels of Tet2 in kidneys of control and Pax8rtTACreTRETet2f/f mice. Each group contains n = 4 biological replicates. c Experimental design. Tet2f/f, Pax8rtTACreTRETet2wt/f, and Pax8rtTACreTRETet2f/f mice were injected with saline or cisplatin for 3 days. Created with BioRender.com. d Representative images of H&E-stained kidney sections from Tet2f/f, Pax8rtTACreTRETet2wt/f, and Pax8rtTACreTRETet2f/f mice, injected with saline or cisplatin. Scale bar = 20 μm. Data are representative of three independent experiments. e Serum creatinine levels in Tet2f/f, Pax8rtTACreTRETet2wt/f, and Pax8rtTACreTRETet2f/f mice injected with saline or cisplatin. In the saline-injected groups: n = 3 each for each genotype. In the cisplatin-injected groups: Tet2f/f: n = 5, Pax8rtTACreTRETet2wt/f: n = 4, Pax8rtTACreTRETet2f/f: n = 5. f Relative transcript levels of Kim1 in kidneys of Tet2f/f, Pax8rtTACreTRETet2wt/f, and Pax8rtTACreTRETet2f/f mice injected with saline or cisplatin. Saline-injected groups: n = 3 for each genotype. In the cisplatin-injected groups: Tet2f/f: n = 6, Pax8rtTACreTRETet2wt/f: n = 6, Pax8rtTACreTRETet2f/f: n = 5. Data are presented as mean ± SEM and were analyzed using analyzed using a two-tailed unpaired Student’s t-test (b) or a one-way ANOVA followed by Tukey’s post hoc test for multigroup comparison (e-f). Source data are provided as a Source Data file.
Fig. 4
Fig. 4. Tet2 loss was associated with chromosome segregation defect and an increase in cytosolic micronuclei.
a This diagram summarizes nuclear isolation and single-nucleus RNA sequencing (snRNA-seq) of kidneys from wild type (WT) control and Six2CreTet2f/f mice subjected to sham-operation or UUO surgery, using the 10X Genomics platform. Created with BioRender.com. b Bubble plots show representative marker gene expression across 19 cell clusters: Podocyte (Podo), Parietal epithelial cells (PEC), Proximal convoluted tubule (PCT), Proximal straight tubule (PST), Injured proximal tubule (iPT), Descending and ascending thin limb of loop of Henle (DTL_ATL), Thick ascending limb (TAL), Macula densa (MD), Distal convoluted tubule (DCT), Connecting tubule (CNT), Principal cells (PC), Type A and Type B intercalated cells of collecting duct (IC_A and IC_B), Endothelial cells (Endo), Proliferating cells (Prolif), Proliferating stromal (Prolif_Stromal), Myofibroblast (Myofib). The bubble size represents the percentage of positive cells, and color intensity indicates expression level. c UMAP dimension reduction of snRNA-seq from WT control and Six2CreTet2f/f mice subjected to sham-operation or UUO surgery. d Gene Ontology (GO) functional analysis of differentially expressed genes (DEGs) observed in control WT and Six2CreTet2f/f mice after UUO surgery. Enriched biological process (p < 0.05) are shown, with p-values transformed to −log10. Bubble size indicates gene count, and color shows fold change. e This diagram summarizes the RNA sequencing (RNA-seq) process for control and TET2 knockdown RPTEC (CRISPR). Created with BioRender.com. f Relative TET2 transcript levels in control and knockdown RPTEC (n = 3 biological replicates per group). g GO analysis of genes with > 30% reduced expression in TET2 knockdown RPTEC compared to control cells. Enriched terms (p < 0.05) are log-transformed. h Experimental design for primary tubule cells from control and Six2CreTet2f/f mice treated with doxorubicin. Created with BioRender.com. i,j DAPI staining shows chromosome segregation in control and Tet2-knockout primary tubule cells or TET2 knockdown RPTEC. Right panel: Quantifications of doxorubicin-treated cells with chromosome segregation defect (n = 3 biological replicates per group). k,l Representative images of γH2AX and DAPI staining, showing primary tubule cells or RPTEC with or without micronuclei. Right panel: Quantifications of the doxorubicin-treated cells with micronuclei. Each group contains n = 3 biological replicates. Scale bar = 20 μm. Data are presented as mean ± SEM, analyzed with two-tailed unpaired Student’s t-test (f,il). Source data are provided as a Source Data file.
Fig. 5
Fig. 5. Tet2 deficiency was associated with impaired DNA repair and accumulation of damaged DNA.
a Representative images of immunofluorescence staining for γH2AX and DAPI in tubule cells from control and Six2CreTet2f/f mice treated with doxorubicin. n = 3 biological replicates per group. b Representative Western blots for γH2AX in kidney samples from control Six2Cre and Six2CreTet2f/f mice injected with saline or cisplatin, or subjected to sham-operation or UUO surgery. (Right panel) Densitometric quantification of γH2AX normalized to GAPDH. Saline-injected or cisplatin-injected groups: n = 3 per group. Sham-operated or UUO-operated groups: n = 4 per group. c Representative immunofluorescence staining images for p-ATM in tubule cells from control and Six2CreTet2f/f mice treated with or without doxorubicin. n = 3 biological replicates per group. d Representative Western blots for nuclear p-CHK2, p-BRCA1, and p-p53 in tubule cells from Six2Cre and Six2CreTet2f/f mice kidney treated with or without doxorubicin. Lamin B1 is the loading control. n = 3 biological replicates per group. e Double strand break (DSB) repair pathways. Created with BioRender.com. f Bubble plots showing expression of Brca2, Rad51, Xrcc2, and Eme1 in PT clusters. Circle size shows percentage of positive cells, and color indicates gene expression. g Relative transcript levels of BRCA2 DNA repair associated (Brca2), RAD51 recombinase (Rad51), X-ray repair cross complementing 2 (Xrcc2), and Essential meiotic structure-specific endonuclease 1 (Eme1) in kidneys from Six2Cre and Six2creTet2f/f mice after sham-operation or UUO surgery. Gapdh was used for normalization. Sham-operated groups: Six2Cre (n = 5), Six2creTet2f/f (n = 6); UUO-operated groups: n = 6 per group. h Relative expression of BRCA2, RAD51, XRCC2, and EME1 in control and TET2-knockdown RPTECs from RNA-seq analysis. i Relative transcript levels of BRCA2, RAD51, XRCC2, and EME1 in control and TET2-knockdown RPTECs measured by qRT-PCR. n = 3 biological replicates per group. j Representative immunofluorescence images showing γH2AX staining in tubule cells from control and Six2CreTet2f/f mice treated with or without doxorubicin in the presence or absence of PARP inhibitor Olaparib. n = 3 biological replicates per group. k Experimental design: Six2Cre and Six2CreTet2f/f mice injected with saline or cisplatin and in the presence or absence of Olaparib. Created with BioRender.com. l Survival curve for Six2Cre and Six2CreTet2f/f mice injected with saline or cisplatin and supplemented with or without Olaparib. Saline-injected groups: Six2Cre (n = 5), Six2CreTet2f/f (n = 4); Cisplatin-injected groups: Six2Cre (n = 5), Six2CreTet2f/f (n = 6); Cisplatin and Olaparib-injected groups: Six2Cre mice (n = 9) Six2CreTet2f/f mice (n = 6). Scale bar = 20 μm. Data are presented as mean ± SEM, analyzed using one-way ANOVA with Tukey’s post hoc test (b, g) or a two-tailed unpaired Student’s t-test (h, i). Source data are provided as a Source Data file.
Fig. 6
Fig. 6. Ino80 is another kidney disease risk gene associated with impaired DNA damage repair.
a LocusZoom plot of GWAS (genotype and eGFRcrea association, n = 1,508,659 independent biological replicates). b RNA-seq of control and TET2-knockdown RPTECs showing INO80 expression in these cells. cf Relative transcript levels of INO80 in control and TET2-knockdown RPTECs, and its levels in kidney samples from Six2Cre and Six2CreTet2f/f mice subjected to sham-operation or UUO surgery or on control or adenine diets. For the control and TET2-knockdown (KD) RPTEC groups, n = 3 biological replicates per group. In the sham-operated and UUO-operated groups, n = 6 replicates per group. In the control diet-fed groups, n = 5 replicates per group. For the adenine diet-fed group, Six2Cre mice had n = 9, and Six2creTet2f/f mice had n = 5. g Relative transcript levels of INO80 in INO80 (CRISPR) knockdown cells compared to control RPTEC, with n = 3 biological replicates per group. h Representative images of immunofluorescence staining showing micronuclei (MN) in control, INO80-knockdown, TET2- knockdown, and TET2 and INO80 double knockdown RPTECs. n = 3 biological replicates per group.Scale bar = 20 μm. Data are presented as mean ± SEM and were analyzed by a two-tailed unpaired Student’s t-test (c,g) or a one-way ANOVA followed by Tukey’s post hoc test for multigroup comparison (e,f). Source data are provided as a Source Data file.
Fig. 7
Fig. 7. cGAS and STING mediate the TET2 -loss induced kidney damage.
a GO functional analysis of genes upregulated (1.5-fold) in TET2-knockdown RPTECs compared to controls. Significantly biological process GO terms (p < 0.05) are presented, with p-values as negative log10-transformed. b Relative transcript levels of Isg15, Ifit1, Ifit2, Ifit3, Mx1, and Isg20 in control and TET2 knockdown RPTECs. n = 3 biological replicates per group. c Representative Western blots for cGAS, STING, TBK1, p-TBK1, IRF3, p-IRF3, P65, and phosphorylated p65 (p-p65) in kidney samples from Six2Cre and Six2CreTet2f/f mice subjected to sham operation or UUO surgery. n = 3 per group. d Representative in situ hybridization images of Isg15 (blue) and Hnf4a (red) in kidney sections from Six2Cre and Six2CreTet2f/f mice injected with saline or cisplatin, or subjected to sham-operation or UUO surgery. e Experimental design: Six2Cre and Six2CreTet2f/f mice injected with saline or cisplatin in the presence or absence of the STING inhibitor C176. Created with BioRender.com. f Serum BUN levels in Six2Cre and Six2CreTet2f/f mice injected with saline or cisplatin either in the presence or absence of C176. Saline-injected groups: n = 3 biological replicates per group; Cisplatin-injected groups: n = 4 biological replicates per group; Cisplatin and C176-injected groups: Six2Cre (n = 4) and Six2creTet2f/f (n = 5). g Representative images of H&E-stained kidney sections from Six2Cre and Six2CreTet2f/f mice injected with saline or cisplatin either in the presence or absence of C176. h Relative transcript levels of Kim1 and Ngal in kidneys from Six2Cre and Six2CreTet2f/f mice injected with saline or cisplatin, with or without C176. Saline-injected groups: n = 5 samples per group. Cisplatin-injected groups: n = 6 samples per group. Cisplatin and C176-treated groups: n = 6 samples per group. i Representative images of H&E-stained and Sirius Red-stained kidney sections from Six2Cre, Six2CreTet2f/f, Six2CreTet2f/fCgasf/f, and Six2CreTet2f/fStingf/f mice subjected to sham-operation or UUO surgery. j Relative transcript levels of Fn1, Col1a1, and Col3a1 in kidneys from Six2Cre, Six2CreTet2f/f, Six2CreTet2f/fCgasf/f, and Six2CreTet2f/fStingf/f mice after sham-operation or UUO surgery. Sham-operated groups: n = 4; UUO-operated groups: n = 5. Scale bar = 20 μm. Data are presented as mean ± SEM and were analyzed using a two-tailed unpaired Student’s t-test (b) or a one-way ANOVA followed by Tukey’s post hoc test for multigroup comparison (f, h, j). Data are representative of three independent experiments (d, g, i). Source data are provided as a Source Data file.

References

    1. Jager, K. J. et al. A single number for advocacy and communication-worldwide more than 850 million individuals have kidney diseases. Nephrol. Dial. Transpl.34, 1803–1805 (2019). - PubMed
    1. Kovesdy, C. P. Epidemiology of chronic kidney disease: an update 2022. Kidney Int Suppl.12, 7–11 (2022). - PMC - PubMed
    1. Collaboration, G. B. D. C. K. D. Global, regional, and national burden of chronic kidney disease, 1990-2017: a systematic analysis for the Global Burden of Disease Study 2017. Lancet395, 709–733 (2020). - PMC - PubMed
    1. Ko, Y. A. et al. Genetic-variation-driven gene-expression changes highlight genes with important functions for kidney disease. Am. J. Hum. Genet100, 940–953 (2017). - PMC - PubMed
    1. Wuttke, M. et al. A catalog of genetic loci associated with kidney function from analyses of a million individuals. Nat. Genet51, 957–972 (2019). - PMC - PubMed

Publication types

MeSH terms

Associated data

LinkOut - more resources