. 2024 Nov 7;15(1):9652.
doi: 10.1038/s41467-024-53844-8.

Preoperative methionine restriction induces perivascular adipose tissue browning and improves vein graft remodeling in male mice

Affiliations

Preoperative methionine restriction induces perivascular adipose tissue browning and improves vein graft remodeling in male mice

Peter Kip et al. Nat Commun. .

Abstract

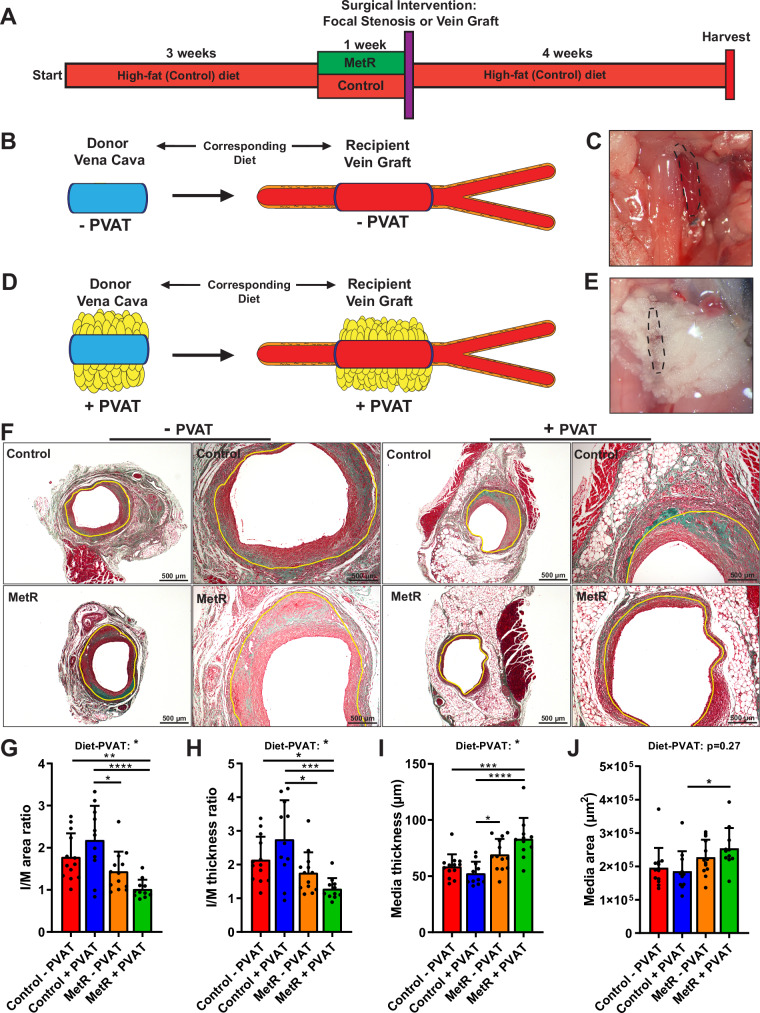
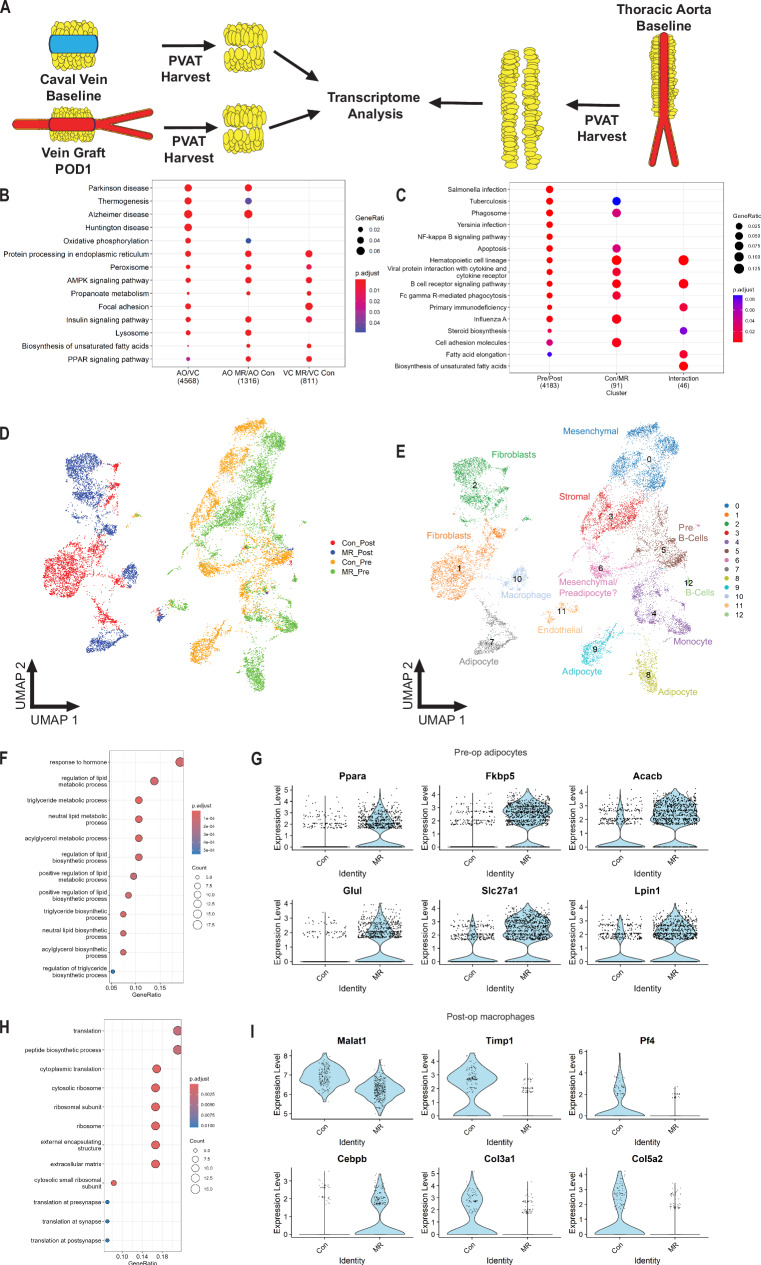
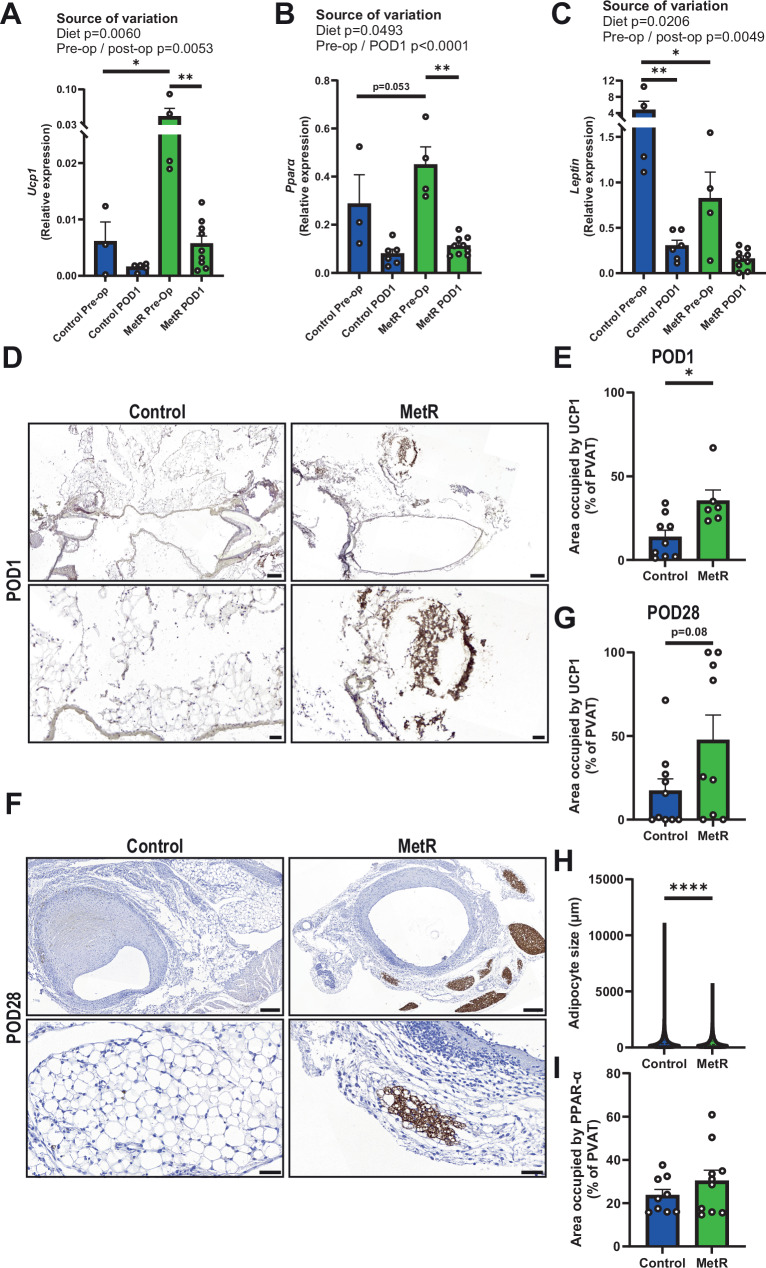
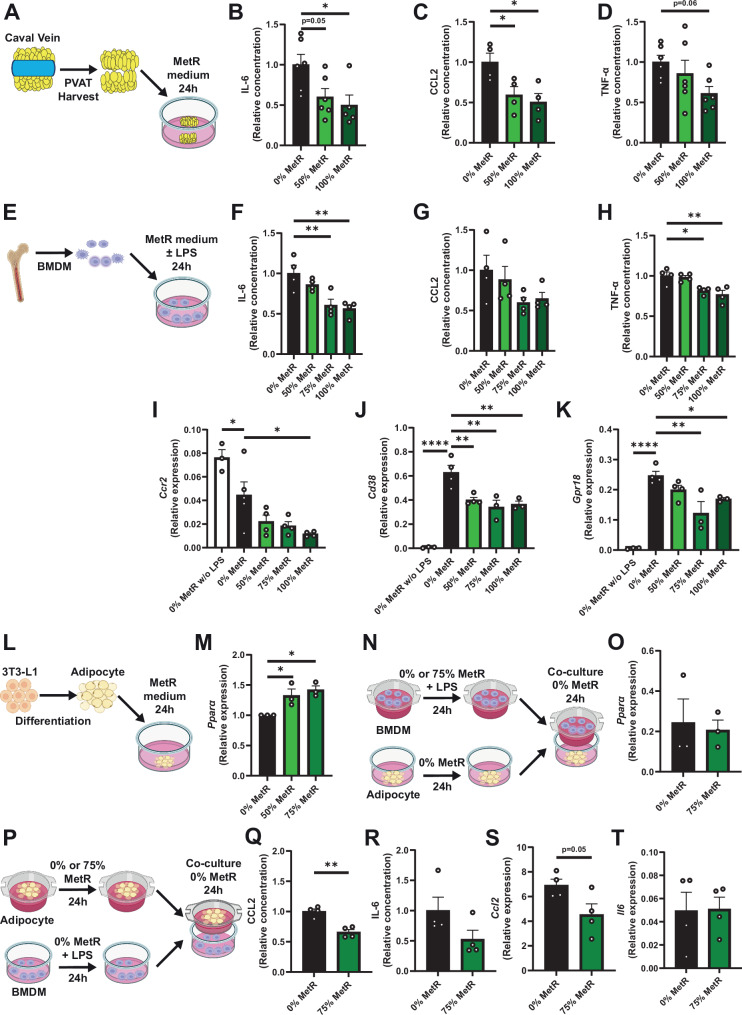
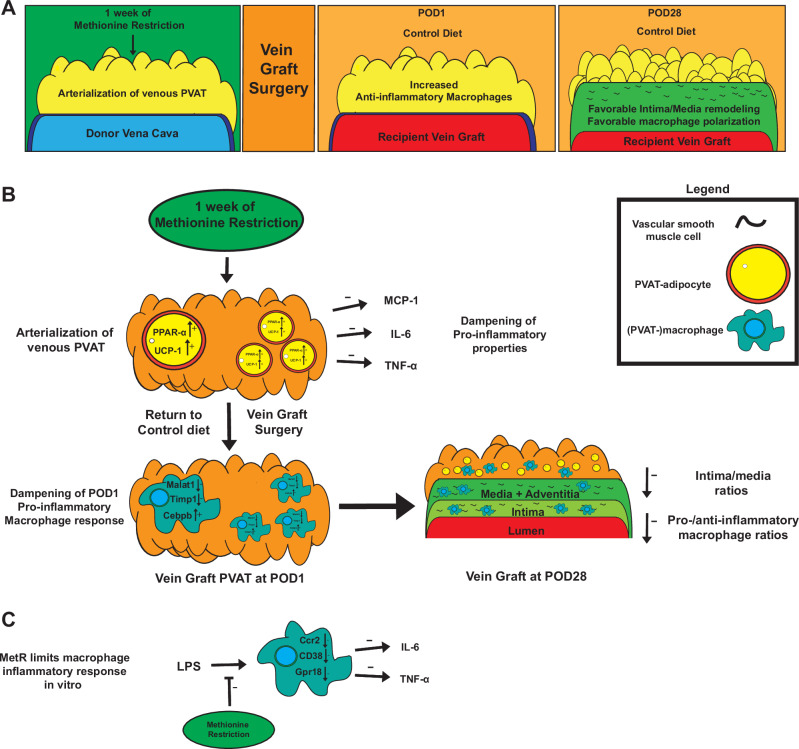
Short-term preoperative methionine restriction (MetR) is a promising translatable strategy to mitigate surgical injury response. However, its application to improve post-interventional vascular remodeling remains underexplored. Here we find that MetR protects from arterial intimal hyperplasia in a focal stenosis model and pathologic vascular remodeling following vein graft surgery in male mice. RNA sequencing reveals that MetR enhances browning in arterial (thoracic aorta) perivascular adipose tissue (PVAT) and induces it in venous (caval vein) PVAT. Specifically, Ppara is highly upregulated in PVAT-adipocytes upon MetR. Furthermore, MetR dampens the postoperative pro-inflammatory response to surgery in PVAT-macrophages in vivo and in vitro. This study shows that the detrimental effects of dysfunctional PVAT on vascular remodeling can be reversed by MetR, and identifies pathways involved in MetR-induced browning of PVAT. Furthermore, we demonstrate the potential of short-term preoperative MetR as a simple intervention to ameliorate vascular remodeling after vascular surgery.


Conflict of interest statement

The authors declare no competing interests.

Figures

Fig. 1
Fig. 1. Protection from adverse vein graft remodeling via short-term methionine restriction is perivascular adipose tissue dependent.
A Schematic overview of dietary intervention. BE Schematic and in-situ images of vena cava/vein graft ± PVAT. B, C Stripping of venous PVAT results in vein graft lacking PVAT. D, E Vena cava with PVAT and consecutive vein graft with PVAT intact. F Images of vein grafts at POD28 after Masson-trichrome staining. Control and MetR, no PVAT or PVAT. Scale bars = 200 or 500 µm as indicated. GJ Histomorphometric analysis of POD28 vein grafts (Control − PVAT n = 13, Control + PVAT n = 11, MetR − PVAT n = 13, MetR + PVAT n = 11). G I/M area ratio (*p = 0.0108, **p = 0.0084). H I/M thickness ratio (Control − PVAT vs. MetR + PVAT p = 0.0403; Control + PVAT vs. MetR − PVAT p = 0.0313; ***p = 0.0006). I Media thickness (*p = 0.0223, ***p = 0.0004). J Media area (*p = 0.0385). All statistical testing was done via two-way ANOVA with Tukey’s multiple comparisons test unless otherwise indicated. Graphs are presented as mean ± SD *p < 0.05, **p < 0.01, ***p < 0.001, ****p < 0.0001. Source data are provided as a Source Data file.
Fig. 2
Fig. 2. Short-term MetR modulates caval vein PVAT toward an arterial-like phenotype.
Bulk RNA sequencing (AC) was performed on IVC and vein graft POD1 PVAT in Control and MetR mice (n = 5/group). Similarly, single-cell nuclear sequencing (DI) was performed on IVC and vein graft POD1 PVAT in Control and MetR mice (n = 2/group). A Schematic of venous (preoperative and POD1) PVAT; and of thoracic aorta PVAT harvest, three separate adipose tissue depots processed for transcriptome analysis simultaneously. B Pathway analysis of thoracic aorta vs. venous (preoperative) PVAT of Control mice (AO/VC, first column), thoracic aorta PVAT MetR vs. Control (AO MR/AO Con, second column) and venous PVAT MetR vs. Control (VC MR/ VC Con, third column). C Pathway analysis of vein graft PVAT at POD1, MetR vs. Control. D UMAP project of cells colored by diet/surgery group. N = 2/group (Con/MR Control/MetR and Pre/Post preoperatively/postoperatively). E UMAP projection of cells colored by cluster with cell type description. N = 2/group F Pathway analysis of top 100 differentially expressed genes in preoperative adipocytes between Control and MetR groups. G Violin plots of top differentially expressed genes in preoperative adipocytes. H Pathway analysis of top 100 differentially expressed genes in postoperative macrophages between Control vs. MetR. I Violin plots of top differentially expressed genes in postoperative macrophages. B, C, F, H Gene set over-representation analysis with false detection rate correction.
Fig. 3
Fig. 3. Short-term MetR induces browning in venous PVAT which is sustained until POD28.
A Ucp1 (*p = 0.0158, **p = 0.0018), B Pparα (***p = 0.0002) and C Leptin gene expression in preoperative and POD1 PVAT (*p = 0.0407, **p = 0.0076), all tested via Two-way ANOVA with Bonferroni’s multiple comparisons test (Control preoperative n = 3, Control POD1 n = 5, MetR preoperative n = 4, MetR POD1 n = 9). D Images of UCP1 stained vein grafts at POD1 in both Control and MetR-preconditioned mice, scale bars = 200 µm (overview) or 50 µm (zoom-in). E Quantification of UCP1 positive cells after IHC in PVAT of vein grafts at POD1 (p = 0.0116, Control n = 9, MetR n = 6). F Images of UCP1 stained vein grafts at POD28 in both Control and MetR-preconditioned mice, scale bars = 200 µm (overview) or 50 µm (zoom-in). G Quantification of UCP1 positive cells after IHC in PVAT of vein grafts at POD28 (p = 0.0776, Control n = 10, MetR n = 9). H individual adipocyte size in vein grafts at POD28 in both Control and MetR-preconditioned cohorts. I Quantification of PPAR-α positive cells after IHC in PVAT of vein grafts at POD28 (Control n = 9, MetR n = 10). All statistical testing was done via unpaired t-test unless otherwise indicated. Graphs are presented as mean ± SEM. *p < 0.05, **p < 0.01, ***p < 0.0001 ****p < 0.0001. Source data are provided as a Source Data file.
Fig. 4
Fig. 4. MetR activates PPAR-α signaling in adipocytes and dampens the inflammatory response of macrophages and PVAT in vitro and ex vivo.
AD Venous PVAT was harvested from C57BL/6J mice and cultured in vitro. A Schematic overview of experimental setup. B IL-6, (*p = 0.0220, 0% n = 6, 50% n = 6, 100% n = 5) C CCL2 (0% vs. 50% p = 0.0445, 0% vs. 100% p = 0.0176, % 0% n = 4, 50% n = 4, 100% n = 4) and D TNF-α levels in supernatant of PVAT (0% n = 6, 50% n = 6, 100% n = 6). EK Bone marrow-derived macrophages (BMDMs) were stimulated with LPS and incubated for 24 h in Control or MetR medium. E Schematic overview of experimental setup. F IL-6, (0% vs. 75% p = 0.0048, 0% vs. 100% p = 0.0022) G CCL2 and H TNF-α levels in the supernatant of BMDMs (*p = 0.0166, **p = 0.0035) (FH; n = 4/group). I qPCR for Ccr2, (0% vs. 0% w/o LPS p = 0.0370, 0% vs. 100% p = 0.0171, 0% w/o LPS n = 3, 0% n = 5, 50% n = 4, 75% n = 4, 100% n = 4) J Cd38 (****p = 0.0001, 0% vs. 50% p = 0.0049, 0% vs. 75% p = 0.0015, 0% vs. 100% p = 0.0029) and K Gpr18 in pro-inflammatory macrophages under Control and MetR conditions (*p = 0.0438, **p = 0.0020) (J, K; 0% w/o LPS n = 3, 0% n = 4, 50% n = 4, 75% n = 3, 100% n = 3). L, M 3T3-L1 cells were differentiated to adipocytes and incubated for 24 h with Control or MetR medium. L Schematic overview of experimental setup. M qPCR for Ppara in 3T3-L1-differentiated adipocytes (n = 3/group). NT Co-culture experiments. N Schematic overview of experimental setup. O qPCR for Ppara in adipocytes after 24-h incubation with BMDMs, tested via unpaired t-test (0% vs. 50% p = 0.0341, 0% vs. 75% p = 0.0117) (n = 3/group). P Schematic overview of experimental setup. Q CCL2 (**p = 0.0014) and R IL-6 levels in supernatant, tested via unpaired t-test. S qPCR for Ccl2 and T Il6 in BMDMs, tested via unpaired t-test (PT; n = 4/group). A, E, L, N, P Created with BioRender.com, released under a Creative Commons Attribution-NonCommerical-NoDerivs 4.0 International License. All statistical testing was done via one-way ANOVA with Dunnet’s multiple comparisons test, unless otherwise indicated. Graphs are presented as mean ± SEM. *p < 0.05, **p < 0.01, ****p < 0.0001. Source data are provided as a Source Data file.
Fig. 5
Fig. 5. Favorable vein graft wall composition seen in MetR mice is also perivascular adipose tissue dependent.
A Pro-/anti-inflammatory macrophage ratio per vein graft layer (intima; *p = 0.0278, ***p = 0.0003) (media; ***p = 0.0005) (whole VG; **p = 0.0076). B Pro-/anti-inflammatory macrophage ratio in PVAT of MetR and Control mice (***p = 0.0007). C Immunohistochemical staining for pro- and anti-inflammatory macrophages, L indicates lumen. Scale bars = 500 µm. D Anti-inflammatory macrophages as a percentage of total MΦ per vein graft layer (intima; *p = 0.0206, **p = 0.0043) (whole VG; *p = 0.0183). E Pro-inflammatory macrophages as a percentage of total MΦ per vein graft layer (media; *p = 0.0368) (whole VG; *p = 0.0489) (A, B, D, E; Control − PVAT n = 9, Control + PVAT n = 8, MetR − PVAT n = 12, MetR + PVAT n = 10). F Immunohistochemical staining for ACTA2 and Ki-67. Scale bars = 500 µm G Area occupied by VSMC per vein graft layer. H Proliferating VSMC (ACTA2 + Ki-67 double positive cells) per mm2 per vein graft layer (G, H; Control − PVAT n = 13, Control + PVAT n = 10, MetR − PVAT n = 12, MetR + PVAT n = 11). All statistical testing was done via two-way ANOVA with Tukey’s multiple comparisons test, unless otherwise indicated. *p < 0.05, **p < 0.01, ***p < 0.001, ****p < 0.0001. Source data are provided as a Source Data file.
Fig. 6
Fig. 6. MetR modulates macrophage inflammation, induces PPAR-α induced browning in perivascular adipose tissue and protects from adverse vein graft remodeling.
A General overview of proposed mechanism of MetR–PVAT interaction dependent protection from adverse vein graft remodeling. B In vivo/ex vivo mechanisms of MetR–PVAT interactions at preoperative, POD1 and POD28 timepoints. C Effects of MetR on macrophages in vitro.

Update of

References

    1. Farber, A. et al. Surgery or endovascular therapy for chronic limb-threatening ischemia. N. Engl. J. Med.387, 2305–2316 (2022). - PubMed
    1. Yahagi, K. et al. Pathophysiology of native coronary, vein graft, and in-stent atherosclerosis. Nat. Rev. Cardiol.13, 79–98 (2016). - PubMed
    1. de Vries, M. R. & Quax, P. H. A. Inflammation in vein graft disease. Front. Cardiovasc. Med.5, 3 (2018). - PMC - PubMed
    1. de Vries, M. R., Simons, K. H., Jukema, J. W., Braun, J. & Quax, P. H. A. Vein graft failure: from pathophysiology to clinical outcomes. Nat. Rev. Cardiol.13, 451–470 (2016). - PubMed
    1. Brown, N. K. et al. Perivascular adipose tissue in vascular function and disease: a review of current research and animal models. Arterioscler. Thromb. Vasc. Biol.34, 1621–1630 (2014). - PMC - PubMed

Publication types

LinkOut - more resources