. 2024 Nov 7;15(1):9619.
doi: 10.1038/s41467-024-54033-3.

Altered genomic methylation promotes Staphylococcus aureus persistence in hospital environment

Affiliations

Altered genomic methylation promotes Staphylococcus aureus persistence in hospital environment

Yuriko Yamazaki et al. Nat Commun. .

Abstract

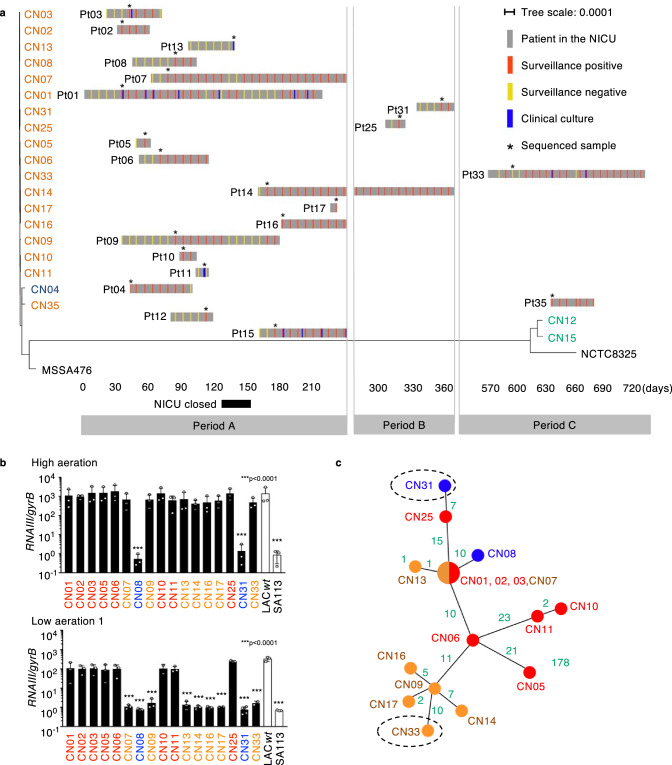
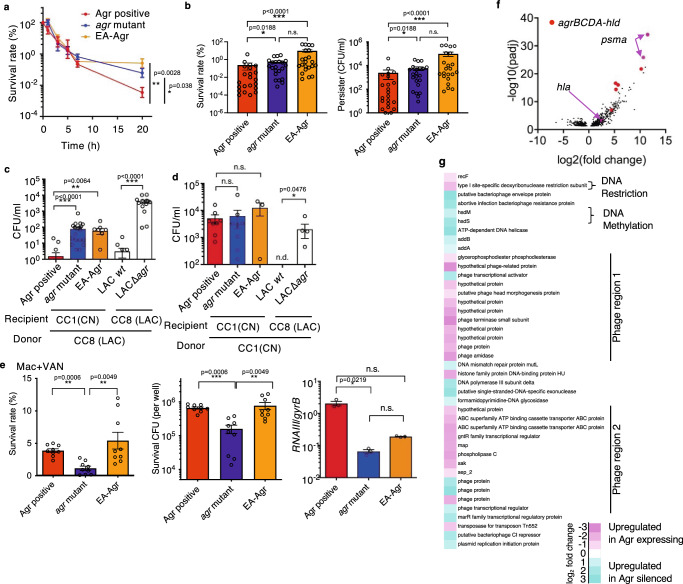
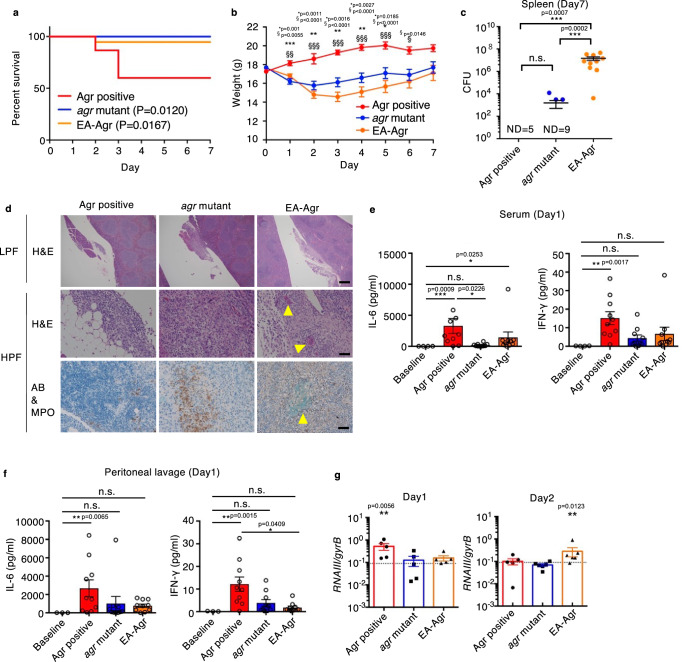
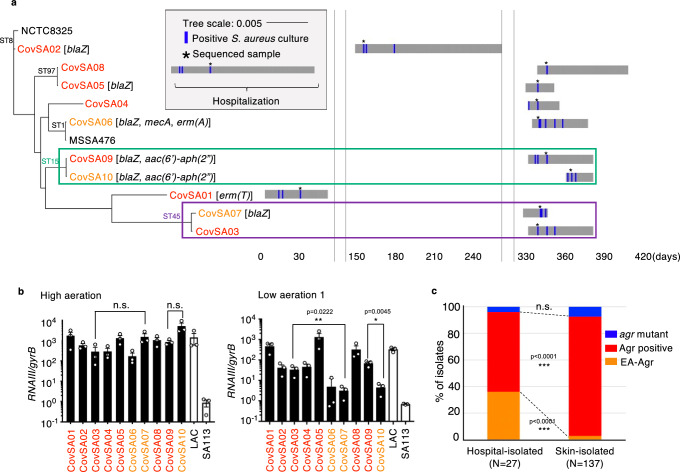
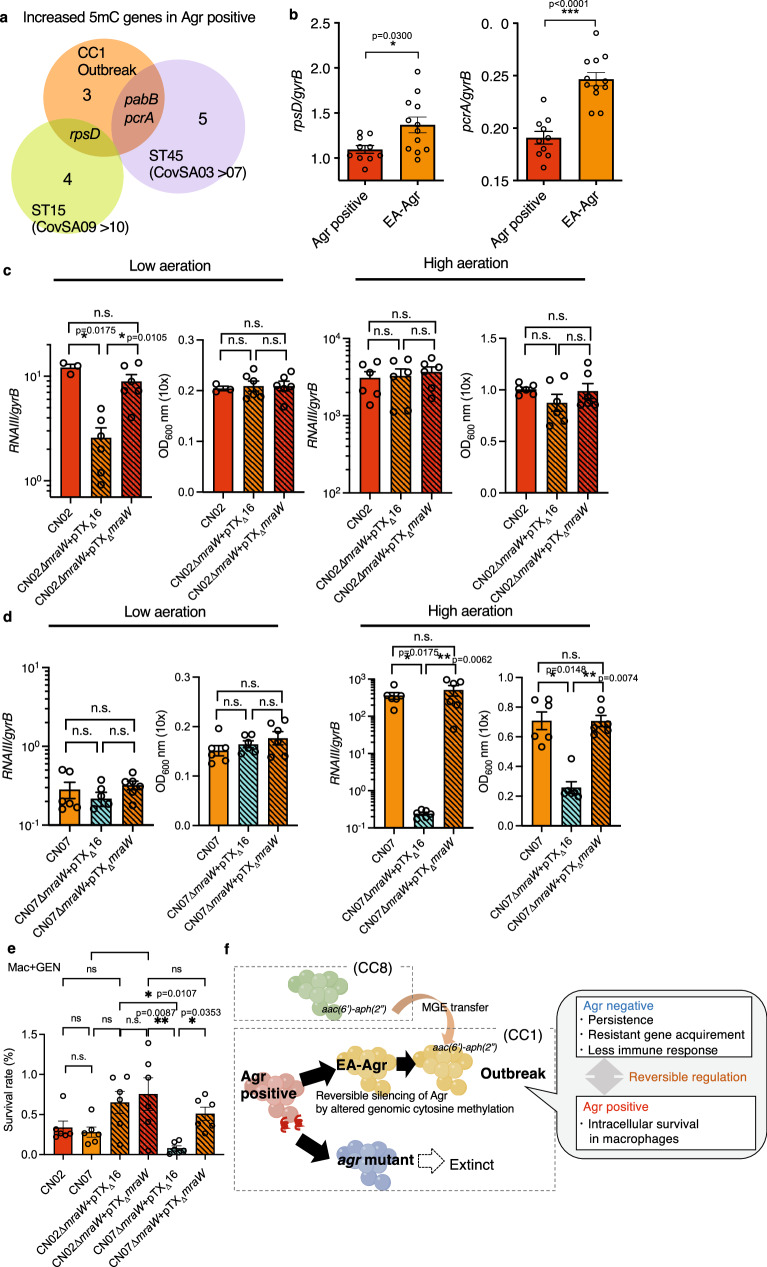
Staphylococcus aureus can cause outbreaks and becomes multi-drug resistant through gene mutations and acquiring resistance genes. However, why S. aureus easily adapts to hospital environments, promoting resistance and recurrent infections, remains unknown. Here we show that a specific S. aureus lineage evolved from a clone that expresses the accessory gene regulator (Agr) system to subclones that reversibly suppressed Agr and caused an outbreak in the hospital setting. S. aureus with flexible Agr regulation shows increased ability to acquire antibiotic-resistant plasmids, escape host immunity, and colonize mice. Bacteria with flexible Agr regulation shows altered cytosine genomic methylation, including the decreased 5mC methylation in transcriptional regulator genes (pcrA and rpsD), compared to strains with normal Agr expression patterns. In this work, we discover how altered genomic methylation promotes flexible Agr regulation which is associated with persistent pathogen colonization in the hospital environment.


Conflict of interest statement

The authors declare no competing interests.

Figures

Fig. 1
Fig. 1. Characterization of the MRSA lineage causing an infection outbreak at NICU.
a Timeline of the MRSA outbreak in the NICU layered with a maximum-likelihood phylogenetic tree based on the core genome SNVs. We screened all infants in the NICU for MRSA carriage in feces and throat weekly (surveillance). Some patients experienced MRSA infections (clinical culture). The sampled isolates used for analysis (*) were named CN01 to CN33, corresponding to the patient (Pt) number. Isolates are color-coded as ST1 (CC1): orange, ST2764: blue, and ST8 (CC8): green. MSSA476 (ST1) and NCTC8325 (ST8) were used as reference strains. b Normalized RNAIII expression in 4-hour cultures of MRSA outbreak lineage (CN01agr+-CN03 agr+, CN05agr+, CN06agr+, CN07EA, CN08agr, CN09 EA, CN10agr+, CN11agr+, CN13EA, CN14EA, CN16EA, CN17EA, CN18agrand CN33EA) under high or low aeration (n = 3, biological measurements). LAC wt and SA113 strains are shown as positive and negative controls. Data are presented as mean values +/− SEM. ***p < 0.0001, Kruskal-Wallis test with two-tailed Dunn’s post-hoc test. The dots represent the number (n) of biological measurements. c An unrooted maximum-likelihood phylogenetic tree based on the core genome SNVs of the outbreak lineage (ST1-SCCmecIV-agrIII). Green: SNV number between each isolate. Dotted circles: isolates in the late period of the study (>day 365). SNV Single nucleotide variation. b, c Red color: Agr positive subclones, Blue color: agr mutant subclones, Orange color: EA-Agr subclones.
Fig. 2
Fig. 2. EA-Agr bacteria display increased persister formation, acquisition of plasmids, and survival inside macrophages.
a Time-dependent survival rate after exposure to a dose of VAN greater than 100 × MIC. b Survival rate and persister CFU at 20 h after VAN incubation. c, d Competency level of representative isolates measured as the CFU of the transformants after electroporation of pMK4 prepared from CC8 strain (C) or CC1 strain (D). e Bacterial survival rate (%), number (CFU), and relative RNAIII expression inside macrophages (Mac) 24 hrs after phagocytosis using vancomycin (VAN) to eliminate extracellular bacteria. a Agr positive: CN02agr+, agr mutant: CN08 agr, EA-Agr: CN17EA (b) Agr positive: CN02agr+ and CN06agr+, agr mutant: CN08 and CN31 EA-Agr: CN09EA and CN17EA. Each dot represents an experimental replicate. c, d Agr positive: CN02agr+ and CN25agr+, agr mutant: CN08agr and CN31agr, EA-Agr: CN17EA. a n = 3 at the 0, 1, 3, 5, and 7-hour time points. n = 20 at 20-hour time point for each group. b n = 11 (c) n = 7 (d) n = 4 for each subclones. e Agr positive: CN02agr+ for, agr mutant: CN08agr, EA-Agr: CN17EA. n = 9 for survival rate and CFU, n = 3 for RNAIII expression. ae Data are the mean ± SEM. *p < 0.05, **p < 0.01, ***p < 0.001, n.s. not significant, n.d. not detected. Kruskal-Wallis test with two-tailed Dunn’s post-hoc test. The dots represent the number (n) of biological measurements. f Volcano plot of RNA expression profiles of Agr-expressing and Agr-suppressed groups. Fold change values of RNA expression between Agr-expressing and Agr- suppressed groups. The adjusted p value (padj) values below 0.05 are considered significant and shown in the volcano plot. Red: agr operon genes (agrB, agrC, agrD, agrA, and hld), Pink arrows: psmα and hla. g Heatmap of the MGE-associated genes that are significantly increased in Agr-expressing (pink) or Agr-silenced (cyan) bacterial cultures (padj < 0.05). The padj calculated by two-tailed Benjamini-Hochberg method for multiple comparison testing.
Fig. 3
Fig. 3. EA-Agr bacteria exhibit reduced pathogenicity, but increased ability to colonize hosts.
a Survival rate and (b) body weight up to 7 days after C57BL/6 mice were intraperitoneally inoculated with Agr positive (CN02agr+), agr mutant (CN08agr), or EA-Agr (CN17EA). The survival curve comparison was analyzed by two-tailed Gehan-Breslow-Wilcoxon test (CN02agr+: n = 15, CN08agr: n = 13, CN17EA: n = 19). For each time point, a significant difference is represented as: * between Agr positive and agr mutant, and § between Agr positive and EA-Agr (CN02agr+: n = 8, CN08agr: n = 12, CN17EA: n = 11). One-way ANOVA with Tukey’s multiple comparisons test. c Bacterial loads in the spleen at 7 days after bacterial inoculation. ND not detected. d Histological analysis of pancreaticosplenic ligament. LPF low power field, HPF high power field, H&E hematoxylin and eosin, AB alcian-blue, MPO myeloperoxidase. Scale bar; 500 µm (LPF), 100 µm (HPF). Yellow arrowheads and dotted circle indicate biofilm-like structures. e, f The inflammatory cytokine expressions of mice serum (e) and peritoneal lavage (f) at day 1 (n = 10 for infected groups, n = 3 for baseline). Representative images from three independent experiments are shown. g Normalized RNAIII expression of bacteria in peritoneal lavage fluid at day1 (CN02agr+: n = 5, CN08agr: n = 5, CN17EA: n = 5) and 2 (CN02agr+: n = 5, CN08agr: n = 6, CN17EA: n = 6) after infection. Each dot represents an individual mouse. Bars represent mean ± SEM. *p < 0.05, **p < 0.01, ***p < 0.001, Kruskal-Wallis test with two-tailed Dunn’s post-hoc test.
Fig. 4
Fig. 4. S. aureus causing co-infection with COVID-19 pneumonia evolved to gain EA-Agr phenotype.
a A maximum-likelihood phylogenetic tree and isolation timeline of S. aureus causing co-infection with COVID-19 pneumonia (COVID-19-related S. aureus). The resistant genes identified in each isolate are indicated in brackets. b Normalized RNAIII expression in 4-hour cultures of COVID-19-related S. aureus under high or low aerated conditions. Red: Agr positive, Orange: EA-Agr S.aureus. n = 3 for each strain. The dots represent the number (n) of biological measurements. Data are presented as mean values +/− SEM. *p < 0.05, **p < 0.01, n.s. not significant, Kruskal-Wallis test with two-tailed Dunn’s post-hoc test. c Rate of Agr positive, agr mutant, and EA-Agr S. aureus in hospital-isolated and skin-isolated S. aureus. All clinical isolates are derived from different patients. ***p < 0.001, two-tailed chi square test.
Fig. 5
Fig. 5. Altered cytosine DNA methylation induces EA-Agr phenotype in S. aureus.
a Venn diagram comparing identified the increased 5mC genes in Agr positive group compared to EA-Agr group. Orange: CC1 outbreak lineage (CN02agr+, CN06agr+, CN07EA, CN17EA), Green: ST15 (CovSA09agr+, CovSA10EA), Purple: ST45(CovSA03agr+, CovSA07EA). The numbers in the Venn diagram represent the number of differentially methylated genes in each subset. b RpsD and pcrA expressions of Agr positive (CN02agr+, CN06agr+, n = 5 for each) and EA-Agr (CN07 EA, CN17 EA, n = 6 for each) subclones in the late growth phase (4 h culture) of low aeration condition 1. Data are the mean ± SEM. *p < 0.05, ***p < 0.001, two-tailed Mann-Whitney test. c RNAIII expression and bacterial density (OD600) of CN02agr+ (Agr positive) subclone, CN02agr+ deficient in mraW (CN02∆mraW + pTX16), and CN02agr+ mutant subclone complemented with mraW plasmid (CN02∆mraW + pTXmraW) grown under low aeration 2 and high aeration condition for 6.5 h. OD600; the optical density (OD) at 600 nm. n = 6 for each. d RNAIII expression and bacterial density (OD600) of CN07EA (EA-Agr) subclone, CN07EA mutant subclone deficient in mraW (CN07∆mraW + pTX16) and CN07EA mutant subclone complemented with mraW expression plasmid (CN07∆mraW + pTXmraW). n = 6 for each. e Bacterial survival rate (%) inside Mac 24 h after phagocytosis using gentamycin (GEN) to eliminate extracellular bacteria. Agr positive: CN02agr+, CN02∆mraW + pTXmraW, EA-Agr: CN07EA, CN02∆mraW + pTX16 and CN07∆mraW + pTXmraW, Agr negative: CN07∆mraW + pTX16. n = 6 for each. ce Data are the mean ± SEM. *p < 0.05, **p < 0.01, n.s. not significant. Kruskal-Wallis test with two-tailed Dunn’s post-hoc test. The dots represent the number (n) of biological measurements. f A hospital adaptation model of EA-Agr S. aureus.

References

    1. Turner, N. A. et al. Methicillin-resistant Staphylococcus aureus: an overview of basic and clinical research. Nat. Rev. Microbiol.17, 203–218 (2019). - PMC - PubMed
    1. Antimicrobial Resistance, C. Global burden of bacterial antimicrobial resistance in 2019: a systematic analysis. Lancet399, 629–655 (2022). - PMC - PubMed
    1. Naimi, T. S. et al. Comparison of community- and health care-associated methicillin-resistant Staphylococcus aureus infection. JAMA290, 2976–2984 (2003). - PubMed
    1. Balaban, N. Q. et al. Definitions and guidelines for research on antibiotic persistence. Nat. Rev. Microbiol.17, 441–448 (2019). - PMC - PubMed
    1. Liu, J., Gefen, O., Ronin, I., Bar-Meir, M. & Balaban, N. Q. Effect of tolerance on the evolution of antibiotic resistance under drug combinations. Science367, 200–204 (2020). - PubMed

Publication types

Substances

LinkOut - more resources