. 2024 Nov 7;15(1):9641.
doi: 10.1038/s41467-024-53883-1.

Mapping membrane biophysical nano-environments

Affiliations

Mapping membrane biophysical nano-environments

Luca Panconi et al. Nat Commun. .

Abstract

The mammalian plasma membrane is known to contain domains with varying lipid composition and biophysical properties. However, studying these membrane lipid domains presents challenges due to their predicted morphological similarity to the bulk membrane and their scale being below the classical resolution limit of optical microscopy. To address this, we combine the solvatochromic probe di-4-ANEPPDHQ, which reports on its biophysical environment through changes in its fluorescence emission, with spectrally resolved single-molecule localisation microscopy. The resulting data comprises nanometre-precision localisation coordinates and a generalised polarisation value related to the probe's environment - a marked point pattern. We introduce quantification algorithms based on topological data analysis (PLASMA) to detect and map nano-domains in this marked data, demonstrating their effectiveness in both artificial membranes and live cells. By leveraging environmentally sensitive fluorophores, multi-modal single molecule localisation microscopy, and advanced analysis methods, we achieve nanometre scale mapping of membrane properties and assess changes in response to external perturbation with methyl-β-cyclodextrin. This integrated methodology represents an integrated toolset for investigating marked point pattern data at nanometre spatial scales.


Conflict of interest statement

The authors declare no competing interests.

Figures

Fig. 1
Fig. 1. Principle and generation of marked di-4-ANEPPDHQ PAINT data.
a Schematic of the di-4-ANEPPDHQ PAINT principle. An excess of di-4-ANEPPDHQ probes rapidly diffuse in solution and insert into the membrane upon contact (left). The emission spectra of the individual probes are determined by the polarity of the lipid environment (right). b Exemplar derivation of GP values from experimental ratiometric di-4-ANEPPDHQ PAINT data. Raw PSFs are localised to x, y coordinates. From the photon count associated with each coordinate in each channel, GP values are calculated. Scale bars 500 nm.
Fig. 2
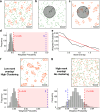
Fig. 2. Using P-check to detect domains in simulated marked point patterns.
a A discrete point pattern can be segmented into subset point patterns for each category – low order points (green) and high order points (orange); bc. Frequencies are calculated to determine the total number of neighbours for each point belonging to each of the two categories. d These values are summed over all points and the ratio gives the weighted probability, which can be compared to permutations of the same data set. e Mean probability returned from simulated data sets with varying degree of overlap of the GP values from each category. f Example simulated data set with low overlap and pronounced clustering which shows statistically significant segregation of the mark (GP) values. g Example simulated data set with high mark overlap over a spatially random distribution, leading to no statistically significant separations of the marks (e.g., GPs). P-Check uses a one-sided permutation test with Bonferroni correction to adjust for multiple comparisons. The estimated p-values for Fig. 2d, f and g are 0.001, 0.001 and 0.921, respectively. P-Check was tested on 1000 simulated data sets and was repeated 3 times. Scale bars –500 nm.
Fig. 3
Fig. 3. Super-resolution rendering of simulated marked point pattern data using MOM.
a Simulated ratiometric marked point pattern colour coded for GP value. The data here has clear separation in the GP values, with higher GP values within domains. b and c represent the same point pattern from a) but now the points are assigned marks according to their simulated photon yields in the two channels. In d and e the marked point pattern is spatially binned (pixel size = 50 nm) and the photons of the detected points within those bins summed, to generate a sub-diffraction rendering of the photons detected within the acquisition. f These two images can then be used to calculate a super-resolution rendering of the GP within the region. Scale bars –200 nm.
Fig. 4
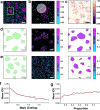
Fig. 4. Workflow and performance of JOSEPH on simulated marked point patterns.
a Simulated GP-marked point pattern containing high (magenta) and low order (cyan) domains. b) Zoom of the yellow highlighted region in a. c The GP value of each point is compared to its neighbours and assigned a local similarity score. Points on the boundaries of clusters typically display the lowest similarity scores. Clusters are constructed by iteratively attaching points to neighbours of high local similarity until a deviance threshold is met (here 0.2). JOSEPH performance on d) a spatially clustered distribution and e) a spatially random distribution, both with mark overlaps of ≈ 0.5. In (d and e) the convex hulls of the ground truth high order domains are shown (green polygons - right), and the underlying marked point patterns (centre, colour-coded according to GP value). Convex hulls determined by JOSEPH are shown (right), colour-coded with the average GP value of the points within the domain. f The graph of IoU versus GP mark distribution overlap (logarithmic trendline - red). g The graph of IoU vs proportion of points in domains (logarithmic trendline - red). JOSEPH was tested on 1000 simulated data sets and was repeated 3 times. Scale bars—panel (b) = 200 nm, all other panels = 500 nm.
Fig. 5
Fig. 5. Determination of membrane order and organisation in model membranes using di-4-ANEPPDHQ PAINT and PLASMA.
a Representative GP MOM of (a) DOPC and b) DPPC:Cholesterol membrane patches from a full-length acquisition (~8 mins). The right panel in each is a zoomed-in view of the yellow ROI in the left hand panel. Pixels in the MOMs are colour-coded according to GP, with black pixels denoting regions with no detected localisations. c and d are the P-Check weighted probabilities for DOPC and DPPC:Cholesterol membrane patches, respectively. P-Check does not find any statistically significant evidence of separation for either membrane type, as expected. e Histogram of the calculated GP values from individual localisations for DOPC (cyan) and DPPC:Cholesterol (magenta), showing a distinct shift in the measured membrane order between the two model membrane mixtures. P-Check uses a one-sided permutation test with Bonferroni correction to adjust for multiple comparisons. The estimated p-values for Fig. 5c, d were 0.68 and 0.11, respectively. GUV data come from two independent experiments' data and 179 ROIS (DOPC: 93; DPPC: 86) were taken for analysis. P-check analysis was repeated 3 times on the GUV data. Scale bars - 5μm in left hand images, and 500 nm in zoomed regions.
Fig. 6
Fig. 6. Quantifying changes in membrane domains and order in live cells using di-4-ANEPPDHQ PAINT with PLASMA.
a Representative MOM of live RAMA27 cell membrane (left) from a full-length acquisition (~8 mins), with zoomed-in views of the yellow and red ROIs (b). Pixels in the MOMs are colour coded according to GP value, with black pixels denoting regions with no detected localisations. c Exemplar region of di-4-ANEPPDHQ PAINT live cell data, reconstructed using MOM (top). Domains whose average GP values were significantly different to the global mean (i.e. average GP of all marked points in the ROI) were segmented by JOSEPH (bottom). Points belonging to the ordered domains were rendered with different colours, and the convex hulls were colour-coded according to the average GP value domain. d Average GP value for all points within selected ROIs for untreated (Control, magenta) and methyl-β-cyclodextrin (MBCD, cyan). Statistical significance was determined via two sample t-test over 57 control ROIs and 52 MBCD ROIs. Significance ranking: n.s - not significant, * p < 0.05, ** p < 0.01, *** p < 0.001. e Histogram of the frequency of domains identified by JOSEPH fell into intervals above (ordered) or below (disordered) the global average GP value (here, ~0.22 for untreated control and ~0.17 for MBCD) for both the untreated cells (Control, magenta) and those treated with methyl-β-cyclodextrin (MBCD, cyan). 109 ROIs from two independent experiments (total of 6 cells) were used for analysis (57 untreated ROIs, and 52 MBCD ROIs). The test for Fig. 6d was a two-sided t-test with one comparison made, so no adjustments were used. p-value for Fig. 6d was 10-6. Scale bars: a) 5 μm in left hand large FOV, and 500 nm in b).

References

    1. Levental, I., Levental, K. R. & Heberle, F. A. Lipid rafts: controversies resolved, mysteries remain. Trends Cell Biol.30, 341–353 (2020). - PMC - PubMed
    1. Sezgin, E., Levental, I., Mayor, S. & Eggeling, C. The mystery of membrane organization: composition, regulation and roles of lipid rafts. Nat. Rev. Mol. Cell Biol.18, 361–374 (2017). - PMC - PubMed
    1. Klymchenko, A. S. Solvatochromic and fluorogenic dyes as environment-sensitive probes: design and biological applications. Acc. Chem. Res50, 366–375 (2017). - PubMed
    1. Marsh, D. Polarity and permeation profiles in lipid membranes. Proc. Natl Acad. Sci. USA98, 7777–7782 (2001). - PMC - PubMed
    1. Jin, L. et al. Characterization and application of a new optical probe for membrane lipid domains. Biophys. J.90, 2563–2575 (2006). - PMC - PubMed

Publication types

LinkOut - more resources