. 2024 Nov 8;15(1):9664.
doi: 10.1038/s41467-024-53969-w.

mRNA delivery enabled by metal-organic nanoparticles

Affiliations

mRNA delivery enabled by metal-organic nanoparticles

Yuang Gu et al. Nat Commun. .

Abstract

mRNA therapeutics are set to revolutionize disease prevention and treatment, inspiring the development of platforms for safe and effective mRNA delivery. However, current mRNA delivery platforms face some challenges, including limited organ tropism for nonvaccine applications and inflammation induced by cationic nanoparticle components. Herein, we address these challenges through a versatile, noncationic nanoparticle platform whereby mRNA is assembled into a poly(ethylene glycol)-polyphenol network stabilized by metal ions. Screening a range of components and relative compositional ratios affords a library of stable, noncationic, and highly biocompatible metal-organic nanoparticles with robust mRNA transfection in vitro and in mice. Intravenous administration of the lead mRNA-containing metal-organic nanoparticles enables predominant protein expression and gene editing in the brain, liver, and kidney, while organ tropism is tuned by varying nanoparticle composition. This study opens an avenue for realizing metal-organic nanoparticle-enabled mRNA delivery, offering a modular approach to assembling mRNA therapeutics for health applications.


Conflict of interest statement

F.C., J.C., Y.G., and C.C.-J. have filed a patent application for this technology. F.C. is a shareholder of Messenger Bio Pty Ltd. The remaining authors declare no competing interests.

Figures
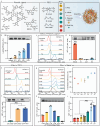
Fig. 1
Fig. 1. Formulation screening and optimization of mRNA-MPN NPs.
a Schematic depicting the synthesis of mRNA-MPN NPs through metal–phenolic-mediated assembly of PEG, mRNA, phenolic ligands, and metal ions. The number indicates the sequence of reagent addition. b Loading of mCherry-encoding mRNA in mRNA-MPN NPs (assembled with 20k linear PEG, EGCG, and ZrIV) at different EGCG-to-mRNA mass ratios. c, d Histogram of mCherry fluorescence (c) and mCherry MFI (d) of HEK 293T cells transfected for 24 h by mRNA-MPN NPs assembled with different phenolic ligands. p (EGCG vs TA) = 2.3 × 10−11, p (EGCG vs CAT) = 8.9 × 1012, p (EGCG vs GA) = 3.5 × 10−11. e, f Histogram of mCherry fluorescence (e) and mCherry MFI (f) of HEK 293T cells transfected for 24 h by mRNA-MPN NPs assembled with PEG of different Mw or structure. p (2k Linear vs 20k Linear) = 6.4 × 10−7, p (2k Linear vs 2k 4-Arm) = 4.9 × 10−7. g, h Histogram of mCherry fluorescence (g) and mCherry MFI (h) of HEK 293T cells transfected for 24 h by mRNA-MPN NPs assembled with different ZrIV-to-EGCG mass ratios. The insets in (b, d, f, h) show agarose gels with bands representing unbound mRNA (with naked mCherry mRNA, 1056 nucleotides, as a reference, in the first lane of each gel) in the NP formulations studied. i, j Transfection efficiency (i) and mCherry MFI (j) of HEK 293T cells transfected for 24 h by mRNA-MPN NPs assembled with various metal ions; p (ZrIV vs TmIII) = 1.1 × 10−6, p (ZrIV vs CuII) = 1.2 × 10−6, p (ZrIV vs NaI) = 5.4 × 10−6, p (ZrIV vs CrIII) = 1.1 × 10−5, p (TiIV vs TmIII) = 3.9 × 10−7, p (TiIV vs CuII) = 4.4 × 10−7, p (TiIV vs NaI) = 2.1 × 10−6, p (TiIV vs CrIII) = 4.6 × 10−6. Data are presented as mean values ± standard deviation (SD), n = 3 or 5. Statistical significance was analyzed using one-way analysis of variance (ANOVA) with Tukey’s multiple comparisons test. TA tannic acid, EGCG epigallocatechin gallate, CAT catechin, GA gallic acid, PEG poly(ethylene glycol), MFI mean fluorescence intensity. Source data are provided as a Source Data file.
Fig. 2
Fig. 2. Physicochemical characterization of lead mRNA-MPN NPs.
a Size distribution of mRNA-MPN NPs and MPN NPs measured by dynamic light scattering. The inset shows a Lattice-SIM image of an mRNA-MPN NP using Cy5-labeled mRNA. The scale bar is 200 nm. b Transmission electron microscopy (TEM) image and EDX mapping of mRNA-MPN NPs. c ζ-Potential of mRNA-MPN NPs across pH 4–9, as measured on a Zetasizer. d Percentage of mRNA loading into MPN NPs, as determined by agarose gel electrophoresis and fluorescence spectroscopy. Statistical significance was analyzed by the two-tailed unpaired t-test. ns not significant; p (Agarose vs Fluorescence) = 0.1109. e Release profiles of mRNA in RNase-free water and DMEM + 10% FBS at 37 °C. f Percentage of mRNA released from mRNA-MPN NPs after incubation in different solutions for 24 h. All experiments were performed in triplicates (n = 3), and data are presented as the mean ± SD. The lead mRNA-MPN NPs were assembled with 20k liner PEG, mRNA, EGCG, and ZrIV at a mass ratio of 100:1:100:2.5. DMEM Dulbecco’s modified eagle medium, FBS fetal bovine serum, EDTA ethylenediaminetetraacetic acid. Source data are provided as a Source Data file.
Fig. 3
Fig. 3. Versatility of in vitro transfection using lead mRNA-MPN NPs.
a (i–iii) Representative SIM images of the intracellular colocalization of mRNA-MPN NPs with endo/lysosomes 24 h post incubation. Endo/lysosomes (green) were stained with LysoTracker Green DND-26. mRNA (red) was conjugated with Cy5. Scale bars are 10 μm. (iv–vi) Representative high-magnification images (scale bars are 2 μm). (vii) Corresponding color scatter plot of endo/lysosomes (green channel) vs mRNA (red channel). b CLSM immunofluorescence staining showing the transfection of FLuc-encoding mRNA by mRNA-MPN NPs in HEK 293T cells after 24 h. Cell membranes (green) were stained with AF488-wheat germ agglutinin conjugate (AF488-WGA). Luciferase was detected with AF647-labeled anti-luciferase antibodies (red). Scale bars are 20 μm. c Representative CLSM images showing the transfection of NGFR-encoding mRNA in HEK 293T cells after 24 h. NGFR was stained with phycoerythrin-conjugated anti-NGFR. Nuclei were stained with Hoechst 33342. Scale bars are 20 μm. df Percentage of transfection (d), MFI (e), and representative CLSM images (f) of adherent cells (HEK 293T) transfected by RNAiMax or mRNA (mCherry)-MPN NPs after 24 h. Cell membranes were stained green. Scale bars are 20 μm. gi Percentage of transfection (g), MFI (h), and representative CLSM images (i) of suspension cells (Jurkat) transfected by RNAiMax or mRNA (mCherry)-MPN NPs after 24 h. Cell membranes were stained green. Scale bars are 20 μm. All experiments were performed in triplicates (n = 3) and data are presented as mean values ± SD. Statistical significance was analyzed using one-way ANOVA with Tukey’s multiple comparisons test. In d, p (RNAiMax vs mRNA-MPN NPs) = 1.6 × 10−5. In e, p (RNAiMax vs mRNA-MPN NPs) = 0.0010. In g, p (RNAiMax vs mRNA-MPN NPs) = 2.3 × 10−6. In h, p (RNAiMax vs mRNA-MPN NPs) = 2.0 × 10−6. The lead mRNA-MPN NPs were assembled with 20k liner PEG, mRNA, EGCG, and ZrIV at a mass ratio of 100:1:100:2.5. Cy5 cyanine 5, FLuc firefly luciferase, NGFR nerve growth factor receptor, MFI mean fluorescence intensity. Source data are provided as a Source Data file.
Fig. 4
Fig. 4. In vivo mRNA transfection in C57BL/6J mice using mRNA-MPN NPs.
a Schematic illustration of IV administration of mRNA-MPN NPs and subsequent IVIS imaging. b mScarlet3 expression in different organs of C57BL/6J mice analyzed by IVIS 24 h post IV injection of mRNA-MPN NPs (lead formulation; mRNA at a dose of 0.25 mg kg1). c, d Comparison of mScarlet3 expression using mRNA-MPN NPs and mRNA-SM-102 LNPs: both quantitative (c) and representative images (d) were obtained from IVIS. For b, c five mice were included in each group (n = 5), and the quantitative data were normalized to DPBS-treated mice (negative control) and presented as mean values ± SD. The fluorescence signal observed in DPBS-treated mice may be due to tissue autofluorescence, which is often observed at the excitation and emission wavelengths of 561 nm and 594 nm, respectively. Statistical significance was analyzed using the two-tailed unpaired t-test. In c, p (mRNA-MPN NPs vs mRNA-SM102 LNPs) = 0.0041. eg CLSM images of sectioned liver (e), kidney (f), and brain (g) tissues post IVIS imaging. Cell nuclei were stained with 4′,6-diamidino-2-phenylindole (DAPI). Red fluorescence indicates expressed emiRFP670. h Schematic illustration of an Ai14 Cre reporter model that could express tdTom by translating Cre-recombinase mRNA to Cre protein to delete the loxP-flanked stop cassette. i, j CLSM images of sectioned liver and kidney (i) and brain (j) tissues 48 h post IV injection of Cre-MPN NPs (mRNA dose at 0.25 mg kg1). Red fluorescence indicates expressed tdTom. Cell nuclei were stained with DAPI. Blood vessels were stained with Lectin-Dylight 488, which was injected intravenously 5 min before euthanizing the mice. IV intravenous, IVIS in vivo imaging system, DPBS Dulbecco’s phosphate-buffered saline, LNPs lipid nanoparticles, tdTom tdTomato. Panel (a) and parts of panels (c, h) were created with BioRender.com. Source data are provided as a Source Data file.
Fig. 5
Fig. 5. In vivo biocompatibility and metal excretion from mRNA-MPN NPs.
a Release of cytokines (IL-6 and TNF-α) in plasma collected from mice treated with DPBS (negative control) or mRNA-MPN NPs. Statistical significance was analyzed using the two-tailed unpaired t-test. p (DPBS vs mRNA-MPN NPs): IL-6, 0.1514; TNF-α, 0.4337). The plasma from five biologically independent mice was included in each group (n = 5) and the data are presented as mean values ± SD. b H&E staining of organs harvested from mice treated with DPBS or mRNA-MPN NPs after 24 h. c Zr excretion profiles from harvested organs and body fluids (i.e., urine and blood) post-treatment with DPBS or mRNA-MPN NPs, as measured by ICP-MS elemental analysis. Zr excretion is presented as the amount of Zr per gram of organ or body fluid collected from mice. Statistical significance was analyzed using two-way ANOVA. p (DPBS vs 10 days): liver, 0.6050; brain, 0.9979; kidney, 0.9959; lung, >0.9999; spleen, 0.4403; heart, 0.9988; urine, >0.9999; and blood, >0.9999. Three biologically independent mice were included for each group (i.e., each time point and DPBS) (n = 3). Data are presented as mean values ± SD. IL-6 interleukin-6, TNF-α tumor necrosis factor-α, DPBS Dulbecco’s phosphate-buffered saline. Source data are provided as a Source Data file.
Fig. 6
Fig. 6. In vivo mRNA expression in C57BL/6J mice using mRNA-MPN NPs with various highly performing formulations.
ai mScarlet3 expression in harvested organs using MPN NPs under varying conditions: treatment time (a, b); ZrIV-to-EGCG mass ratio (ce); metal ions (fh); and Mw and structure of PEG (i). Both quantitative results (i.e., bar diagrams) and representative images of the biodistribution were obtained by IVIS. For all quantitative results demonstrated in Fig. 6, four or five biologically independent mice were included in each group (n = 4 or 5), and the quantitative data were normalized to DPBS (negative control). In fh the whiskers of the plot define the minimal and maximal values of individual data points, with the center line of the box representing the mean value of the data set. Li liver, K kidney, Lu lung, H heart, S spleen, B brain, PEG poly(ethylene glycol), EGCG epigallocatechin. Statistical significance was analyzed using one-way ANOVA or one-way ANOVA with Tukey’s multiple comparisons test. In c **p = 0.0066. In d ****p = 5.1 × 10−5, **p = 0.0078. In e **p = 0.0078. In f **p = 0.0013. In g ****p = 3 × 10−6. In h **p = 0.0036, *p = 0.0270. In i **p = 0.0016. All data are presented as mean values ± SD. DPBS Dulbecco’s phosphate-buffered saline, EGCG epigallocatechin, PEG poly(ethylene glycol). Source data are provided as a Source Data file.

References

    1. Rohner, E., Yang, R., Foo, K. S., Goedel, A. & Chien, K. R. Unlocking the promise of mRNA therapeutics. Nat. Biotechnol.40, 1586–1600 (2022). - PubMed
    1. Stadelmann, C. et al. mRNA-mediated delivery of gene editing tools to human primary muscle stem cells. Mol. Ther. Nucleic Acids28, 47–57 (2022). - PMC - PubMed
    1. Conde, J., Langer, R. & Rueff, J. mRNA therapy at the convergence of genetics and nanomedicine. Nat. Nanotechnol.18, 537–240 (2023). - PubMed
    1. Vavilis, T. et al. mRNA in the context of protein replacement therapy. Pharmaceutics15, 166 (2023). - PMC - PubMed
    1. Magadum, A., Kaur, K. & Zangi, L. mRNA-based protein replacement therapy for the heart. Mol. Ther.27, 785–793 (2019). - PMC - PubMed

Publication types

LinkOut - more resources