. 2024 Nov 7;15(1):9618.
doi: 10.1038/s41467-024-54004-8.

HuD impairs neuromuscular junctions and induces apoptosis in human iPSC and Drosophila ALS models

Affiliations

HuD impairs neuromuscular junctions and induces apoptosis in human iPSC and Drosophila ALS models

Beatrice Silvestri et al. Nat Commun. .

Abstract

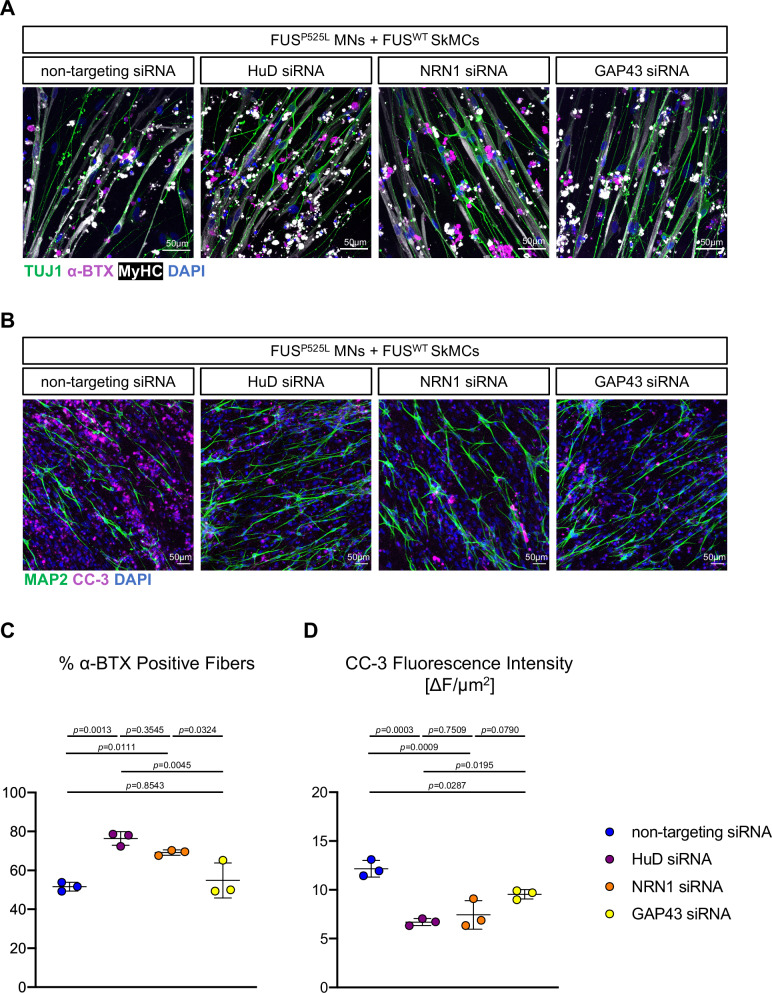
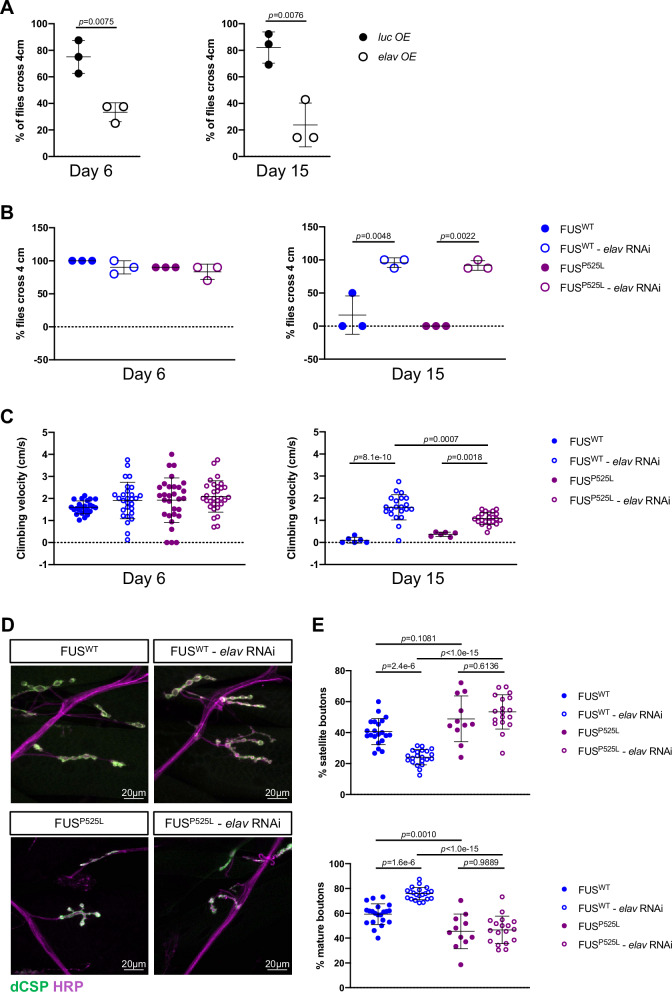
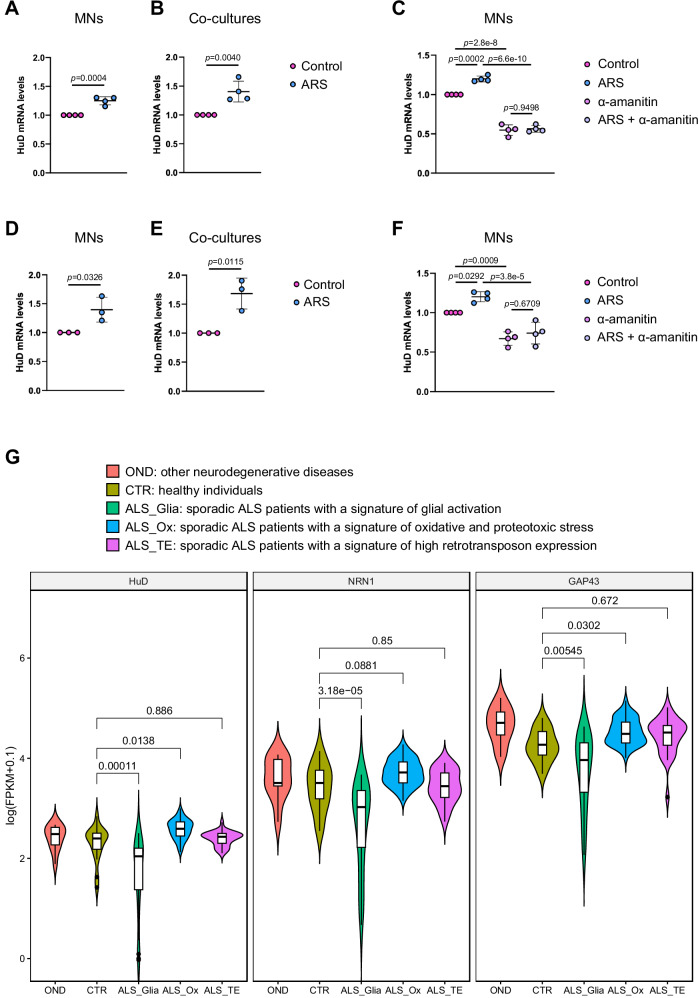
Defects at the neuromuscular junction (NMJ) are among the earliest hallmarks of amyotrophic lateral sclerosis (ALS). According to the "dying-back" hypothesis, NMJ disruption not only precedes but also triggers the subsequent degeneration of motoneurons in both sporadic (sALS) and familial (fALS) ALS. Using human induced pluripotent stem cells (iPSCs), we show that the RNA-binding protein HuD (ELAVL4) contributes to NMJ defects and apoptosis in FUS-ALS. HuD overexpression mimics the severe FUSP525L mutation, while its knockdown rescues the FUSP525L phenotypes. In Drosophila, neuronal overexpression of the HuD ortholog, elav, induces motor dysfunction, and its knockdown improves motor function in a FUS-ALS model. Finally, we report increased HuD levels upon oxidative stress in human motoneurons and in sALS patients with an oxidative stress signature. Based on these findings, we propose that HuD plays a role downstream of FUS mutations in fALS and in sALS related to oxidative stress.


Conflict of interest statement

The authors declare no competing interests.

Figures

Fig. 1
Fig. 1. Establishment of iPSCs derived MNs and SkMCs co-cultures and functional analysis of NMJs.
A Schematic representation of the differentiation protocol to generate co-cultures of spinal MNs and SkMCs. A more detailed SkMC differentiation scheme is shown in Supplementary Fig. S1. B Phase-contrast image of MNs and SkMCs co-culture derived from FUSWT iPSCs at day 14. Examples of MN cell body and SkMC are indicated by arrows. Scale bar: 20 μm. C, D Immunostaining analysis of co-cultures at the indicated time points. α-BTX (magenta) was used as a AChRs clustering marker, TUJ1 (TUBB3, green in (C)) and MyHC (grey) are, respectively, neuronal and muscular markers. SYP (green in (D)) is a presynaptic marker. DAPI (blue) was used for nuclear staining. Scale bar: 15 μm, 10 μm, or 5 μm as indicated. E The graph shows the number of contractions per minute in day 50 co-cultures before treatment, 5′ upon glutamate addition, and 5′ upon further addition of tubocurarine. Contractions were counted in 3 randomly selected fields (each represented by dots connected by a line) of 3 independent co-cultures. One representative monoculture of SkMCs only, showing no contractions in all conditions, is also displayed. Two-way repeated measures ANOVA (performed only among co-cultures): for treatment comparison p = 6.6 × 10−8, for replicate comparison p = 0.0837; post hoc Tukey test p values for multiple comparisons among treatments within each replicate are indicated in the graph. Source data are provided as a Source Data file.
Fig. 2
Fig. 2. NMJ analysis in co-cultures.
A Schematic representation of co-cultures used for analyses shown in Figs. 2–5. B Representative images of immunofluorescence staining of day 14 co-cultures using the indicated primary antibodies and α-BTX and DAPI. Scale bar for all panels: 50 μm. C The graphs report quantitative analysis of the percentage of α-BTX positive fibers (left) and TUJ1 fluorescence intensity (right), at day 14 and 28 of co-culture. Each dot represents a replicate, consisting of an individual batch of differentiated iPSCs. For each replicate, the following number of randomly selected fields were used for the α-BTX analysis: 6 (day 14 all genotypes, replicates 1 and 2; day 28 FUSWT, replicate 1; day 28 FUSWT + HuD, replicate 3); 5 (day 14 all genotypes, replicate 3; day 28 FUSWT, replicate 3; day 28 FUSP525L, all replicates) or 4 (day 28 FUSWT, replicate 2; day 28 FUSWT + HuD, replicates 1 and 2). 6 randomly selected fields were used for each replicate of the TUJ1 analysis. Error bars indicate standard deviation calculated on the average value of the replicates. Ordinary two-way ANOVA: for α-BTX positive fibers, p = 0.0715 between day 14 and 28, p = 9.7 × 10−10 among genotypes; for TUJ1 fluorescence intensity, p = 1.3 × 10−6 between day 14 and 28, p = 9.7 × 10−7 among genotypes; relevant post hoc Tukey test p values for multiple comparisons among genotypes within each time point are indicated in the graph. Source data are provided as a Source Data file.
Fig. 3
Fig. 3. Endplate maturation analysis in co-cultures.
A Representative images of immunofluorescence staining of day 14 co-cultures using the MyHC antibody and α-BTX and DAPI. Images show representative endplates that were categorized based on morphology into diffuse puncta, aligned puncta (indicated by arrows) and dense/cluster. Scale bar: 10 μm. B The graph shows quantification of endplates categories, as a percentage, from co-cultures obtained with FUSWT SkMCs and FUSWT, FUSP525L, or FUSWT + HuD MNs. The results of a blind analysis of 165 (FUS WT), 124 (FUSP525L), and 147 (FUSWT+HuD) total endplates from 3 batches of differentiated cells are shown. Fisher’s exact test with Bonferroni correction for multiple testing. Source data are provided as a Source Data file.
Fig. 4
Fig. 4. Cell death analysis.
A Representative brightfield images of co-cultures at day 28. Scale bar: 20 μm. B Quantitative analysis of dead cells using ethidium homodimer-1 at day 7, 14, 21, 28 of co-cultures obtained with FUSWT SkMCs and FUSWT, FUSP525L, or FUSWT + HuD MNs. The graph shows the average (dots) and standard deviation from 3 batches of differentiated cells. For each replicate, 5 fields have been acquired at each time point. Ordinary two-way ANOVA: p = 1.2 × 10−9 for genotypes comparison, p = 3.0 × 10−15 time points comparison, p = 2.0 × 10−7 for their interaction; post hoc Tukey test p values for multiple comparisons among genotypes within each time point, and among day 7 and later time points within each genotype, are indicated in the table. See Supplementary Fig. S3 for representative images of the cells. C Representative merged images of immunofluorescence staining of day 14 co-cultures (left panels) or MN monocultures (right panels) using Cleaved Caspase-3 (CC-3) and MAP2 antibodies, and DAPI. Scale bar: 50 μm. Single panels are shown in Supplementary Fig. S4. D, E The graphs report quantitative analysis of the CC-3 fluorescence intensity at day 14 and 28 of MNs monoculture (D) or co-cultures (E). Each dot represents a replicate, consisting of an individual batch of differentiated iPSCs. For each replicate, 6 fields have been acquired and the dot shows the average value. Error bars indicate standard deviation calculated on the average value of the replicates. Ordinary two-way ANOVA. No significant differences resulted from the comparison of MN monocultures (D). For the co-cultures (E), p = 2.1 × 10−7 for genotypes comparison, p = 0.0003 for time points comparison, p = 0.0324 for their interaction; relevant post hoc Tukey test p values for multiple comparisons are indicated in the graph. Source data are provided as a Source Data file.
Fig. 5
Fig. 5. HuD, NRN1 and GAP43 knockdown in co-cultures containing FUSP525L MNs.
A, B Representative merged images of day 14 co-cultures obtained with FUSWT SkMCs and FUSP525L MNs transfected with the indicated siRNAs and stained with the indicated antibodies. Scale bar: 50 μm. Single panels are shown in Supplementary Fig. S7. C, D The graphs report quantitative analysis of the percentage of α-BTX positive fibers (C) and CC-3 fluorescence intensity (D), at day 14 of co-culture as in (A, B). Each dot represents an individual batch of differentiated iPSCs transfected with the indicated siRNAs. The following number of randomly selected fields were used for the α-BTX analysis: 5 (non-targeting siRNA replicate 1 and 2, HuD siRNA replicate 2); 7 (GAP43 siRNA replicate 3); 6 (all other replicates). The following number of randomly selected fields were used for the CC-3 analysis: 8 (non-targeting siRNA replicate 3, HuD siRNA replicate 1, NRN1 siRNA replicate 3); 9 (HuD siRNA replicate 2 and 3; non-targeting siRNA replicate 1); 10 (all other replicates). The dot shows the average value. Error bars indicate standard deviation calculated on the average value of the replicates. Ordinary one-way ANOVA, p = 0.0009 for α-BTX positive fibers, p = 0.0003 for CC-3 immunofluorescence; post hoc Tukey test p-values for multiple comparisons are indicated in the graph. Source data are provided as a Source Data file.
Fig. 6
Fig. 6. Expression of Drosophila HuD ortholog elav modifies FUS-mediated motor dysfunction.
A The graphs represent the percentage of flies that climb 4 cm in 10 s at day 6 and day 15 in overexpressing elav (elav OE) or Luciferase (luc OE) as a control, respectively. N = 3 experimental replicates (trials) with 8 (day 6, both luc OE and elav OE), 13 (day 15, luc OE) or 7 (day 15, elav OE) flies each. Student’s t-test, unpaired, two tails, p-values are indicated in the graphs. B The graphs show percent flies that climb 4 cm in 10 s at day 6 and day 15 in wild-type or mutant FUS (p.P525L) with or without elav RNAi. N = 3 experimental replicates (trials) with 8 (day 6, FUSWT), 10 (day 6, all other groups), 2 (day 15, FUSWT), 3 (day 15, FUSP525L), or 8 (day 15, all other groups) flies each. Ordinary one-way ANOVA, relevant post hoc Tukey test p-values for multiple comparisons are indicated in the graphs. C The graphs show the climbing velocity (cm/s) of flies as in (B). Each data point represents one fly. The following numbers of flies have been used: 24 (day 6, FUSWT), 28 (day 6, FUSWT - elav RNAi), 30 (day 6, both FUSP525L and FUSP525L - elav RNAi), 6 (at day 15, both FUSWT and FUSP525L), 21 (FUSWT - elav RNAi), 22 (FUSP525L - elav RNAi). Ordinary one-way ANOVA, relevant post hoc Tukey test p-values for multiple comparisons are indicated in the graphs. D Immunohistochemistry analysis of the neuronal marker horseradish peroxidase (HRP) and the synaptic vesicle marker cysteine string protein (dCSP) in third instar larvae expressing FUSWT or FUSP525L, with or without elav RNAi. E The graphs show quantitative analysis of the percentage of satellite and mature boutons in larvae as in (D). N = 8 larvae per genotype. Ordinary one-way ANOVA, relevant post hoc Tukey test p-values for multiple comparisons are indicated in the graphs. In all graphs, bars indicate the mean and standard deviation. Source data are provided as a Source Data file.
Fig. 7
Fig. 7. HuD expression upon oxidative stress in vitro and in sporadic ALS patients.
A, B The graphs show quantitative analysis of HuD mRNA levels in control conditions or upon acute stress treatment with 0.5 mM sodium arsenite (ARS) for 1 h in FUSWT iPSCs derived spinal MNs monocultures at day 12 (A) or FUSWT iPSCs derived co-cultures at day 7 (B) (n = 4). C Cells as in (A) were pre-treated or not with α-amanitin before oxidative stress induction with ARS (n = 4). DF The experiments shown in (AC) were repeated with the WTSI-FUSWT iPSC line (n = 3 in (D, E); n = 4 in (F)). In (AF) ATP5O expression was used for normalization and the graphs show the average, standard deviation, and p-values from 3 or 4 replicates, each consisting of a batch of differentiated iPSCs. A, B, D, E: Student’s t-test, unpaired, two tails, p-values are indicated in the graphs. C, F: ordinary one-way ANOVA, p = 1.0 × 10−10 (C), p = 7.5 × 10−6 (F); relevant post hoc Tukey test p-values for multiple comparisons are indicated in the graphs. In all graphs, bars indicate the mean and standard deviation, (G) Violin plots showing the expression levels, reported as log-transformed FPKM values, of HuD, NRN1, and GAP43 in post-mortem sporadic ALS patients’ cortex samples. The adjusted p-values obtained from differential expression analyses have been corrected for multiple comparisons via the Benjamini-Hochberg procedure. Box boundaries: first and third quartile (Q1 and Q3); central line of box: median; whisker boundaries: the smallest and largest values within 1.5 times the interquartile range from Q1 and Q3. Source data are provided as a Source Data file.

References

    1. Brown, R. H. & Al-Chalabi, A. Amyotrophic lateral sclerosis. N. Engl. J. Med.377, 162–172 (2017). - PubMed
    1. Dassi, E. Handshakes and fights: the regulatory interplay of RNA-binding proteins. Front. Mol. Biosci.4, 67 (2017). - PMC - PubMed
    1. Blokhuis, A. M. et al. Comparative interactomics analysis of different ALS-associated proteins identifies converging molecular pathways. Acta Neuropathol.132, 175–196 (2016). - PMC - PubMed
    1. De Santis, R. et al. Mutant FUS and ELAVL4 (HuD) aberrant crosstalk in amyotrophic lateral sclerosis. Cell Rep.27, 3818–3831.e5 (2019). - PMC - PubMed
    1. Garone, M. G. et al. ALS-related FUS mutations alter axon growth in motoneurons and affect HuD/ELAVL4 and FMRP activity. Commun. Biol.4, 1025 (2021). - PMC - PubMed

Publication types

MeSH terms

Associated data

LinkOut - more resources