. 2024 Nov 7;7(1):1460.
doi: 10.1038/s42003-024-07143-z.

Targeting protein homeostasis with small molecules as a strategy for the development of pan-coronavirus antiviral therapies

Affiliations

Targeting protein homeostasis with small molecules as a strategy for the development of pan-coronavirus antiviral therapies

Yu-Qian Mao et al. Commun Biol. .

Abstract

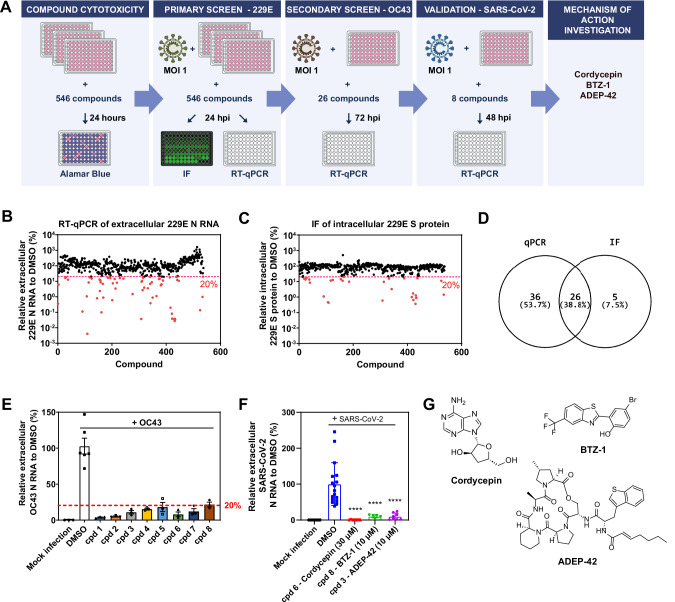
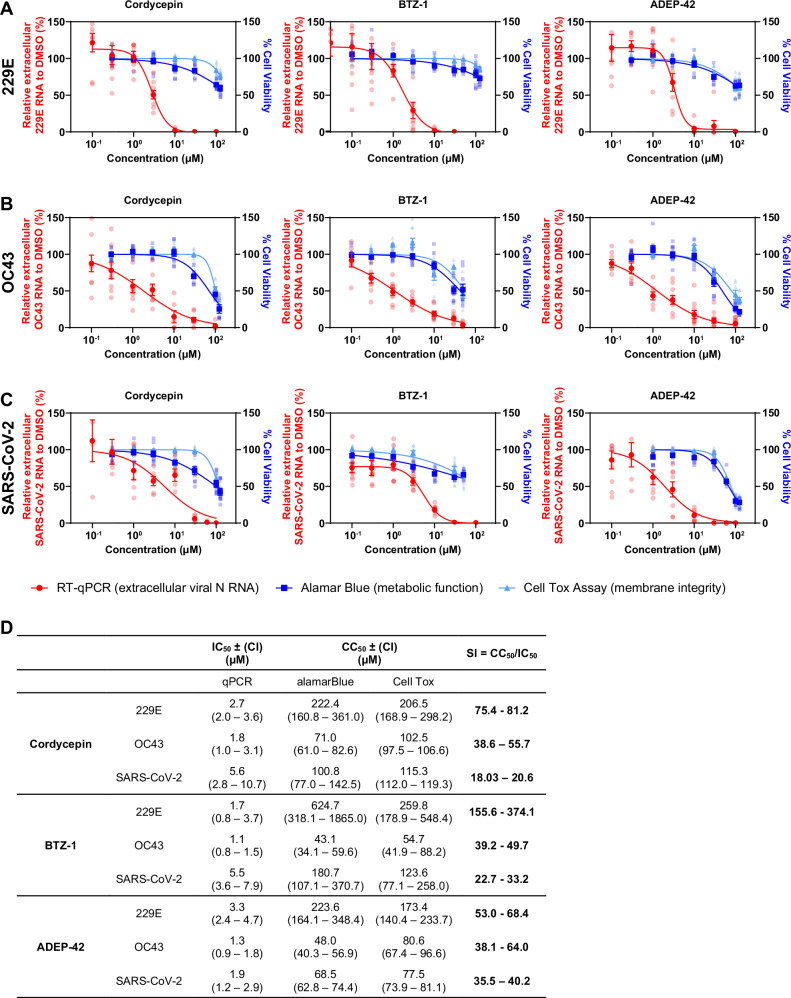
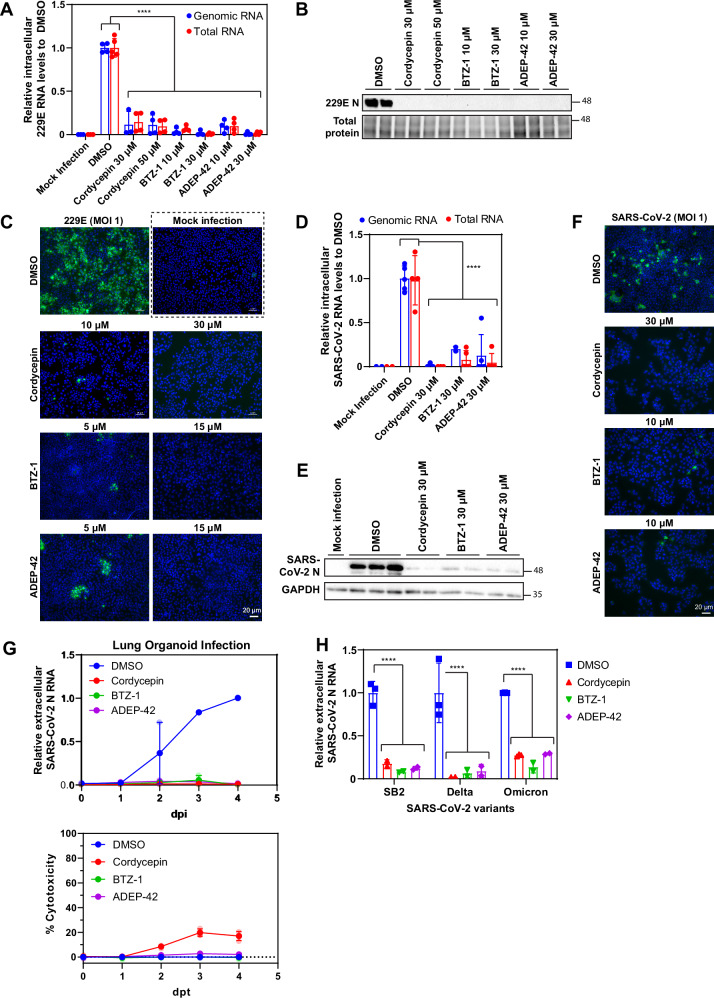
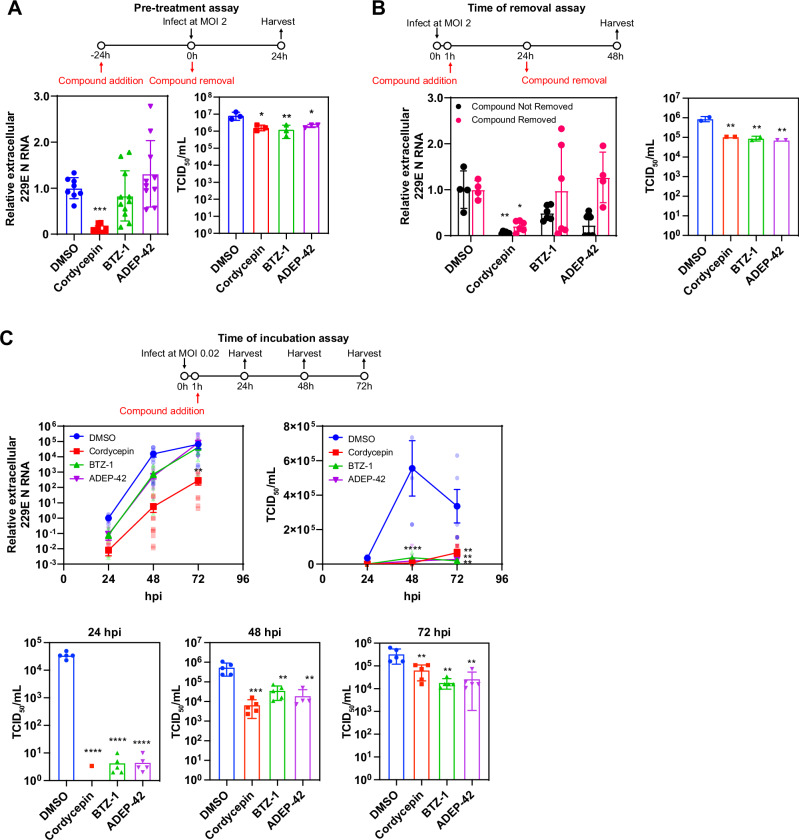
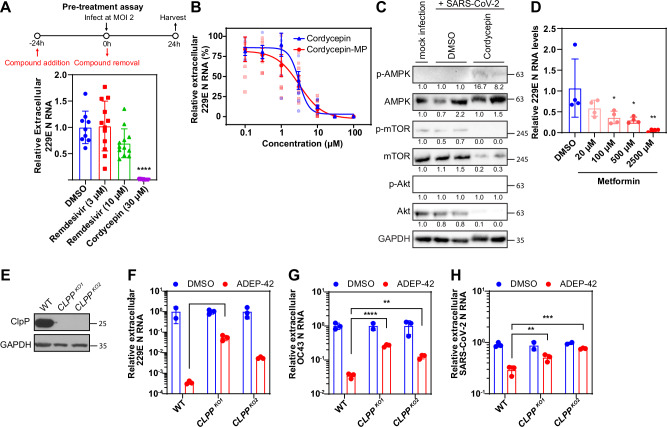
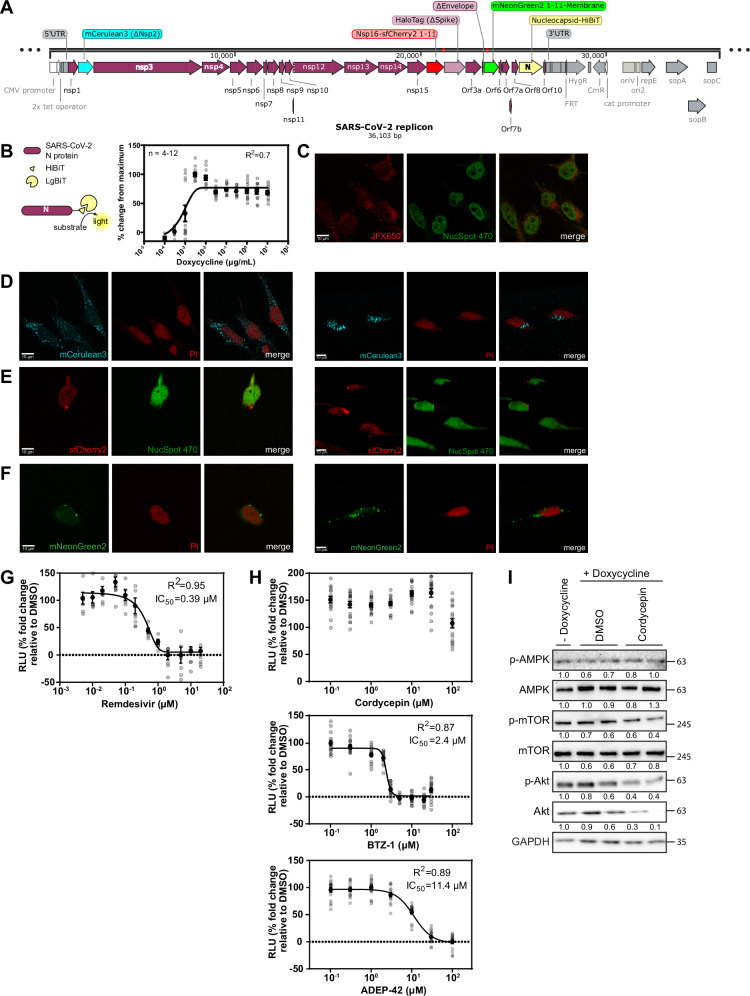
The COVID-19 pandemic has created a global health crisis, with challenges arising from the ongoing evolution of the SARS-CoV-2 virus, the emergence of new strains, and the long-term effects of COVID-19. Aiming to overcome the development of viral resistance, our study here focused on developing broad-spectrum pan-coronavirus antiviral therapies by targeting host protein quality control mechanisms essential for viral replication. Screening an in-house compound library led to the discovery of three candidate compounds targeting cellular proteostasis. The three compounds are (1) the nucleotide analog cordycepin, (2) a benzothiozole analog, and (3) an acyldepsipeptide analog initially developed as part of a campaign to target the mitochondrial ClpP protease. These compounds demonstrated dose-dependent efficacy against multiple coronaviruses, including SARS-CoV-2, effectively inhibiting viral replication in vitro as well as in lung organoids. Notably, the compounds also showed efficacy against SARS-CoV-2 delta and omicron strains. As part of this work, we developed a BSL2-level cell-integrated SARS-CoV-2 replicon, which could serve as a valuable tool for high-throughput screening and studying intracellular viral replication. Our study should aid in the advancement of antiviral drug development efforts.


Conflict of interest statement

The authors declare no competing interests.

Figures

Fig. 1
Fig. 1. Small molecule screen against multiple coronaviruses.
A Schematic of the workflow for the drug screening campaign. B Relative extracellular 229E N RNA levels in the media of 229E (MOI 1) infected Huh-7 cells detected by RT-qPCR after treatment with compound library compared to DMSO. Compounds reducing RNA levels below 20% are highlighted in red. C Relative intracellular 229E S protein levels in 229E (MOI 1) infected Huh-7 cells detected by IF after treatment with compound library compared to DMSO. Compounds reducing S protein levels below 20% are highlighted in red. D Overlap of compounds reducing both 229E RNA and protein levels. E Compounds that reduced extracellular OC43 N RNA levels in OC43 (MOI 1) infected Huh-7 cells below 20% compared to DMSO are shown. Mean ± SEM shown. F Compounds that reduced extracellular SARS-CoV-2 N RNA levels in SARS-CoV-2 (MOI 1) infected Huh-7-ACE2 cells below 20% compared to DMSO. cpd 6 = Cordycepin, cpd 8 = BTZ-1, cpd 3 = ADEP-42. Mean ± SEM shown generated from n = 3 independent experiments, each performed in triplicates. ****p < 0.0001. G Structures of the three candidate compounds identified in the screen.
Fig. 2
Fig. 2. Efficacy of lead compounds on 229E, OC43, and SARS-CoV-2 replication.
Concentration-response curves of indicated compounds for 229E (A) or OC43 (B) infected Huh-7 cells, or SARS-CoV-2 (C) infected Huh-7-ACE2 cells. All infections were carried out at MOI 1. Samples were collected at 24 hpi for 229E, 72 hpi for OC43, and 48 hpi for SARS-CoV-2. Viral RNA released was measured by RT-qPCR shown in red. Cell viability curves of mock-infected cells measured by alamarBlue and CellTox Green cytotoxicity assays are shown in blue and cyan, respectively. Mean ± SEM shown is generated from n = 3 independent experiments, each performed in triplicates. D Summary table of IC50, CC50, and selectivity index (SI) values for indicated compounds against different coronavirus species.
Fig. 3
Fig. 3. Effect of lead compounds on the expression of viral RNA and proteins.
A Relative intracellular 229E RNA levels in 229E (MOI 1) infected Huh-7 cells after treatment with cordycepin, BTZ-1 and ADEP-42 at the indicated concentrations compared to DMSO for 24 hours. Genomic RNA (blue) was measured using primers against Orf1a, and total RNA (red) was measured using primers against N, both were normalized to actin mRNA. Mean ± SD shown from 2 independent experiments, each performed in duplicates. ****p < 0.0001. B Representative western blot of 229E N protein levels in samples treated as in A. Lysates were stained with anti-coronavirus N antibody and total protein was visualized using stain-free imaging. Molecular weight (MW) markers are given on the right in kDa. C Representative images of 229E S protein levels in samples treated as in A. Cells were fixed, processed for IF, and stained with anti-229E S antibody (green) and DAPI (blue). D Relative intracellular SARS-CoV-2 RNA levels in infected Huh-7 cells after treatment with cordycepin, BTZ-1 and ADEP-42 at 30 µM compared to DMSO for 48 hours. RNA was extracted and processed as in (A). Mean ± SD shown from 2 independent experiments, each performed in duplicate. ****p < 0.0001. E Representative western blot of SARS-CoV-2 N protein levels in samples treated as in D. The lysates were stained with anti-SARS-CoV-2 N antibody and GAPDH. MW markers are given on the right in kDa. F Representative images of SARS-CoV-2 S protein in infected Huh-7 cells after treatment with cordycepin at 30 µM, BTZ-1 at 10 µM, and ADEP-42 at 10 µM. Samples were fixed 48 hpi, processed for IF, and stained with anti-SARS-CoV-2 S antibody (green) and DAPI (blue). G Top: Effects of compounds on extracellular SARS-CoV-2 N RNA levels in infected (MOI 1) 3D lung organoids measured over days post infection (dpi). Bottom: Effects of compounds on cell viability as measured by LDH release over days post-treatment (dpt). Cordycepin (30 µM), BTZ-1 (10 µM) and ADEP-42 (10 µM) were compared with DMSO treatment. H Relative extracellular SARS-CoV-2 variants N RNA levels in media of infected Huh-7 cells after treatment with cordycepin (30 µM), BTZ-1 (10 µM) and ADEP-42 (10 µM) compared to DMSO.
Fig. 4
Fig. 4. Effect of time of addition on compound efficacy.
A Kinetics of 229E viral RNA release monitored by RT-qPCR (top panel) and by N protein expression (bottom panel) in Huh-7 cells infected at MOI 2. For viral RNA release, mean ± SD is shown from n = 4 independent experiments, each performed in triplicates. Representative western blot of N protein expression shown from n = 2 independent experiments each performed in duplicates. MW markers are given on the right in kDa. B Shown are the time of addition assays for 229E infection of Huh-7 cells at MOI 2. The assay timeline is shown as a schematic on top. Compounds were added at the indicated hpi, and released viruses were harvested 24 hpi and then analyzed by RT-qPCR (left) and TCID50 (right). Cordycepin was used at 30 μM, BTZ-1 at 10 μM, and ADEP-42 at 10 μM. Mean ± SD shown from n = 2 independent experiments, each performed in triplicates. ****p < 0.0001. C, D Huh-7 cells were infected with 229E virus at MOI 2 and treated with DMSO or compounds at 16 hpi. Cells were fixed 4.5 h post compound addition and probed for C total and D genomic viral RNA localization by FISH. Representative images of n = 3 independent experiments are shown. E Enrichment score of perinuclear foci observed in genomic DNA staining of samples in D. Foci were analyzed by CellProfiler, classified, and quantified by CellProfiler Analyst (Supplemental Data File 2). Mean ± SD shown from n = 3 independent experiments. *p < 0.05. F Relative intracellular 229E RNA levels in 229E (MOI 1) infected Huh-7 cells treated as in C and D, where compounds were added 16 hpi and samples were harvested 4.5 h post compound addition. Genomic RNA (blue) was measured using primers against Orf1a, and total RNA (red) was measured using primers against N, both were normalized to actin mRNA. Mean ± SD shown from 3 independent experiments, each performed in duplicates. G Relative extracellular 229E N RNA levels in 229E (MOI 1) infected Huh-7 cells treated as in F, where compounds were added 16 hpi and samples were harvested 4.5 h post compound addition. Mean ± SD shown from 3 independent experiments, each performed in duplicates. ****p < 0.0001, ***p < 0.001, **p 0.01.
Fig. 5
Fig. 5. Effect of pretreatment, time of removal, and time of incubation on compound efficacy.
For all assays, cordycepin was used at 30 μM, BTZ-1 at 10 μM, and ADEP-42 at 10 μM. 229E was used to infect Huh-7 cells at MOI 2 unless otherwise indicated. Media samples harvested were analyzed for RNA release by RT-qPCR and for viral infectivity by TCID50. A Shown are pretreatment assays with the assay timeline given in the schematic. Compounds were added 24 h before infection and removed at the time of infection. Media were harvested 24 hpi; RNA release (left) and viral infectivity (right) were then analyzed. For RNA release, mean ± SD are shown from n = 3 independent experiments, each performed in triplicates, ***p < 0.001. For viral infectivity, mean ± SD are shown from n = 1 experiment, performed in triplicate, **p < 0.01, *p < 0.05. B Shown are time of removal assays with assay timeline given in schematic. Compounds were added at 1 hpi and removed or not removed at 24 hpi as indicated. Media were harvested at 48 hpi; RNA release (left) and viral infectivity (right) were then analyzed. For RNA release, mean ± SD are shown from n = 2 independent experiments, each performed in triplicates, **p < 0.01, *p < 0.05. For viral infectivity, mean ± SD are shown from n = 1 independent experiment, performed in duplicate, **p < 0.01. C Shown are the time of incubation assays with the assay timeline given in the schematic. Cells were infected at MOI 0.02, compounds were added 1 hpi, and harvested at 24, 48, as well as 72 hpi. RNA release (left) and viral infectivity (right and panels below) were analyzed for each timepoint. For both RNA release and viral infectivity, mean ± SEM are shown from n = 3 independent experiments, each performed in triplicates, ****p < 0.0001, **p < 0.01, *p < 0.05.
Fig. 6
Fig. 6. Molecular basis of cordycepin and ADEP-42 activity.
A Pretreatment assay comparing cordycepin to remdesivir with assay timeline given in schematic. Compounds were added 24 h before infection and removed at time of infection. Media were harvested 24 hpi and extracellular RNA release was then analyzed. Mean ± SD are shown from n = 3 independent experiments, each performed in quadruplicates, ****p < 0.0001. B Dose-response of cordycepin and cordycepin-monophosphate (cordycepin-MP) in 229E infected Huh-7 cells (MOI 1) after 24 hpi. Extracellular viral RNA released was measured by RT-qPCR and normalized to DMSO control. Mean ± SEM shown are generated from n = 3 independent experiments, each performed in triplicates. C Western blot analysis of AMPK, mTOR, and Akt in cordycepin treated SARS-CoV-2 infected samples compared to DMSO control. Huh-7 cells were infected with SARS-CoV-2 at MOI 2, treated with DMSO or 30 µM cordycepin after 1 hour, and samples were harvested 48 hpi. Mock-infected samples were treated with DMSO. Lysates were stained with AMPKα, phospho-AMPKα (Thr172), mTOR, phospho-mTOR (Ser2448), Akt, phospho-Akt (Ser473), and GAPDH antibodies. MW markers are given on the right in kDa. D RT-qPCR quantification of extracellular 229E N RNA levels after infection (MOI 1) and treatment with various concentrations of metformin for 24 hours in Huh-7 cells. Mean ± SD shown from 4 replicates. E Representative western blot of wild type (WT) and CLPP knockout (CLPPKO) cells generated by CRISPR/Cas9. Lysates were stained with ClpP and GAPDH antibodies. MW markers are given on the right in kDa. WT and CLPPKO Huh-7 cells were infected at MOI 2 with F 229E, G OC43 or H SARS-CoV-2. After 1 hour adsorption, cells were treated with DMSO (blue), or 10 µM ADEP-42 (red). Media samples were harvested at 24, 72 or 48 hpi for (F), (G) and (H), respectively, and analyzed by RT-qPCR.
Fig. 7
Fig. 7. Generation and verification of the SARS-CoV-2 replicon.
A Schematic of the SARS-CoV-2 replicon. Viral genome expressed under tetracycline-inducible/CMV chimeric promoter with parts of E and S proteins deleted to attenuate virus infectivity. The replicon is stably integrated into HeLa cells through the Flp-In recombinase system. The main modifications introduced into the SARS-CoV-2 genome are highlighted. B HeLa-replicon or WT HeLa cells were exposed to doxycycline at 3 µg/mL for 24 hours, and luminescence was measured after lysis and supplementation with LgBiT and substrate furimazine. Mean ± SD are shown from 8 replicates, *p < 0.05. C Representative confocal images of the HaloTag stained with JFX650 dye and nucleus stained with NucSpot 470 in doxycycline-induced HeLa-replicon. Representative confocal images of doxycycline-induced HeLa-replicon showing expression of various markers. Left: confocal single plane images, right: 3-D rendering of z-stack. D mCerulean3 (∆Nsp2), E Nsp16-sfCherry211, F mNeonGreen211-M were co-stained with indicated nuclear dye, which is either NucSpot 470 or propidium iodide (PI). G Remdesivir inhibit doxycycline-induced HeLa-Replicon activation in a concentration-dependent manner. Replicon-containing cells were incubated with 3 µg/mL doxycycline as well as remdesivir at indicated concentrations for 24 hours before addition of LgBiT and furimazine (substrate) to quantify the generated luminescence (RLU refers to relative luminescence units). H Effects of compounds on doxycycline-induced HeLa-Replicon activation in a concentration-dependent manner. Replicon-containing cells were incubated with 3 µg/mL doxycycline as well as cordycepin, BTZ-1, and ADEP-42 at indicated concentrations for 24 hours before addition of LgBiT and furimazine (substrate) to quantify the generated luminescence (RLU refers to relative luminescence units). I Western blot analysis of AMPK, mTOR and Akt in HeLa-replicon cells treated with DMSO or cordycepin. Replicon cells were induced with 3 µg/mL doxycycline for 24 hours and treated with either DMSO or 30 µM cordycepin. Lysates were stained with AMPKα, phospho-AMPKα (Thr172), mTOR, phospho-mTOR (Ser2448), Akt, phospho-Akt (Ser473), and GAPDH antibodies. The numbers below the blots are quantified protein levels normalized against GAPDH and expressed relative to no doxycycline samples. MW markers are given on the right in kDa.

References

    1. World Health Organization. WHO Coronavirus (COVID-19) Dashboard. World Health Organization (2023).
    1. Li, M. et al. COVID-19 vaccine development: milestones, lessons and prospects. Signal Transduct. Target Ther.7, 146 (2022). - PMC - PubMed
    1. Sabbatucci, M. et al. Omicron variant evolution on vaccines and monoclonal antibodies. Inflammopharmacology31, 1779–1788 (2023). - PMC - PubMed
    1. Li, G., Hilgenfeld, R., Whitley, R. & De Clercq, E. Therapeutic strategies for COVID-19: progress and lessons learned. Nat. Rev. Drug Discov.22, 449–475 (2023). - PMC - PubMed
    1. Li, J. et al. SARS-CoV-2 omicron BA.1.1 is highly resistant to antibody neutralization of convalescent serum from the origin strain. Virus Res.332, 199131 (2023). - PMC - PubMed

LinkOut - more resources