. 2025 Feb;44(3):179-191.
doi: 10.1038/s41388-024-03210-1. Epub 2024 Nov 7.

Profiling the cancer-prone microenvironment in a zebrafish model for MPNST

Affiliations

Profiling the cancer-prone microenvironment in a zebrafish model for MPNST

Cheryl Cero et al. Oncogene. 2025 Feb.

Abstract

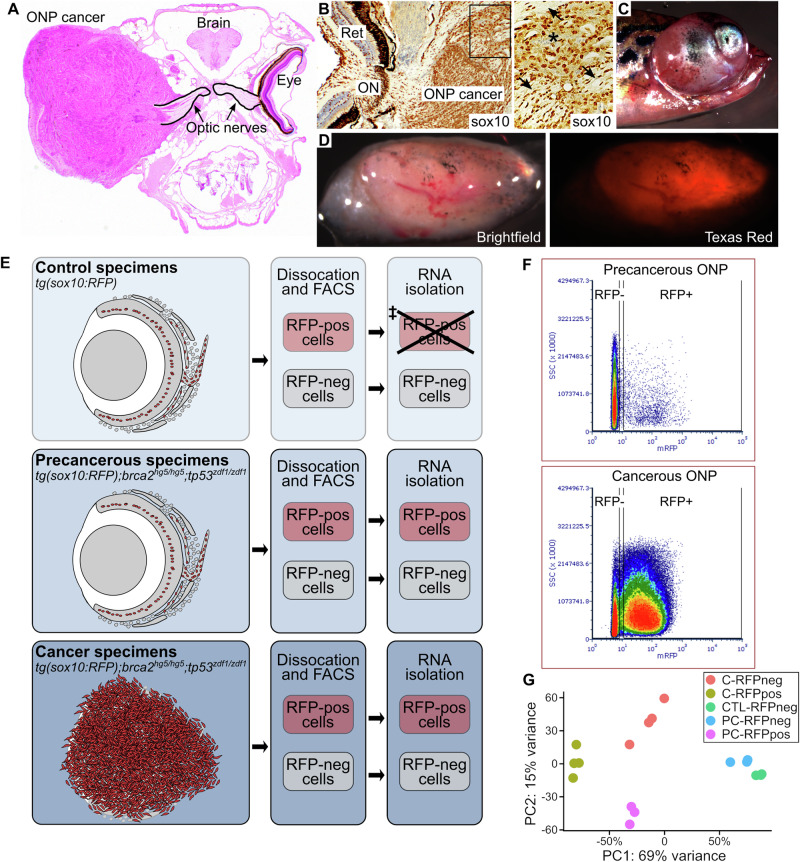
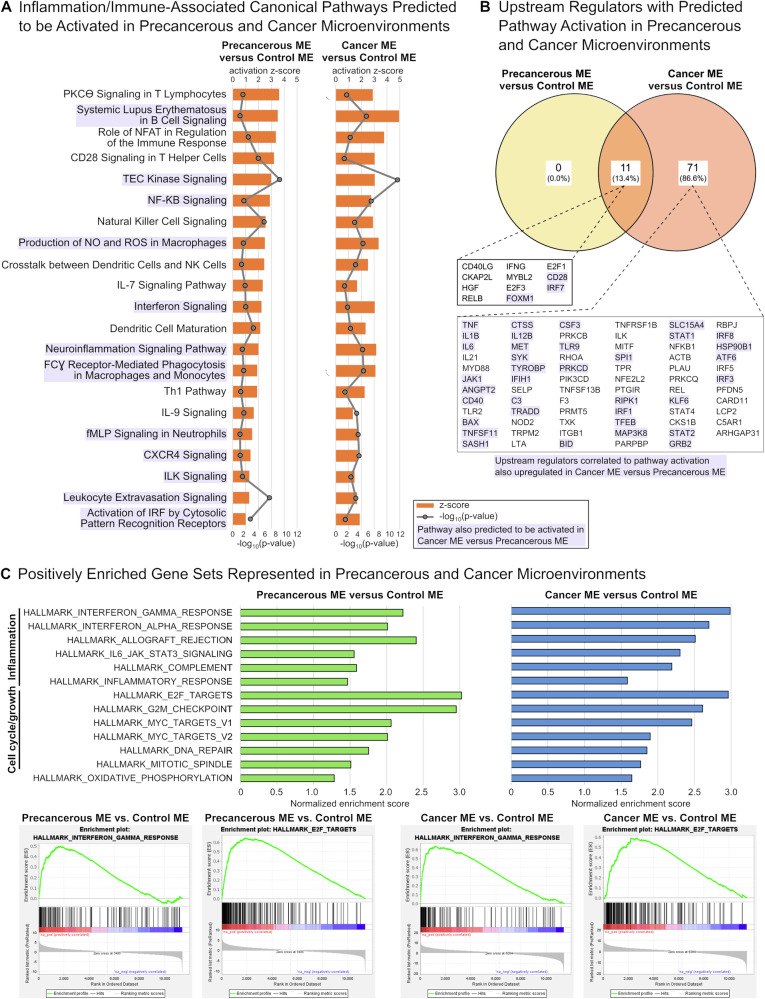
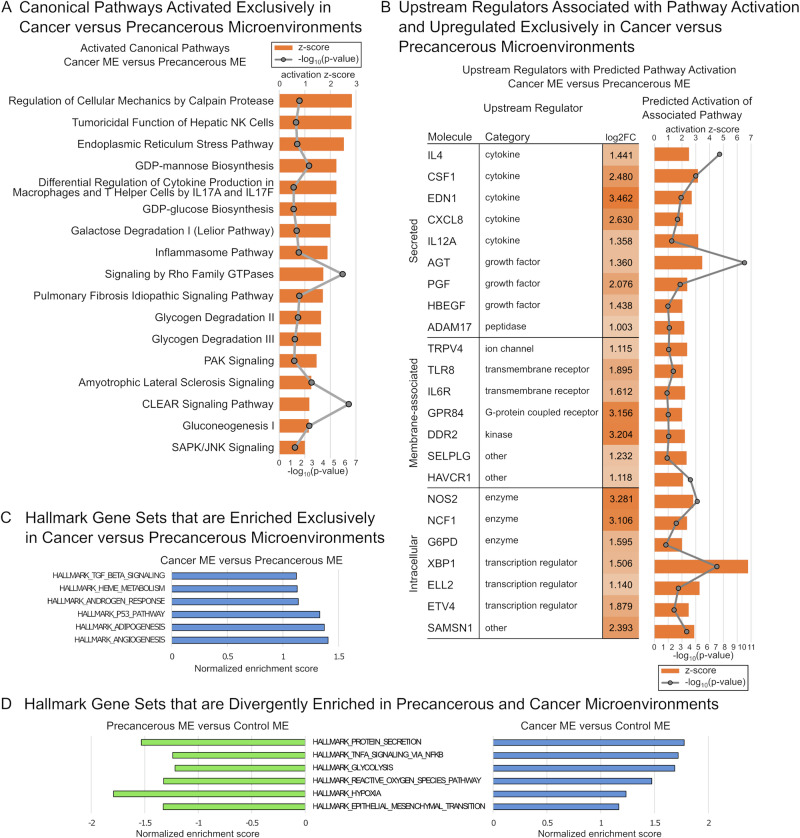
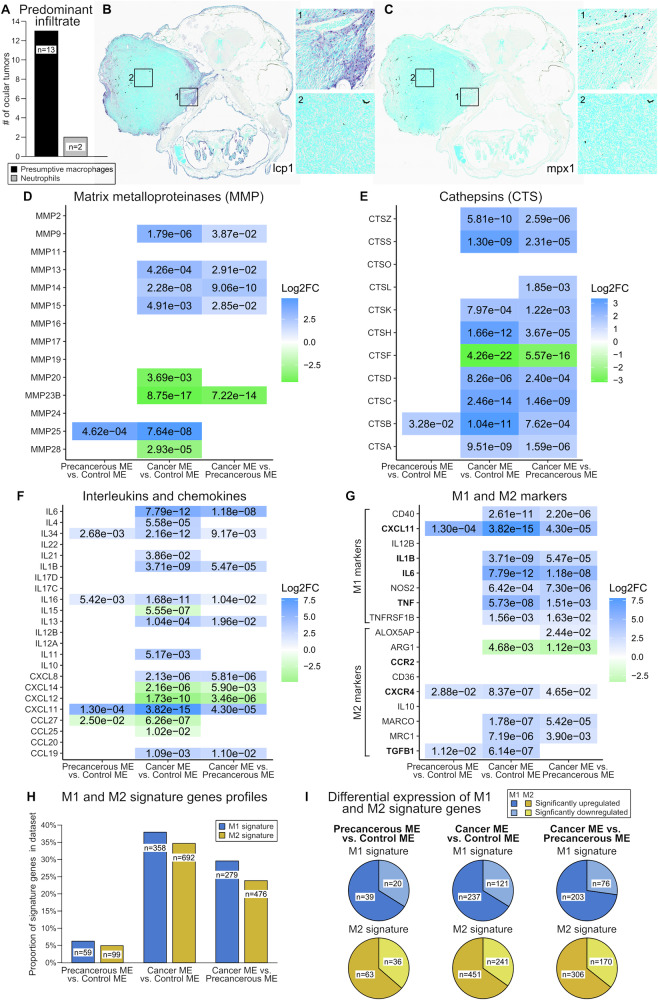
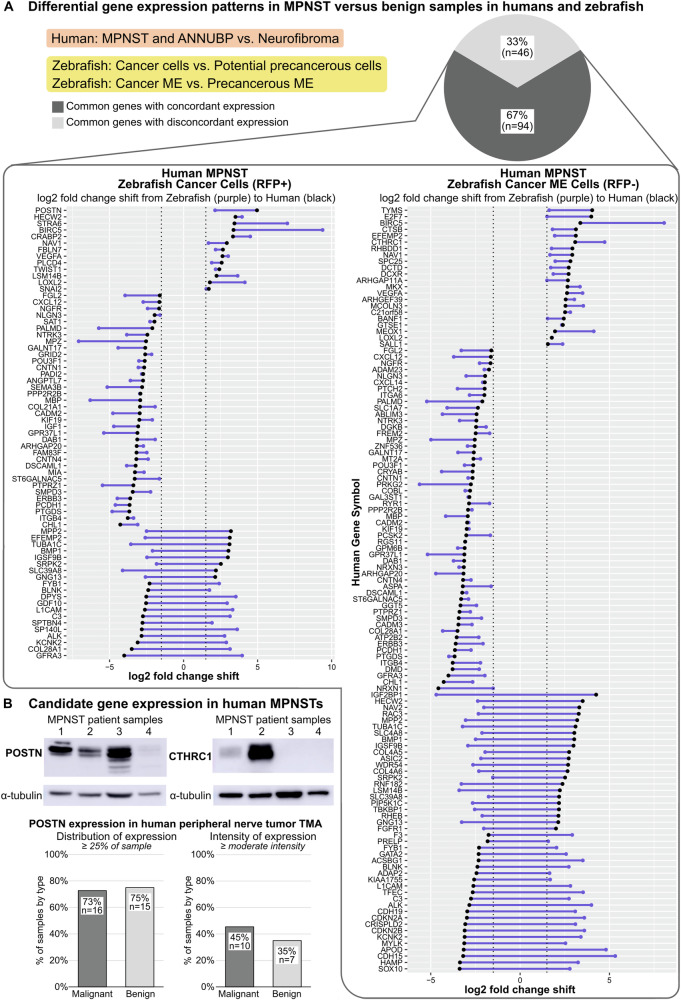
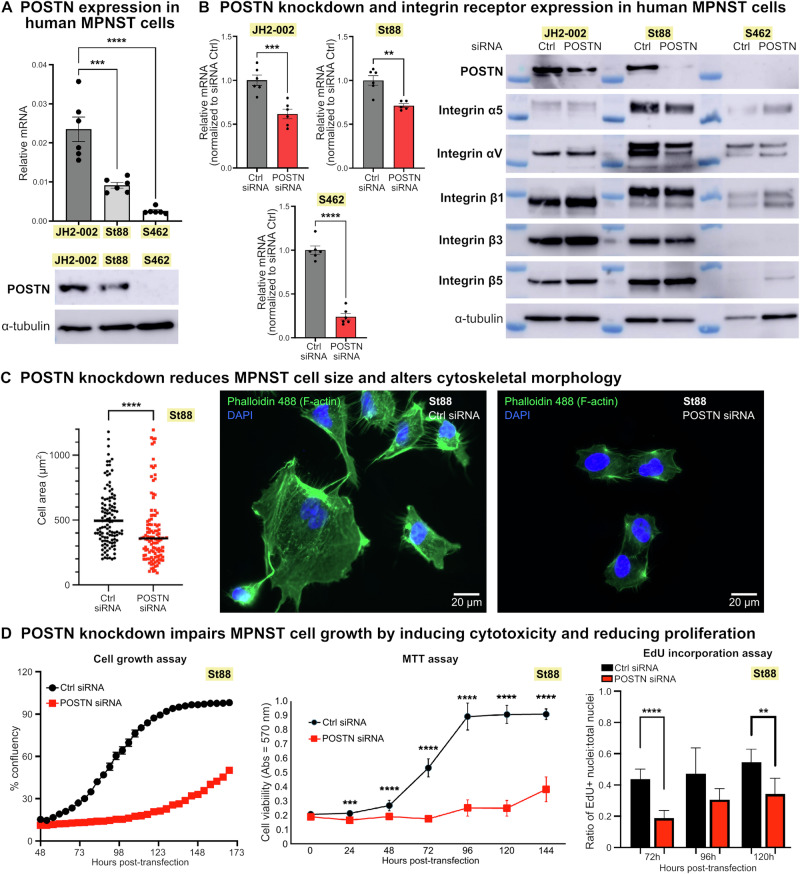
Microenvironmental contributions to soft tissue sarcoma progression are relatively undefined, particularly during sarcoma onset. Use of animal models to reveal these contributions is impeded by difficulties in discriminating between microenvironmental, precancerous, and cancer cells, and challenges in defining a precancerous microenvironment. We developed a zebrafish model that allows segregation of microenvironmental, precancerous, and cancerous cell populations by fluorescence-activated cell sorting. This model has high predilection for malignant peripheral nerve sheath tumor (MPNST), a type of soft tissue sarcoma that exhibits rapid, aggressive growth. Using RNA-seq, we profiled the transcriptomes of microenvironmental, precancerous, and cancer cells from our zebrafish MPNST model. We show broad activation of inflammation/immune-associated signaling networks, describe gene expression patterns that uniquely characterize the transition from precancerous to cancer ME, and identify macrophages as potential contributors to microenvironmental phenotypes. We identify conserved gene expression changes and candidate genes of interest by comparative genomics analysis of MPNST versus benign lesions in both humans and zebrafish. Finally, we functionally validate a candidate extracellular matrix protein, periostin (POSTN), in human MPNST. This work provides insight into how the microenvironment may regulate MPNST initiation and progression.


Conflict of interest statement

Competing interests: The authors declare no competing interests. Ethics approval and consent to Participate: All methods were performed in accordance with the relevant guidelines and regulations. All animal studies were approved by the Institutional Animal Care and Use Committee, North Carolina State University, Raleigh, NC (Animal Use Protocol 17-067-B) and by the Institutional Care and Use Committee, The Ohio State University, Columbus, OH (Animal Use Protocol 2019A00000097). Animal studies were performed in accordance with approved protocols and complied with ARRIVE guidelines. Human specimens used in this study were exempt from Institutional Review Board review and informed consent was not required.

Figures

Fig. 1
Fig. 1. Use of a tg(sox10:RFP);brca2hg5/hg5;tp53zdf1/zdf1 zebrafish model to isolate and analyze the cellular component of a cancer-prone microenvironment.
A The optic nerve pathway (ONP) is a cancer-prone site in brca2hg5/hg5;tp53zdf1/zdf1 zebrafish. B Zebrafish ONP cancers exhibit ubiquitous sox10 expression (brown chromogen). Asterisk, blood vessel containing sox10-negative erythrocytes; arrows, fragments of optic nerve. Ret, retina; ON, optic nerve. C, D Zebrafish carrying a sox10-RFP reporter construct (tg(sox10:RFP);brca2hg5/hg5;tp53zdf1/zdf1) develop RFP-expressing cancers. E Experimental design showing experimental cohorts and workflow for tissue collection and RNA isolation. RFP-positive cells are shown in red. Remaining areas shaded in gray are composed of RFP-negative cells. RNA was of insufficient quantity for RNAseq analysis. F RFP-positive and RFP-negative cell fractions were collected from isolated ONP tissues by fluorescence-activated cell sorting (FACS). FACS analysis of control (not shown) and precancerous ONP samples showed similar distributions of RFP-positive and RFP-negative cell populations. The full gating strategy, including the panels shown in (F), is in Fig. S1. G Principal component analysis of samples analyzed by RNA-seq.
Fig. 2
Fig. 2. Pathway and gene set enrichment analyses suggest activation of pro-inflammatory and pro-growth signaling in precancerous and cancer cellular microenvironments.
A Inflammation and immune-associated canonical pathways identified by Ingenuity Pathways Analysis (IPA) that were predicted to be activated for comparisons of precancerous versus control and cancer versus control microenvironments (MEs). Orange bars represent activation z-score with predicted pathway activation; grey lines represent −log10(enrichment p value); purple shading indicates pathways that were also predicted to be activated in the comparison of cancer versus precancerous microenvironments (Table S1). B Genetic upstream regulators associated with predicted pathway activation as identified by IPA that were significantly upregulated in each comparison. Purple shading indicates genetic upstream regulators associated with predicted pathway activation pathways that were also significantly upregulated in the comparison of cancer versus precancerous MEs (Table S2). C Gene set enrichment analysis (GSEA) identified 13 hallmark gene sets with positive normalized enrichment scores (NES) in both precancerous and cancer MEs versus the control ME. All 13 gene sets also had positive NES in the comparison of cancer versus precancerous MEs (Table S3). These commonly enriched hallmark gene sets were predominantly associated with inflammation or cell cycle/cell growth processes.
Fig. 3
Fig. 3. Pathway and gene set enrichment analyses identify gene expression changes that uniquely characterize the cancer versus precancerous microenvironment.
A Canonical pathways identified by Ingenuity Pathways Analysis (IPA) that were predicted to be activated exclusively in the comparison of cancer versus precancerous microenvironments (MEs). B Genetic upstream regulators associated with predicted pathway activation as identified by IPA that were significantly upregulated exclusively in the comparison of cancer versus precancerous MEs. C Gene set enrichment analysis (GSEA) identifies six hallmark gene sets with a positive normalized enrichment score (NES) exclusively in the comparison of cancer versus precancerous MEs. D GSEA identifies 6 hallmark gene sets with a negative NES in the comparison of precancerous versus control MEs, but a positive NES in the comparison of cancer versus control MEs.
Fig. 4
Fig. 4. Presumptive macrophages may contribute to precancerous and cancer microenvironmental phenotypes.
Human orthologues for zebrafish genes are shown. Gene expression data reflects comparisons of precancerous versus control, cancer versus control, and cancer versus precancerous cellular microenvironments (ME). Numerical values in panels DG show adjusted p-values for the comparisons and color shading indicates log2 fold change (FC) values. A Identification of predominant inflammatory cell type in zebrafish ONP cancers as defined by lcp1 expression (presumptive macrophages) and mpx1 expression (neutrophils). B Lcp1-expressing presumptive macrophages (purple chromogen) are abundant and predominantly localize to peripheral margins and invasive edges. C Mpx1-expressing neutrophils (purple chromogen) are present in low numbers. D Matrix metalloproteinase (MMP) gene expression profile. E Cathepsin (CTS) gene expression profile. F Interleukin and chemokine gene expression profile. G Expression of known markers for mammalian M1 and M2 phenotypes. Gene names in bold have been identified previously as M1 and M2 markers in zebrafish [34, 36]. H Proportions of differentially expressed M1 and M2 signature genes [37]. I Proportions of genes identified in panel (H) that were significantly up- or downregulated.
Fig. 5
Fig. 5. Comparative genomics analysis and candidate gene evaluation in human patient samples identifies potential contributors to MPNST progression.
A Comparison of gene expression profiles for malignant versus benign samples in humans (MPNST and ANNUBP versus neurofibroma) and zebrafish (cancer cells versus potential precancerous cells; cancer microenvironment (ME) versus precancerous ME). Dots represent log2 fold changes per gene for human (black dots) and zebrafish (purple dots) comparisons and connecting lines (purple) depict the relative shift in log2 fold change value. B Expression of candidate genes POSTN and CTHRC1 in human MPNST specimens detected by Western blotting and immunohistochemistry. ANNUBP, atypical neurofibromatosis neoplasm of unidentified biologic potential; TMA, tissue microarray.
Fig. 6
Fig. 6. Periostin (POSTN) knockdown profoundly impacts MPNST cell morphology and growth.
A The human MPNST cell lines JH2-002, St88, and S462 express POSTN, with variability in expression level between cell lines (see also Fig. S9A, S8A for POSTN expression in S462 cells). B siRNA-mediated knockdown of POSTN in MPNST cells reduces its expression at both mRNA and protein levels, while expression of integrin receptor subunits is largely unaffected (see also Fig. S9B, S8B for POSTN expression in S462 cells). C POSTN knockdown significantly reduces MPNST cell size, as quantified by cytoplasmic area, and drastically alters cytoskeletal architecture (n = 120 cells per condition, imaged after 48 h incubation with control (Ctrl) or POSTN siRNA). Data for St88 cells are shown. D POSTN knockdown impairs MPNST cell growth by significantly reducing both cell viability and proliferative capacity. Data for St88 cells are shown. Significance, *p ≤ 0.05, **p ≤ 0.005, ***p ≤ 0.0005, and ****p ≤ 0.0001. See Fig. S8A, S9A for experimental timeline.

References

    1. Zhang X, Xiang J. Remodeling the microenvironment before occurrence and metastasis of cancer. Int J Biol Sci. 2019;15:105–13. - PMC - PubMed
    1. Barcellos-Hoff MH, Lyden D, Wang TC. The evolution of the cancer niche during multistage carcinogenesis. Nat Rev Cancer. 2013;13:511–8. - PubMed
    1. White LA, Sexton JM, Shive HR. Histologic and immunohistochemical analyses of soft tissue sarcomas from brca2-Mutant/ tp53-mutant Zebrafish are consistent with neural crest (Schwann cell) origin. Vet Pathol. 2017;54:320–7. - PubMed
    1. Cai Z, Tang X, Liang H, Yang R, Yan T, Guo W. Prognosis and risk factors for malignant peripheral nerve sheath tumor: a systematic review and meta-analysis. World J Surg Oncol. 2020;18:257. - PMC - PubMed
    1. Martin E, Lamba N, Flucke UE, Verhoef C, Coert JH, Versleijen-Jonkers YMH, et al. Non-cytotoxic systemic treatment in malignant peripheral nerve sheath tumors (MPNST): a systematic review from bench to bedside. Crit Rev Oncol Hematol. 2019;138:223–32. - PubMed

Substances

LinkOut - more resources