. 2024 Dec;25(12):5780-5809.
doi: 10.1038/s44319-024-00304-5. Epub 2024 Nov 7.

PTGS is dispensable for the initiation of epigenetic silencing of an active transposon in Arabidopsis

Affiliations

PTGS is dispensable for the initiation of epigenetic silencing of an active transposon in Arabidopsis

Marieke Trasser et al. EMBO Rep. 2024 Dec.

Abstract

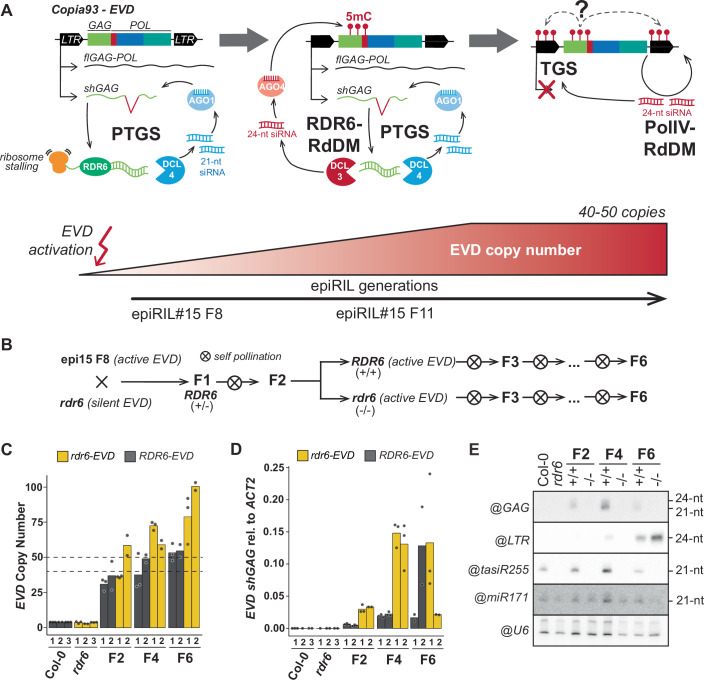
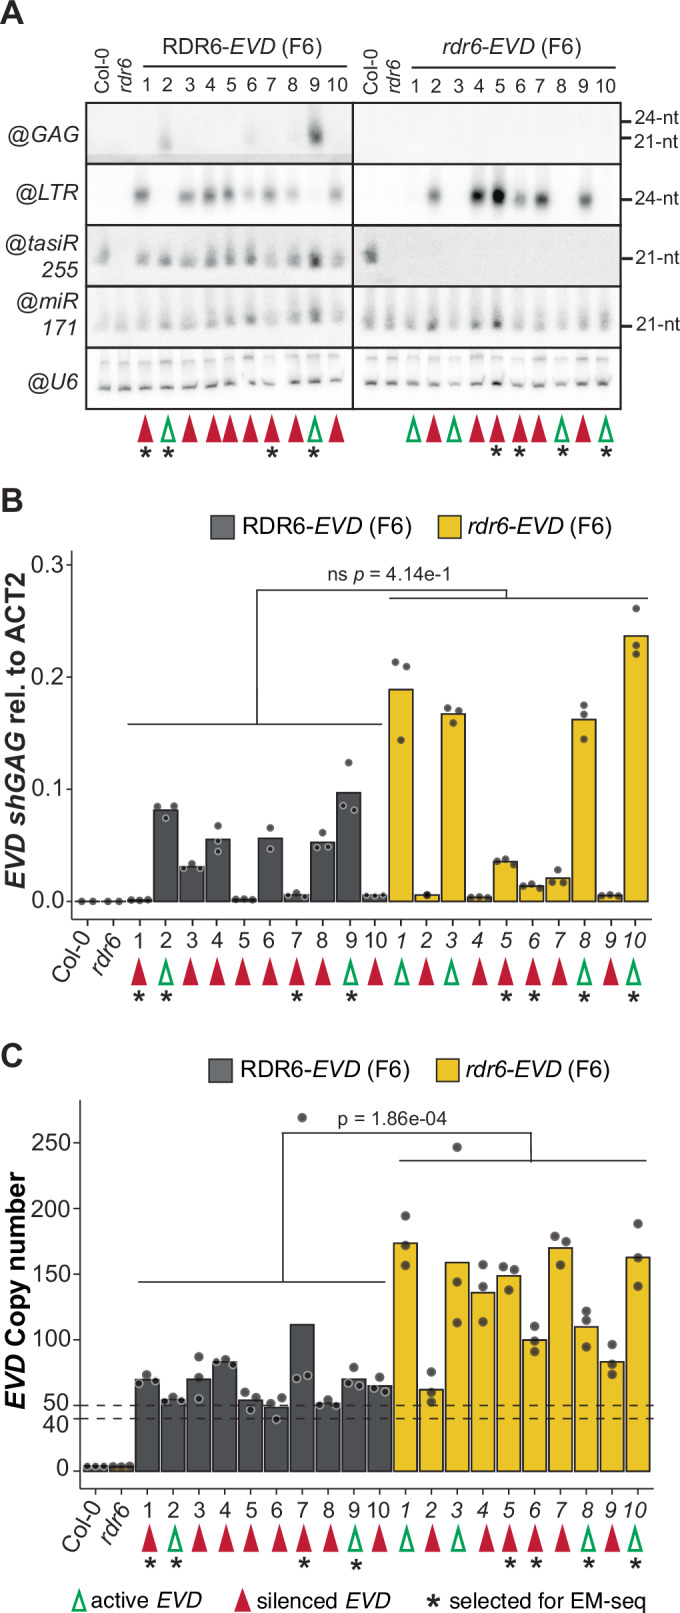
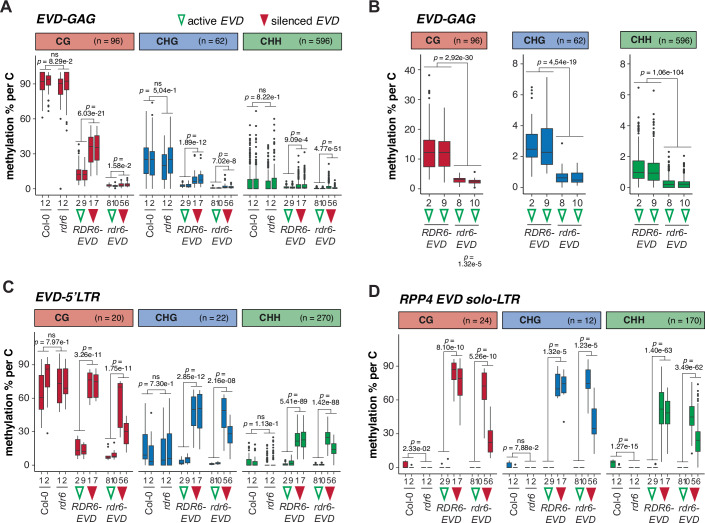
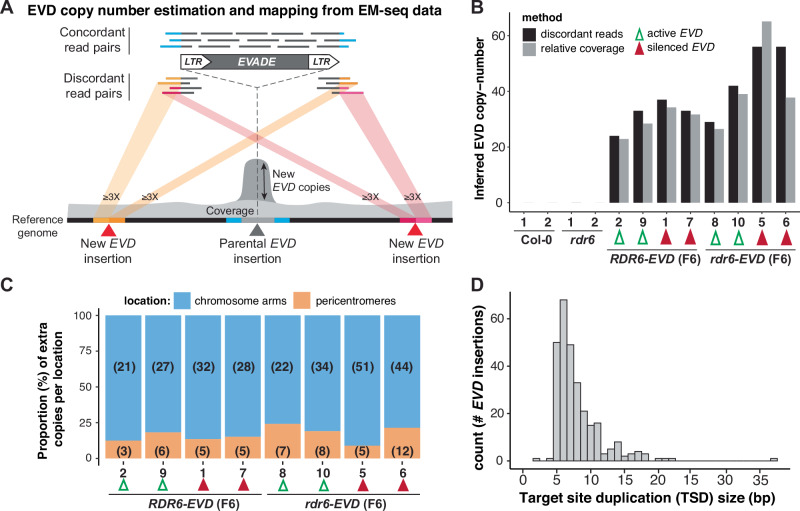
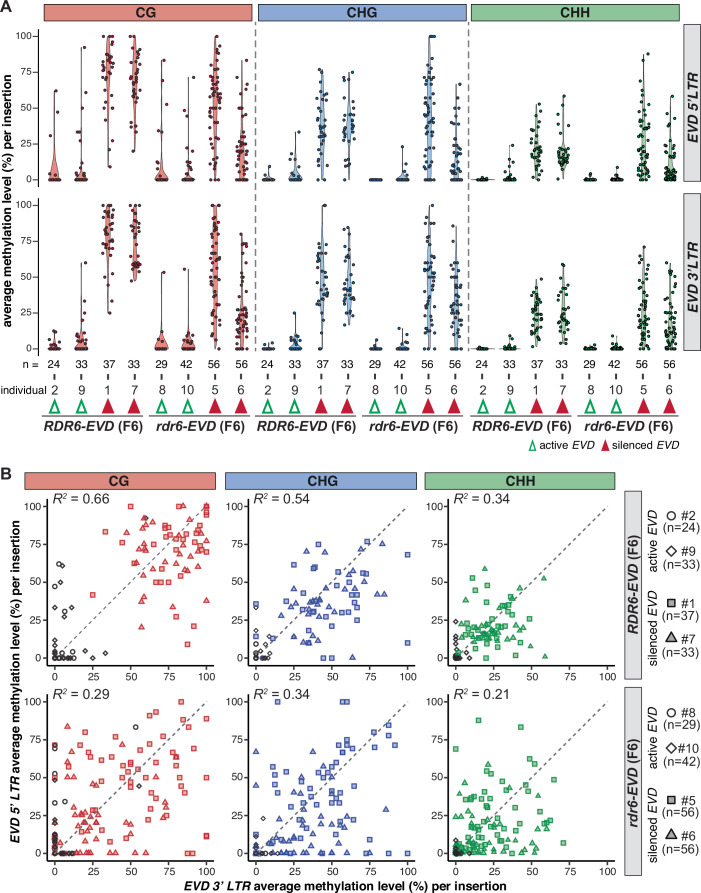
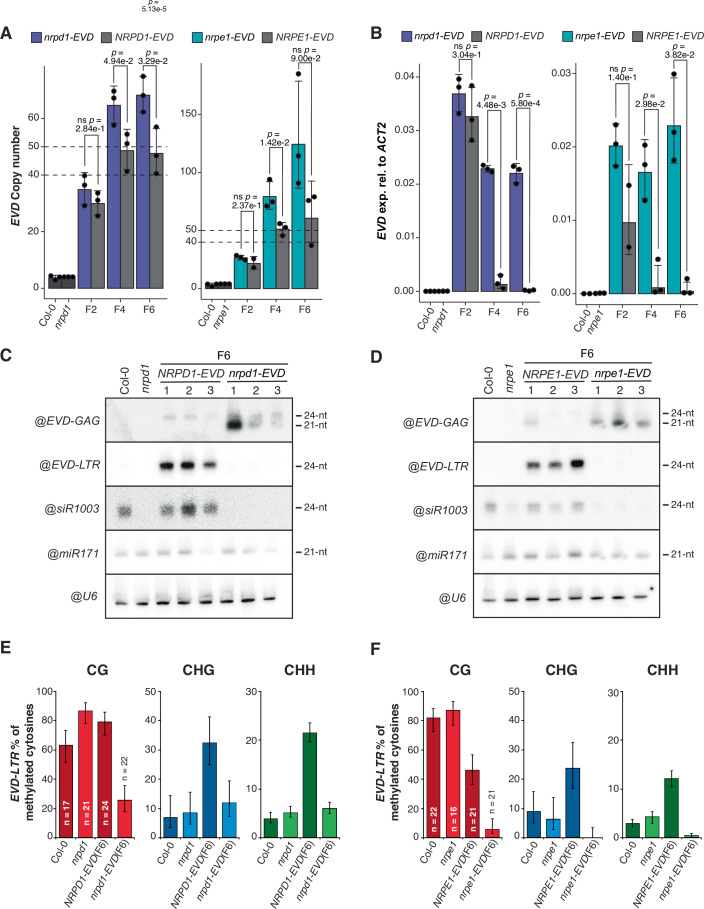
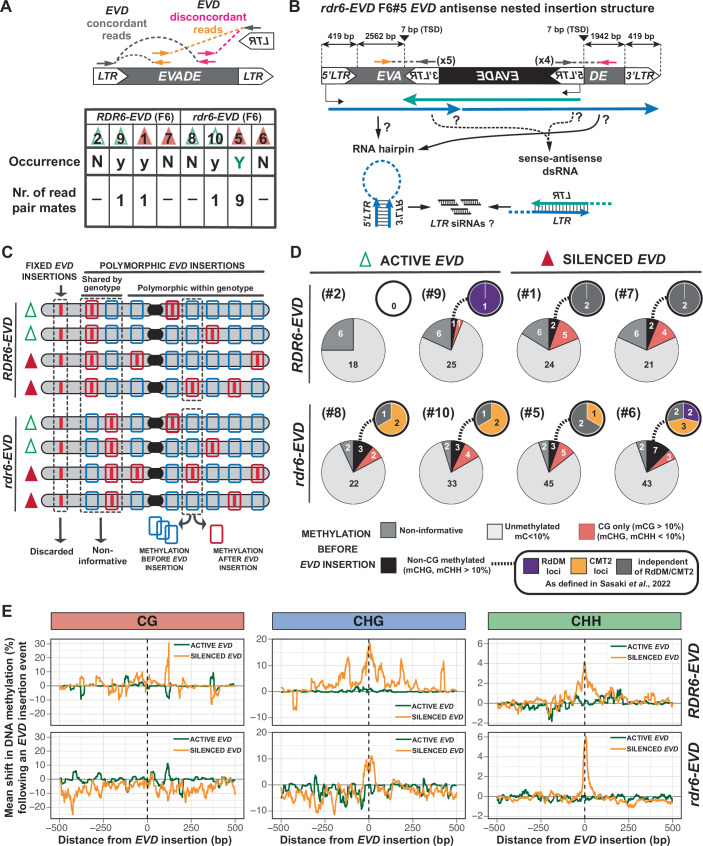
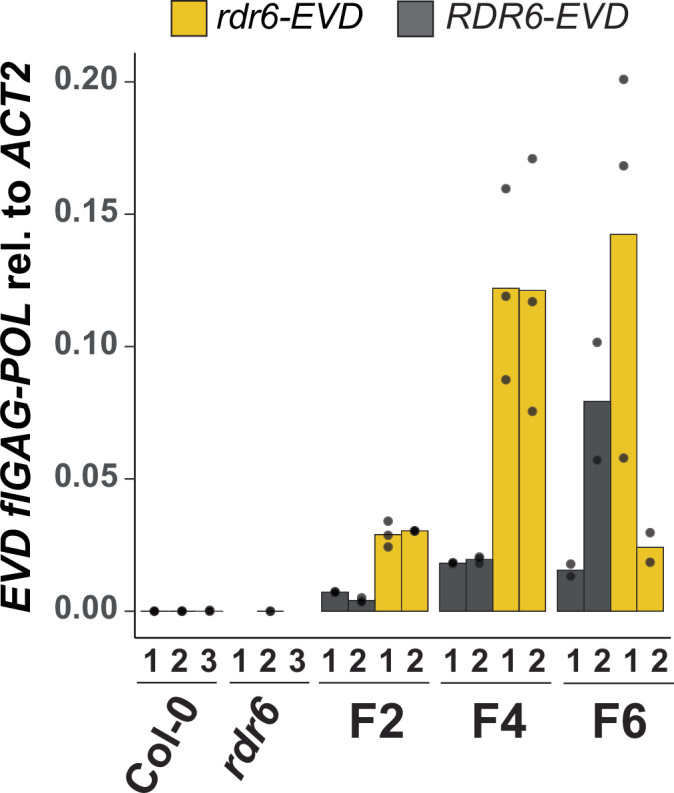
Transposable elements (TEs) are repressed in plants through transcriptional gene silencing (TGS), maintained epigenetic silencing marks such as DNA methylation. However, the mechanisms by which silencing is first installed remain poorly understood in plants. Small interfering (si)RNAs and post-transcriptional gene silencing (PTGS) are believed to mediate the initiation of TGS by guiding the first deposition of DNA methylation. To determine how this silencing installation works, we took advantage of ÉVADÉ (EVD), an endogenous retroelement in Arabidopsis, able to recapitulate true de novo silencing with a sequence of PTGS followed by a TGS. To test whether PTGS is required for TGS, we introduce active EVD into RNA-DEPENDENT-RNA-POLYMERASE-6 (RDR6) mutants, an essential PTGS component. EVD activity and silencing are monitored across several generations. In the absence of PTGS, silencing of EVD is still achieved through installation of RNA-directed DNA methylation (RdDM). Our study shows that PTGS is dispensable for de novo EVD silencing. Although we cannot rule out that PTGS might facilitate TGS, or control TE activity, initiation of epigenetic silencing can take place in its absence.

Keywords: Epigenetics; Plants; Silencing; Transposons; siRNAs.


Conflict of interest statement

Disclosure and competing interests statement. The authors declare no competing interests.

Figures

Figure 1
Figure 1. Introgression and characterization of EVD in the rdr6 mutant background.
(A) Schematic representation of the three EVD silencing steps. Upon EVD reactivation, ribosome stalling during translation of EVD shGAG transcript triggers PTGS. 21-nt siRNA produced through RDR6 and DCL4 and loaded into AGO1. With increasing EVD copies across generations, the excess of dsRNA produced by RDR6 is processed by DCL3 to generate 24-nt siRNAs. Loaded into AGO4, shGAG siRNAs trigger DNA methylation (5mC) through RDR6-RdDM at GAG coding sequences without silencing. At 40–50 copies per genome, TGS is installed through Pol IV-RdDM, coincidentally with the appearance of DNA methylation and 24-nt siRNAs on the LTR sequences. (B) Crossing scheme to generate rdr6 mutant lines with active EVD. F2 plants were genotyped to select homozygous WT and mutant RDR6 lines, propagated through selfing until the F6 generation. (C) EVD copy number analysis by qPCR in RDR6-EVD and rdr6-EVD lines at generations F2, F4, and F6 derived from two independent F1s (biological replicates), using the EVD-GAG sequence as target. (D) qPCR analysis of shGAG expression normalized to ACT2 in EVD-RDR6 and EVD-rdr6 lines at generations 2, 4, and 6 derived from two independent F1s (biological replicates). In (C) and (D), each biological replicate, consistent of bulks of 8–10 plants, are represented for each genotype at each generation, dots show technical replicates. (E) RNA blot analysis of EVD siRNAs against GAG and LTR in RDR6 and rdr6 lines with active EVD at generations F2, F4, and F6. tasiR255 probe is used as control for RDR6 mutation, miR171 and snoRNA U6 are shown as loading controls. WT Col-0 and rdr6 with no reactivated EVD are shown as negative control for EVD activity. Source data are available online for this figure.
Figure 2
Figure 2. Characterization of EVD silencing status in RDR6- and rdr6-EVD F6 individuals.
(A) RNA blot analysis of EVD siRNAs against GAG and LTR in 10 F6 individual plants of RDR6-EVD and rdr6-EVD lines. tasiR255 probe is used as control for RDR6 mutation, miR171 and snoRNA U6 are shown as loading controls. WT Col-0 and rdr6 with no reactivated EVD are shown as negative control for EVD activity. (B) Analysis of EVD shGAG expression of the same individuals investigated in A by qPCR, normalized to ACT2. (C) EVD copy number analysis by qPCR of the same individuals investigated in (A) and (B), using the EVD-GAG sequence as target. In (B) and (C), qPCR technical replicates for each sample are represented by dots. p-values for two-sided t-test between indicated samples are shown. Differences are considered statistically significant if p < 0.05 (5.00e−2) or non-significant (ns) if p ≥ 0.05. Green and red arrows indicate individuals with active and silenced EVD copies, respectively, selected individuals for subsequent EM-sequencing are indicated by an asterisk in (AC). Source data are available online for this figure.
Figure 3
Figure 3. DNA methylation of active and silenced EVD in RDR6- and rdr6-EVD lines.
EM-seq analysis of DNA methylation (as methylation % per cytosine) in CG, CHG, and CHH contexts in WT Col-0, rdr6 and in RDR6- and rdr6-EVD F6 individuals with active and silenced EVD (marked with empty green and filled red arrowheads, respectively, numbers indicate same individuals as in Fig. 2) in: (A) EVD-GAG; (B) EVD-GAG but only in RDR6- and rdr6-EVD F6 individuals with active EVD; (C) EVD-5LTR; and (D) EVD solo-LTR in RPP4 (AT4G16869) promoter. In all panels, n indicates the number of cytosines analyzed for each context per sample. In all boxplots: median is indicated by a solid bar, the boxes extend from the first to the third quartile and whiskers reach to the furthest values within 1.5 times the interquartile range. Dots indicate outliers, as data points outside of the above range. Wilcoxon rank sum test adjusted p-values between indicated groups of samples are shown. Differences are considered statistically significant if p < 0.05 (5.00e−2) or non-significant (ns) if p ≥ 0.05. Source data are available online for this figure.
Figure 4
Figure 4. Quantification of new EVD insertions in RDR6- and rdr6-EVD lines from EM-seq data.
(A) Schematic representation of the strategy used to quantify and map new EVD insertions from EM-seq data. EVD copy number was estimated using: (i) the increased EVD coverage of concordant paired read mates in EM-seq data, consequence of EVD transposition or, (ii) mapping new EVD insertions through discordant read pairs mapping to EVD and elsewhere in the genome. New insertions had to be supported by at least three discordant read pairs from each border to be considered. (B) Inferred EVD copy number using either relative coverage or discordant reads in WT Col-0, rdr6 and in RDR6- and rdr6-EVD F6 individuals with active and silenced EVD (marked with empty green and filled red arrowheads, respectively, numbers indicate same individuals as in Figs. 2 and 3). (C) Number and relative proportion (in %) of mapped new EVD insertions in pericentromeric or chromosomic arm locations in each indicated sample. Numbers of new EVD insertions at each location are indicated in brackets. (D) Histogram of the size (in bp) distribution of target site duplications at all new EVD insertions. Source data are available online for this figure.
Figure 5
Figure 5. LTR DNA methylation of individual new EVD insertions in RDR6- and rdr6-EVD lines.
(A) 5′ and 3LTR average DNA methylation levels in each cytosine context for individual new EVD insertions in RDR6- and rdr6-EVD F6 individuals with active and silenced EVD. (B) Correlation between 5′ and 3LTR average DNA methylation levels in each cytosine context for individual EVD insertions in RDR6- and rdr6-EVD F6 individuals. R2 indicates correlation coefficient between 5′ and 3′ LTR methylation levels within individual EVD insertions. Dashed line shows R2 = 1. Empty black symbols indicate EVD copies from individuals with active EVD and color-filled symbols from individuals with silenced EVD. In all panels, number of EVD insertions analyzed per individual correspond to those indicated in Fig. 4C. In all panels, n indicates the number of EVD insertions analyzed per sample. Source data are available online for this figure.
Figure 6
Figure 6. Characterization of EVD proliferation and silencing in RdDM mutants.
(A) EVD copy number analysis by qPCR in NRPD1-EVD and NRPE1-EVD lines, in both WT (gray) and mutant (colored) backgrounds, at generations F2, F4, and F6 derived from three independent F1s (biological replicates), using the EVD-GAG sequence as target. (B) qPCR analysis of shGAG expression normalized to ACT2 in NRPD1-EVD and NRPE1-EVD lines, in both WT (gray) and mutant (colored) backgrounds, at generations F2, F4, and F6 derived from three independent F1s (biological replicates). In (A) and (B), biological replicates (bulks of 8–10 plants each) are individually represented by dots. Error bars show standard error of the mean in (A) and (B). p-values for two-sided t-test between indicated samples are shown. Differences are considered statistically significant if p < 0.05 (5.00e−2) or non-significant (ns) if p ≥ 0.05. (C, D) RNA blot analysis of EVD siRNAs against GAG and LTR in the F6 generation of 3 independent WT and mutant lines of NRPD1-EVD (C) and NRPE1-EVD (D). WT Col-0 and nrpd1 or nrpe1 with no reactivated EVD are shown as negative control for EVD activity. siR1003 probe is used as control for NRPD1 and NRPE1 mutations, miR171 and snoRNA U6 are shown as loading controls. (E, F) % methylated cytosines (C) by bisulfite-PCR DNA methylation analysis at EVD-LTR sequences in the F6 generation of NRPD1-EVD (E) and NRPE1-EVD (F) lines, in both WT (darker shade) and mutant (lighter shade) backgrounds. Col-0, nrp1d and nrpe1 were used as controls. n: number of clones analyzed. Error bars represent 95% confidence Wilson score intervals of the % of methylated cytosines (C) in each context (CG, CHG, CHH). Source data are available online for this figure.
Figure 7
Figure 7. Genetic and epigenetic characterization of EVD insertion sites.
(A) Schematic representation of the strategy used to identify EVD antisense nested insertions within itself from EM-seq discordant paired read mates mapping to EVD-LTR and elsewhere on EVD coding sequence in antisense to the LTR. The table indicates the occurrence and number of read mates found in each sample. Arbitrary threshold of at least two paired read mates by LTR was set to confidentially identify an EVD nested insertion. N: non-occurrence, y: presence of at least one discordant paired read mate, Y: presence of discordant paired read mates and above threshold for confident presence of nested insertion. (B) Scheme of EVD antisense nested insertion structure based on EVD discordant reads in the sample rdr6-EVD F6 #5. Distance between LTRs as well as the length of the target-site duplication (TSD) caused by the insertion are indicated in base-pairs (bp). Colored arrows represent potential EVD transcripts within the locus. Putative sources of small RNAs are depicted below. (C) Schematic representation of methodology used to infer the methylation status of EVD landing sites prior to transposition using the EM-seq data. EVD insertions are represented by red lines. Red boxes indicate regions with new and polymorphic EVD insertions. Blue boxes represent the same region without the EVD insertion. (D) Pie charts of the distribution of insertions within non-methylated, CG-only methylated and non-CG methylated regions within each sample. Inlets represent the classification of non-CG methylated regions into RdDM-, CMT2-dependent or independent of both. Number of insertions in each category is indicated within the chart. (E) Metaplot of the mean shift in DNA methylation following a EVD insertion by genotype and methylation context depending on EVD silencing status. Source data are available online for this figure.
Figure EV1
Figure EV1. EVD GAG-POL expression in RDR6 wild-type and mutant backgrounds.
(A) qPCR analysis of flGAG-POL expression normalized to ACT2 in EVD-RDR6 and EVD-rdr6 lines at generations 2, 4, and 6 derived from two independent F1s (biological replicates). Each biological replicate, consistent of bulks of 8–10 plants, are represented for each genotype at each generation, dots show technical replicates. Source data are available online for this figure.
Figure EV2
Figure EV2. EM-seq libraries general stats and EVD POL and 3LTR methylation in RDR6- and rdr6-EVD lines.
(A) Cytosine-to-thymine conversion rates of the unmethylated chloroplastic DNA for each EM-seq library (see materials and methods for further information). (B) Number of paired-end fragments obtained in each EM-seq library. (C) Arabidopsis genome coverage in each EM-seq library. (DF) EM-seq analysis of DNA methylation (as % per of methylated cytosines) in CG, CHG, and CHH contexts in WT Col-0, rdr6 and in RDR6- and rdr6-EVD F6 individuals with active and silenced EVD (marked with empty green and filled red arrowheads, respectively, numbers indicate same individuals as in Fig. 2) in: (D) EVD-Protease; (E) EVD-Integrase, and (F) EVD-5LTR. In panels (DF), n indicates the number of cytosines analyzed for each context per sample. In all boxplots: median is indicated by a solid bar, the boxes extend from the first to the third quartile and whiskers reach to the furthest values within 1.5 times the interquartile range. Dots indicate outliers, as data points outside of the above range. Wilcoxon rank sum test adjusted p-values between indicated groups of samples are shown. Differences are considered statistically significant if p < 0.05 (5.00e−2) or non-significant (ns) if p ≥ 0.05. Source data are available online for this figure.
Figure EV3
Figure EV3. Mapping of new EVD insertions in RDR6- and rdr6-EVD lines from EM-seq data.
(A) Schematic representation of the strategy used to map new EVD insertions using discordant read mates from EM-seq. (B) Number of fragments from concordant (properly paired) and discordant read mates mapping to EVD in each of the EM-seq libraries. (C) Genomic location of new EVD insertions mapped through discordant read pair mates in EM-seq data in the Arabidopsis genome. Parental EVD (AT5G17125) location is indicated with a red line. New EVD insertions are marked with black lines. Pericentromeric regions in each of Arabidopsis five chromosomes are marked in gray. See table provided in corresponding source data for precise chromosome coordinates of each new insertion. Source data are available online for this figure.
Figure EV4
Figure EV4. BS-PCR analysis of EVD-GAG DNA methylation levels in RdDM mutants.
(A) Crossing scheme to generate nrpd1- and nrpe1-EVD lines. F2 plants were genotyped to select homozygous WT and mutant lines for each background and propagated through selfing until the F6 generation. (B, C) % methylated cytosines by bisulfite -PCR DNA methylation analysis at EVD-GAG sequences in the F6 generation of NRPD1-EVD (B) and NRPE1-EVD (C) lines, in both WT (darker shade) and mutant (lighter shade) backgrounds. Col-0, nrpd1 and nrpe1 were used as controls. Error bars represent 95% confidence Wilson score intervals of the % of methylated cytosines (C) in each context (CG, CHG, CHH). (D, E) Dot-plot representation of bisulfite-PCR sequencing data for the F6 generation of NRPD1-EVD (D) and NRPE1-EVD (E) lines, in both WT and mutant backgrounds, at EVD-GAG sequences. Col-0 and nrpd1 or nrpe1 were used as control for the endogenous parental EVD copies. (F, G) Dot-plot representation of bisulfite-PCR sequencing data for the F6 generation of NRPD1-EVD (F) and NRPE1-EVD (G) lines, in both WT and mutant backgrounds, at EVD-LTR sequences. Col-0 and nrpd1 or nrpe1 were used as control for the endogenous parental EVD copies. In all dot-plots, filled circle represent methylated, empty circles unmethylated cytosines in the CG (red), CHG (blue), and CHH (green) context. Source data are available online for this figure.
Figure EV5
Figure EV5. Summary table for the search of close proximity sense-antisense EVD-LTR events.
Putative origin of LTR hairpins as consequence of EVD transposition in tandem or nested configurations next to the scheme of the strategy used to find them using discordant read mates from EM-seq where both read mates map to EVD-LTR. The table indicates the occurrence and number of read mates found in each sample. Arbitrary threshold of at least three paired read mates was set to confidentially identify two LTRs in close proximity. N: non-occurrence, y: presence of at least one discordant paired read mate, Y: presence of discordant paired read mates and above threshold for confident calling.

References

    1. Al-Kaff NS, Covey SN, Kreike MM, Page AM, Pinder R, Dale PJ (1998) Transcriptional and posttranscriptional plant gene silencing in response to a pathogen. Science 279:2113–2115 - PubMed
    1. Allshire RC, Madhani HD (2018) Ten principles of heterochromatin formation and function. Nat Rev Mol Cell Biol 19:229–244 - PMC - PubMed
    1. Alonso JM, Stepanova AN, Leisse TJ, Kim CJ, Chen H, Shinn P, Stevenson DK, Zimmerman J, Barajas P, Cheuk R et al (2003) Genome-wide insertional mutagenesis of Arabidopsis thaliana. Science 301:653–657 - PubMed
    1. Baduel P, Leduque B, Ignace A, Gy I, Gil J, Loudet O, Colot V, Quadrana L (2021) Genetic and environmental modulation of transposition shapes the evolutionary potential of Arabidopsis thaliana. Genome Biol 22:138 - PMC - PubMed
    1. Baduel P, Quadrana L, Colot V (2021) Plant transposable elements, methods and protocols. Methods Mol Biol 2250:157–169 - PubMed

MeSH terms

LinkOut - more resources