. 2025 Feb;31(2):599-608.
doi: 10.1038/s41591-024-03302-1. Epub 2024 Nov 7.

Collaboration between clinicians and vision-language models in radiology report generation

Affiliations

Collaboration between clinicians and vision-language models in radiology report generation

Ryutaro Tanno et al. Nat Med. 2025 Feb.

Abstract

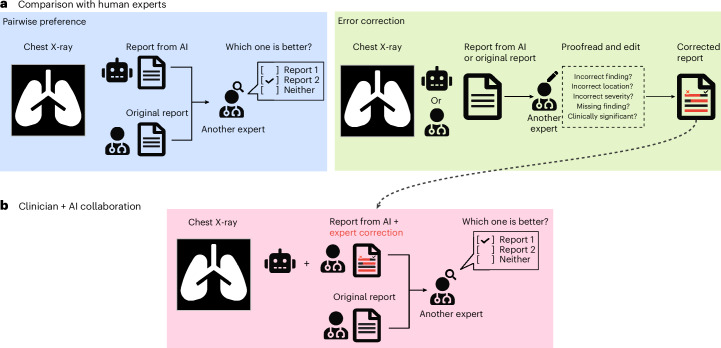
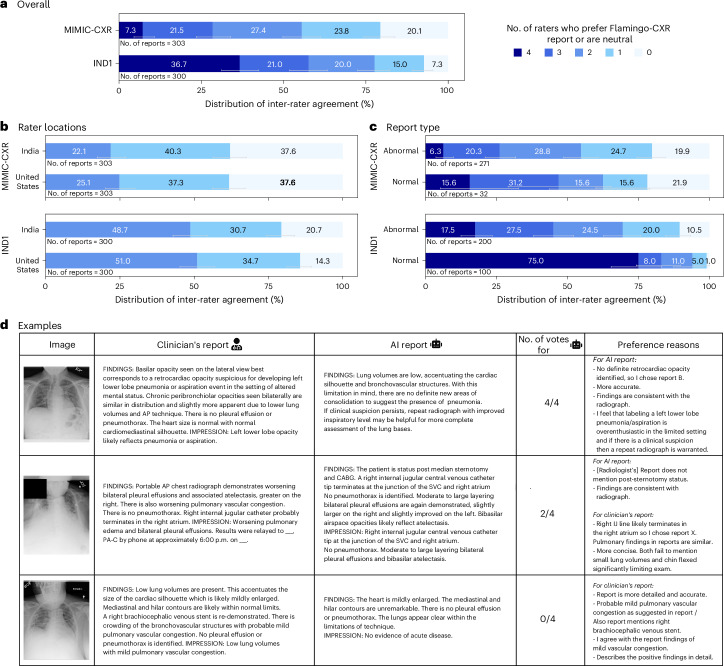
Automated radiology report generation has the potential to improve patient care and reduce the workload of radiologists. However, the path toward real-world adoption has been stymied by the challenge of evaluating the clinical quality of artificial intelligence (AI)-generated reports. We build a state-of-the-art report generation system for chest radiographs, called Flamingo-CXR, and perform an expert evaluation of AI-generated reports by engaging a panel of board-certified radiologists. We observe a wide distribution of preferences across the panel and across clinical settings, with 56.1% of Flamingo-CXR intensive care reports evaluated to be preferable or equivalent to clinician reports, by half or more of the panel, rising to 77.7% for in/outpatient X-rays overall and to 94% for the subset of cases with no pertinent abnormal findings. Errors were observed in human-written reports and Flamingo-CXR reports, with 24.8% of in/outpatient cases containing clinically significant errors in both report types, 22.8% in Flamingo-CXR reports only and 14.0% in human reports only. For reports that contain errors we develop an assistive setting, a demonstration of clinician-AI collaboration for radiology report composition, indicating new possibilities for potential clinical utility.


Conflict of interest statement

Competing interests: This study was funded by Google LLC and/or a subsidiary thereof (‘Google’). R.T., D.G.T.B., A.Sellergren., S.G., S.D., A.See., J.W., C.L., T.T., S.A., M.S., R.M., R.L., S.Man., Z.A., S.Mahdavi., Y.M., J.B., S.M.A.E., Y.L., S.S., V.N., P.K., P.S.-H., A.K. and I.K. are employees of Google and may own stock as part of the standard compensation package. D.B. was a Google employee and is currently an employee of GlaxoSmithKlein AI division and may own stock as part of the standard compensation package. Similarly, K.S. was a Google employee and may own stock, but is currently an employee of OpenAI.

Figures

Fig. 1
Fig. 1. Schematic overview of our human evaluation framework.
a, To compare radiology reports generated by our AI model with reports written by human experts, we devise two evaluation schemes: (1) a pairwise preference test in which a certified expert is given two reports without knowing the source of the report (one report from our model and the original report from a radiologist) and they are asked to choose which report should be ‘used downstream for the care of this patient’; and (2) an error correction task in which a single report (either AI-generated or the original one) is evaluated carefully and edited if required. The expert is also asked to give the reason for each correction and to indicate whether the error is clinically significant or not. b, We measure the utility of the AI-based report generation system in an assistive scenario in which the AI model first generates a report and the human expert revises as needed. For this task, we repeat the same pairwise preference test as before but this time the expert is asked to compare an AI-generated report corrected with human edits against a report written by human alone. We perform this evaluation on two datasets, one acquired in outpatient care delivery in India and another from intensive care in the United States. Board-certified radiologists are recruited in both countries to study the regional inter-rater variation.
Fig. 2
Fig. 2. Comparison of detection accuracy with expert labels on the IND1 dataset.
a, The ROC curve of the Flamingo-CXR report generation model with stochastic generation method (Nucleus) and corresponding area under the curve (AUC), shown along with the sensitivity and 1 − specificity pairs for two certified radiologists. The operating point of our model with the default deterministic inference scheme (Beam 3) is also shown. Details of the two inference algorithms are available in the Methods. The curve and the metrics are microaveraged across six conditions (cardiomegaly, pleural effusion, lung opacity, edema, enlarged cardiomediastinum and fracture) for which the labels were collected (n = 7,995 is the total number of IND1 test set reports). The GT labels are defined as the majority vote among the 5 labels obtained from the pool of 18 certified radiologists. Error bars represent 95% confidence intervals (calculated using bootstrapping with 1,000 repetitions). b, Kendall’s tau coefficients with respect to the expert labels are shown for the two held-out radiologists as well as for two inference schemes of our Flamingo-CXR model. We use the ‘soft’ labels derived by averaging over the available annotations instead of the majority vote labels as the target for computing the metric. On the vertical axis, the prevalence rates (PRs) of the respective conditions in the training set and their sample size in the test set are also shown. The target labels are the probabilities over the presence of the respective conditions calculated by averaging the binary condition labels from the expert pool.
Fig. 3
Fig. 3. Results of pairwise preference test for MIMIC-CXR and IND1.
a, Preferences for Flamingo-CXR reports relative to original clinician reports. Reports are grouped according to the level of agreement between reviewers. b, Clinician preferences for Flamingo-CXR reports depending on the location of the clinician, from either the US-based cohort or the India-based cohort. Note that there are two reviews from each location cohort, so in this case, unanimity corresponds to agreement between two clinicians rather than four in the full panel. c, Preferences for normal reports and separately, for abnormal reports. In all panels, data are presented as mean values and error bars show 95% confidence intervals for the cumulative preference scores. d, Examples from MIMIC-CXR with varying degrees of inter-rater preference agreement; for two examples, all four radiologists unanimously preferred the AI report or the clinician’s report, whereas for the remaining one, the preferences were divided equally. AP, anterior–posterior; CABG, coronary artery bypass graft; IJ, internal jugular; PA-C, physician assistant - certified; SVC, superior vena cava.
Fig. 4
Fig. 4. Comparison of error correction for the AI-generated reports and the original GT reports.
ac, The upper row shows the percentage of reports with at least one (clinically significant) error, and the bottom row shows the average number of identified (clinically significant) errors per report computed as the total number of detected errors divided by the number of all reports, including the ones without errors. These two metrics are compared across the IND1 and MIMIC-CXR datasets overall (a), the two rater locations (India and the United States) to illustrate the regional inter-rater variation (b) and the normal and abnormal cases in the respective datasets (c). Error statistics for GT reports and Flamingo-CXR reports are given for each setting and grouped together as indicated by dashed lines. Data are presented as mean values and error bars correspond to 95% confidence intervals across cases and expert assessments.
Fig. 5
Fig. 5. Results of pairwise preference test for clinician–AI collaboration.
a, Preferences for reports produced from the clinician–AI collaboration relative to the original clinicians’ reports are shown here. The corresponding preference scores for reports produced by Flamingo-CXR without human collaboration are also given. Reports are grouped by the level of agreement between reviewers, and in all cases, we show results for the subset of reports that required editing during the error correction task. Data for all panels are presented as mean values and error bars show 95% confidence intervals for the cumulative preference scores. Significant differences (P < 0.05) between clinician–AI results and AI-only results calculated using a one-sided chi-squared test are indicated by an asterisk (with MIMIC-CXR P values given by *P = 1.3 × 10−2, **P = 5.7 × 10−4, ***P = 3.2 × 10−9; and IND1 P values given by *P = 1.2 × 10−7, **P = 4.4 × 10−9, ***P = 7.7 × 10−6). b, Preferences for reports produced from a collaboration between Flamingo-CXR and radiologists from our US-based cohort and separately, from our India-based cohort. c, Preferences for normal reports and separately, for abnormal reports. d, An example of a pairwise preference test for a clinician–AI report and an AI report, relative to the original clinician’s MIMIC-CXR report. All four radiologists initially indicated a preference for the original clinician’s report to the AI report. Another radiologist revised two sentences in the AI report (indicated in red), resulting in a complete flip in preference in which all four radiologists unanimously expressed the superiority (or equivalence) of the clinician–AI report.
Extended Data Fig. 1
Extended Data Fig. 1. Labelling interface.
(a) In the labelling interface for the pairwise preference test, raters are provided with (i) a frontal view (PA or AP) in the original resolution, (ii) a radiology report generated by our AI system and (iii) the original report written by a radiologist, and are asked to provide their preference. For each case, the raters are unaware of which report is the ground-truth and which one is generated by our model, and are requested to describe their preference out of three options; report A, report B, or equivalence between the two (that is, ‘neither is better than the other’). The interface allows the raters to zoom in and out on the image as needed. They are additionally asked to provide an explanation for their choice. (b) In the labelling interface for the error correction task, raters are provided with (i) the chest X-ray image (a frontal view) and (ii) a radiology report for this image, consisting of the findings and impression sections. Their task is to assess the accuracy of the given radiology report by identifying errors in the report and correcting them. Before each annotation task, clinicians are asked whether the presented image is of sufficient quality for them to complete the task. They are then asked whether there is any part of the report that they do not agree with and, if so, are asked to (a) select the passage that they disagree with, (b) select the reason for disagreement (finding I do not agree with is present; incorrect location of finding; incorrect severity of finding), (c) specify whether the error is clinically significant or not, and (d) provide a replacement for the selected passage.
Extended Data Fig. 2
Extended Data Fig. 2. Detection accuracy per condition on the IND1 dataset.
The receiver operating characteristic (ROC) curve of the Flamingo-CXR report generation model, shown along with the true positive rate (TPR) and false positive rate (FPR) pairs for two certified radiologists are shown for 6 conditions for which the expert labels were collected. The operating point of our model with the default inference scheme (Beam 3) is also shown. Error bars represent 95% confidence intervals (calculated using bootstrapping with 1000 repetitions).
Extended Data Fig. 3
Extended Data Fig. 3. Subgroup analysis of preferences for MIMIC-CXR and IND1.
Here the expert preference data presented in Fig. 3 is analysed further, with preferences shown separately for Flamingo-CXR reports, ground truth reports and neutral preference between reports, for (a) MIMIC-CXR reports and (b) IND1 reports. As before, reports are grouped according to the level of agreement between reviewers who rate Flamingo-CXR reports as equivalent or better than ground truth reports. Preferences are further grouped into normal and abnormal subsets.
Extended Data Fig. 4
Extended Data Fig. 4. Types of errors found in the original reports and the AI-generated reports.
(a) During the error correction evaluation, we ask expert raters to explain the identified issues in reports based on the following taxonomy: (i) incorrect findings, (ii) incorrect severity (for example, mild vs. severe pulmonary edema), (iii) incorrect location of finding (for example, left- vs. right-sided pleural effusion). The figure shows the distributions of these error types for the normal and abnormal cases separately in the IND1 and MIMIC-CXR datasets. Data is presented as mean values and 95% confidence intervals across cases are also shown. In total, there are 34 normal and 272 abnormal cases from the MIMIC-CXR dataset, and 100 normal and 200 abnormal cases from the IND1 dataset. (b) Venn diagrams of error counts for reports that contain at least one error, for the MIMIC-CXR dataset and the IND1 dataset. The intersection between the blue and the green segments indicates the number of cases where both the AI-generated report and the ground truth contained errors. The red segment indicates the cases where at least one clinically significant error is detected.
Extended Data Fig. 5
Extended Data Fig. 5. Average number of clinically significant errors and percentage of reports with at least one error reported by experts in human-written and AI-generated reports across conditions for the MIMIC-CXR and IND1 datasets.
(a) For MIMIC-CXR, the average number of clinically significant errors in reports that are capturing cases with pheumothorax is almost double the number of those with edema, but for most other conditions the occurrence of errors does not vary significantly. It is worth noting that the condition labels for MIMIC-CXR cases are obtained using CheXpert on the original human-written reports. Additionally, if more than one condition is associated with a particular chest X-ray image (which is often the case), the clinically significant errors on the corresponding reports are reported for all of these conditions. (b) For IND1, we do not observe striking differences across conditions in terms of clinically significant errors reported in the AI-generated reports, even though there are more errors on average reported for cases with pleural effusion than those with cardiomegaly. Interestingly, no errors are reported in cases with fracture, so we omit this condition from the figure. These findings indicate that condition prevalence in the training data does not necessarily affect report quality.
Extended Data Fig. 6
Extended Data Fig. 6. Clinician-AI collaboration and clinically significant errors.
Subgroup analysis of the data presented in Fig. 5 illustrates that (a) clinician-AI collaboration produced an improvement in ratings for the subgroup of AI reports that had clinically significant errors (with MIMIC-CXR p values given by p* = 2.6x10⁻³, p** = 1.5x10⁻⁷, p*** = 2.9x10⁻⁸ and with IND1 p values given by p* = 6.3x10⁻⁷, p** = 4.0x10⁻⁸ p*** = 1.3x10⁻⁵), whereas (b), there was little or no improvement for the subgroup of AI reports that did not have clinically significant errors (with MIMIC-CXR p values given by p* = 1.2x10⁻², p** = 1.2x10⁻² and with IND1 p values given by p* = 3.2x10⁻²). As before, significant differences (p < 0.05) between clinician-AI results and AI-only results calculated using a one-sided Chi-squared are indicated by asterisks. This suggests that the positive impact of clinician-AI collaboration is largely attributable to edits in AI reports that had clinically significant errors. Data for all panels is presented as mean values and error bars show 95% confidence intervals for the cumulative preference scores.

References

    1. Maru, D. S.-R. et al. Turning a blind eye: the mobilization of radiology services in resource-poor regions. Global Health6, 18 (2010). - PMC - PubMed
    1. Rimmer, A. Radiologist shortage leaves patient care at risk, warns Royal College. BMJ359, j4683 (2017). - PubMed
    1. Rajpurkar, P. & Lungren, M. P. The current and future state of AI interpretation of medical images. N. Engl. J. Med.388, 1981–1990 (2023). - PubMed
    1. Allen, B., Agarwal, S., Coombs, L., Wald, C. & Dreyer, K. 2020 ACR Data Science Institute artificial intelligence survey. J. Am. Coll. Radiol.18, 1153–1159 (2021). - PubMed
    1. Milam, M. E. & Koo, C. W. The current status and future of FDA-approved artificial intelligence tools in chest radiology in the United States. Clin. Radiol.78, 115–122 (2023). - PubMed

LinkOut - more resources