

Associations of physiologic subtypes based on HOMA2 indices of β-cell function and insulin sensitivity with the risk of kidney function decline, cardiovascular disease, and all-cause mortality from the 4C study
- PMID: 39511523
- PMCID: PMC11546320
- DOI: 10.1186/s12933-024-02496-5
Associations of physiologic subtypes based on HOMA2 indices of β-cell function and insulin sensitivity with the risk of kidney function decline, cardiovascular disease, and all-cause mortality from the 4C study
Abstract
Background: Previous studies have been limited by their inability to differentiate between the effects of insulin sensitivity and β-cell function on the risk of kidney function decline, cardiovascular disease (CVD), and all-cause mortality. To address this knowledge gap, we aimed to investigate whether the physiological subtypes based on homeostasis model assessment-2 (HOMA2) indices of β-cell function (HOMA2-B) and insulin sensitivity (HOMA2-S) could be used to identify individuals with subsequently high or low of clinical outcome risk.
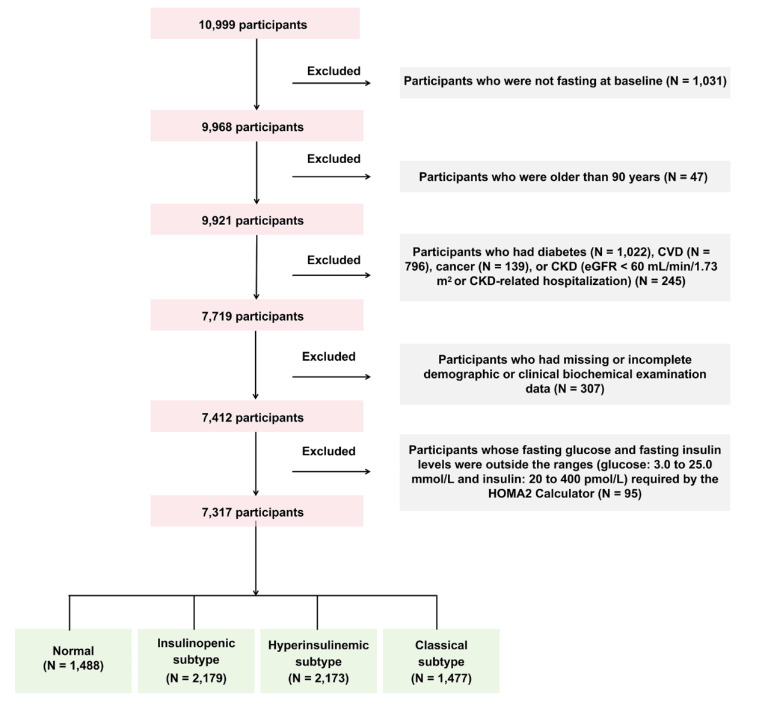
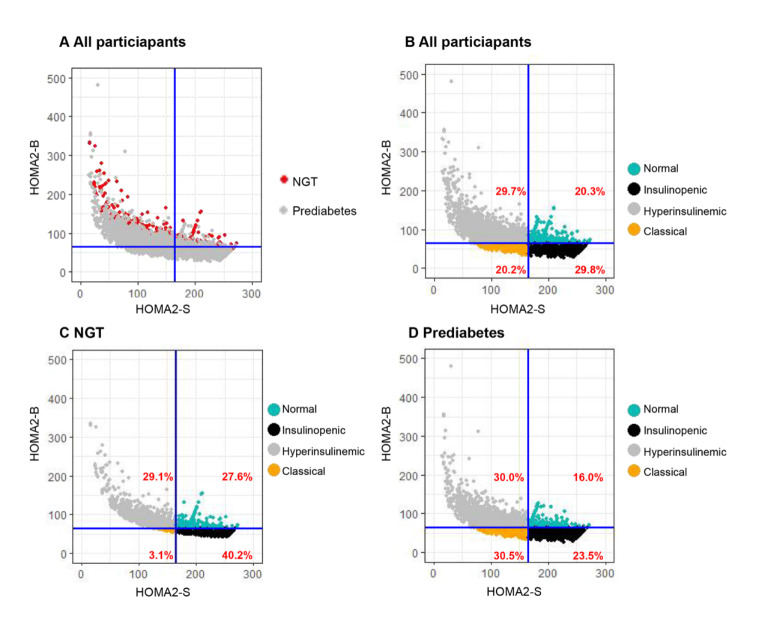
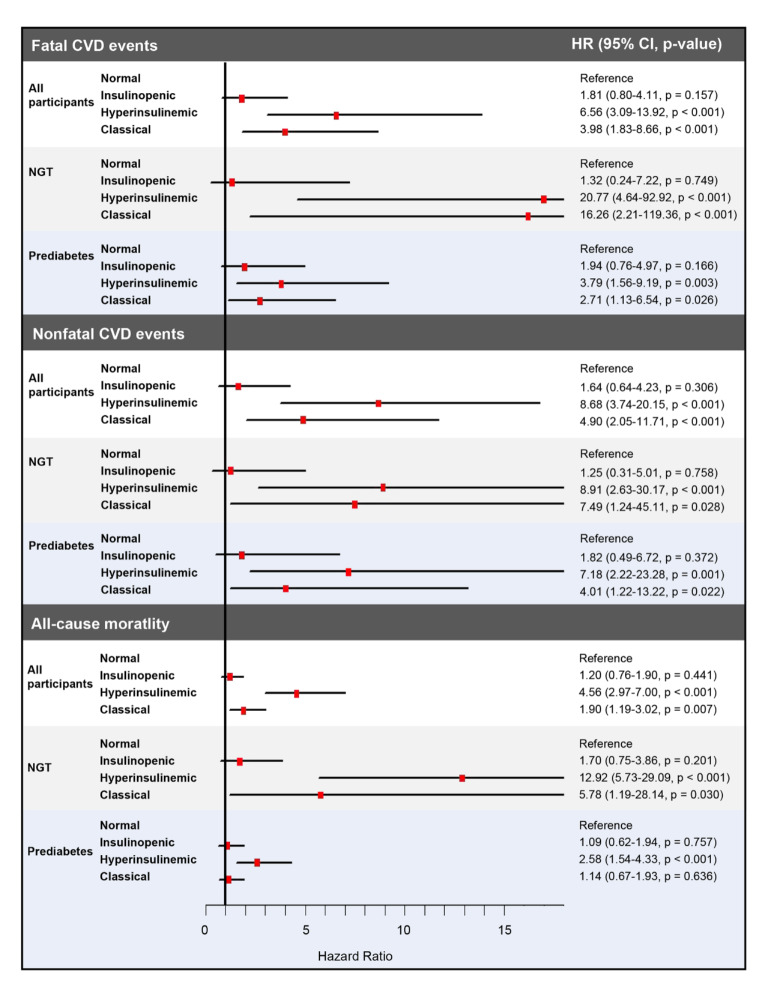
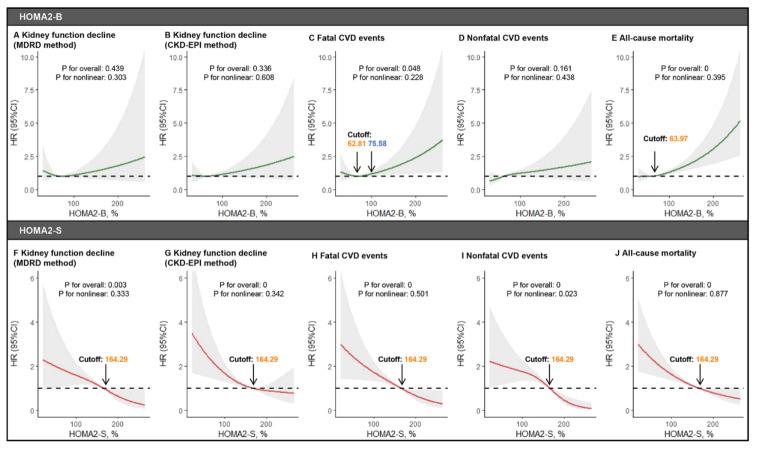
Methods: This retrospective cohort study included 7,317 participants with a follow-up of up to 5 years. Based on HOMA2 indices, participants were categorized into four physiologic subtypes: the normal phenotype (high insulin sensitivity and high β-cell function), the insulinopenic phenotype (high insulin sensitivity and low β-cell function), the hyperinsulinaemic phenotype (low insulin sensitivity and high β-cell function), and the classical phenotype (low insulin sensitivity and low β-cell function). The outcomes included kidney function decline, CVD events (fatal and nonfatal), and all-cause mortality. Cox regression models were used to calculate hazard ratios (HRs) for outcomes, and spline models were used to examine the dose-dependent associations of HOMA2-B and HOMA2-S with outcomes.
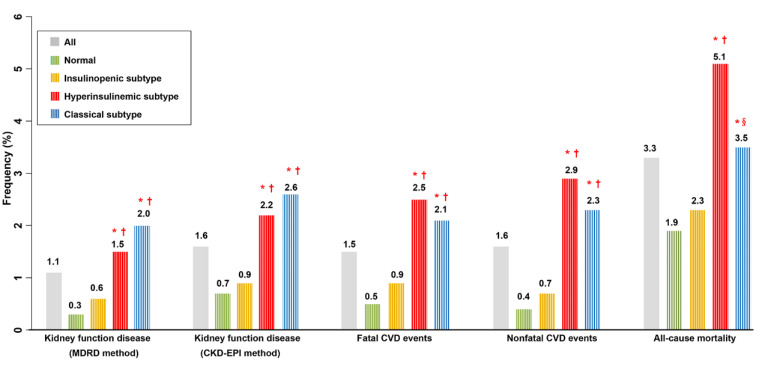
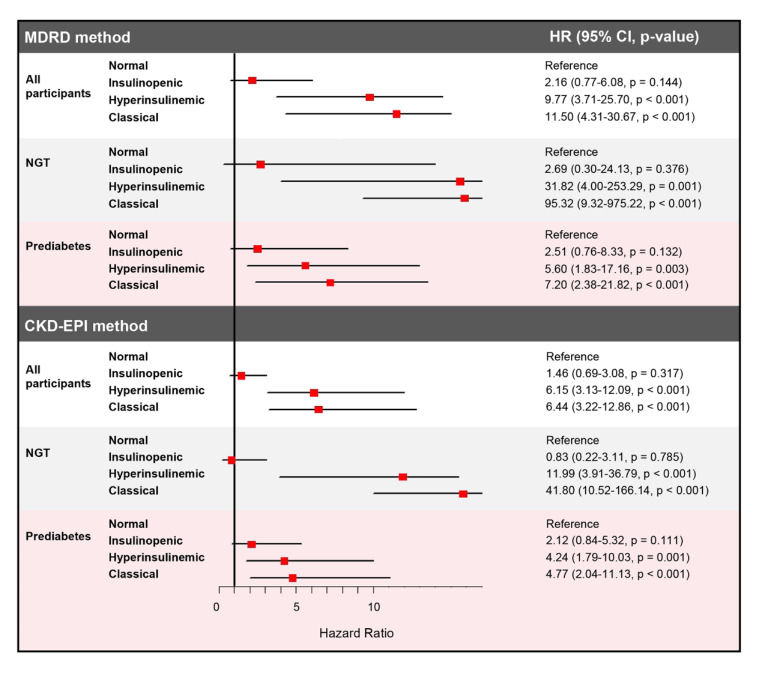
Results: A total of 1,488 (20.3%) were classified as normal, 2,179 (29.8%) as insulinopenic, 2,173 (29.7%) as hyperinsulinemic, and 1,477 (20.2%) as classical subtypes. Compared with other physiological subtypes, the classical subtype presented the highest risk of kidney function decline (classical vs. normal HR 11.50, 95% CI 4.31-30.67). The hyperinsulinemic subtype had the highest risk of CVD and all-cause mortality (hyperinsulinemic vs. normal: fatal CVD, HR 6.56, 95% CI 3.09-13.92; all-cause mortality, HR 4.56, 95% CI 2.97-7.00). Spline analyses indicated the dose-dependent associations of HOMA2-B and HOMA2-S with outcomes.
Conclusions: The classical subtype had the strongest correlation with the risk of kidney function decline, and the hyperinsulinemic subtype had the highest risk of CVD and all-cause mortality, which should be considered for interventions with precision medicine.
Keywords: All-cause mortality; CVD events; HOMA2-B; HOMA2-S; Kidney function decline.
© 2024. The Author(s).
Conflict of interest statement
The authors declare no competing interests.
Figures
Similar articles
-
The Prevalence of Polyneuropathy in Type 2 Diabetes Subgroups Based on HOMA2 Indices of β-Cell Function and Insulin Sensitivity.Diabetes Care. 2023 Aug 1;46(8):1546-1555. doi: 10.2337/dc23-0079. Diabetes Care. 2023. PMID: 37335990
-
Elevated risk of infection in individuals with hyperinsulinaemic type 2 diabetes: a Danish 12 year cohort study.Diabetologia. 2025 Mar;68(3):576-587. doi: 10.1007/s00125-024-06342-x. Epub 2024 Dec 11. Diabetologia. 2025. PMID: 39663235
-
The association between insulin sensitivity indices, ECG findings and mortality: a 40-year cohort study.Cardiovasc Diabetol. 2021 May 6;20(1):97. doi: 10.1186/s12933-021-01284-9. Cardiovasc Diabetol. 2021. PMID: 33957929 Free PMC article.
-
Metabolic score for insulin resistance (METS-IR) predicts all-cause and cardiovascular mortality in the general population: evidence from NHANES 2001-2018.Cardiovasc Diabetol. 2024 Jul 10;23(1):243. doi: 10.1186/s12933-024-02334-8. Cardiovasc Diabetol. 2024. PMID: 38987779 Free PMC article.
-
Antidepressant medication use and trajectories of fasting plasma glucose, glycated haemoglobin, β-cell function and insulin sensitivity: a 9-year longitudinal study of the D.E.S.I.R. cohort.Int J Epidemiol. 2015 Dec;44(6):1927-40. doi: 10.1093/ije/dyv153. Epub 2015 Aug 4. Int J Epidemiol. 2015. PMID: 26245205
References
-
- Webster AC, Nagler EV, Morton RL, Masson P. Chronic Kidney Disease Lancet. 2017;389(10075):1238–52. - PubMed
-
- Kishi S, Kadoya H, Kashihara N. Treatment of chronic kidney disease in older populations. Nat Rev Nephrol. 2024. - PubMed
-
- Flora GD, Nayak MK. A brief review of Cardiovascular diseases, Associated Risk factors and current treatment regimes. Curr Pharm Des. 2019;25(38):4063–84. - PubMed
Publication types
MeSH terms
Substances
Grants and funding
LinkOut - more resources
Full Text Sources
Medical
Miscellaneous
