. 2024 Nov 7;26(1):191.
doi: 10.1186/s13075-024-03413-7.

Outgrowth of Escherichia is susceptible to aggravation of systemic lupus erythematosus

Affiliations

Outgrowth of Escherichia is susceptible to aggravation of systemic lupus erythematosus

Lian Gui et al. Arthritis Res Ther. .

Abstract

Background: Systemic lupus erythematosus (SLE) is linked to host gut dysbiosis. Here we performed faecal gut microbiome sequencing to investigate SLE-pathogenic gut microbes and their potential mechanisms.

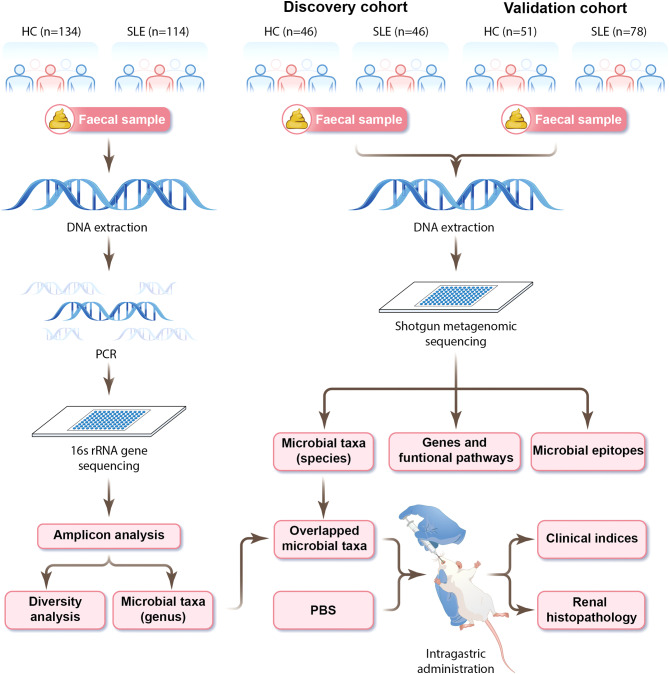
Methods: There were 134 healthy controls (HCs) and 114 SLE cases for 16 S ribosomal RNA (rRNA) sequencing and 97 HCs and 124 SLE cases for shotgun metagenomics. Faecal microbial changes and associations with clinical phenotypes were evaluated, and SLE-associated microbial genera were identified in amplicon analysis. Next, metagenomic sequencing was applied for accurate identification of microbial species and discovery of their metabolic pathways and immunogenic peptides both relevant to SLE. Finally, contribution of specific taxa to disease development was confirmed by oral gavage into lupus-prone MRL/lpr mice.

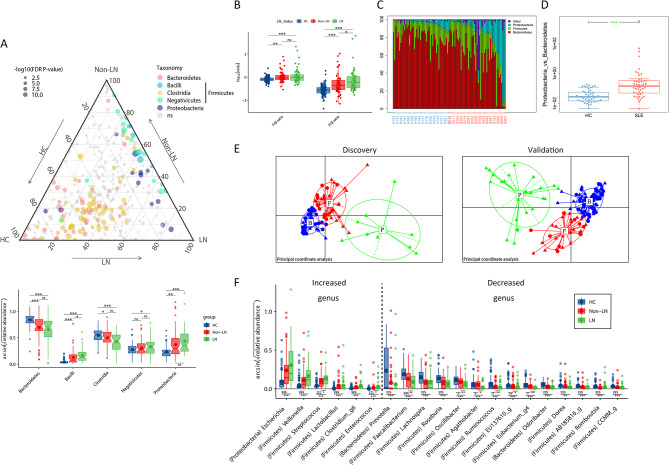
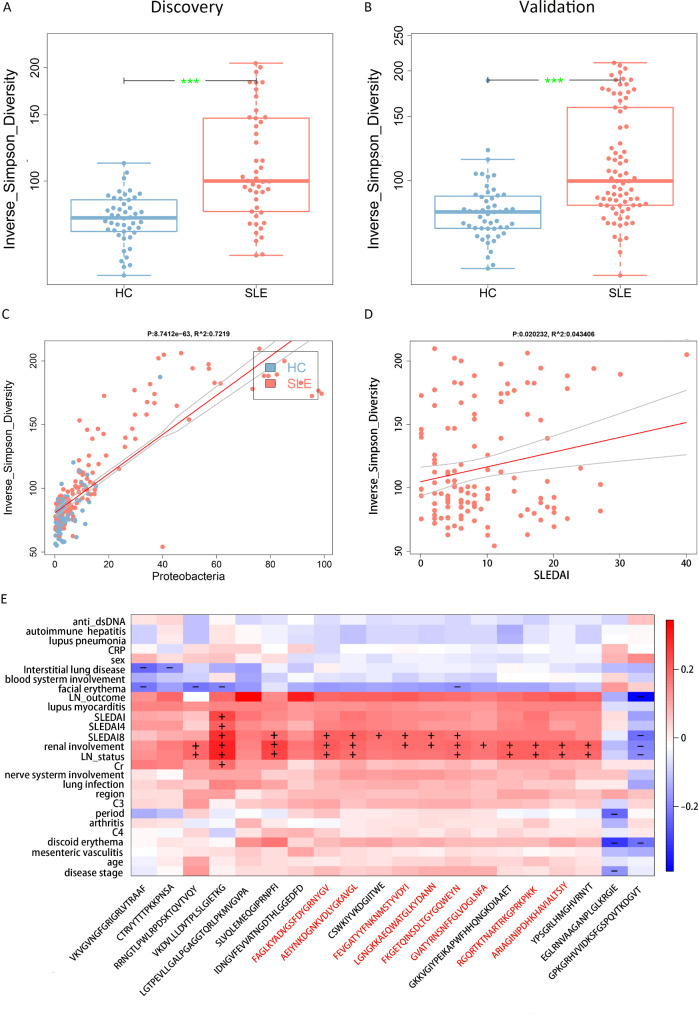
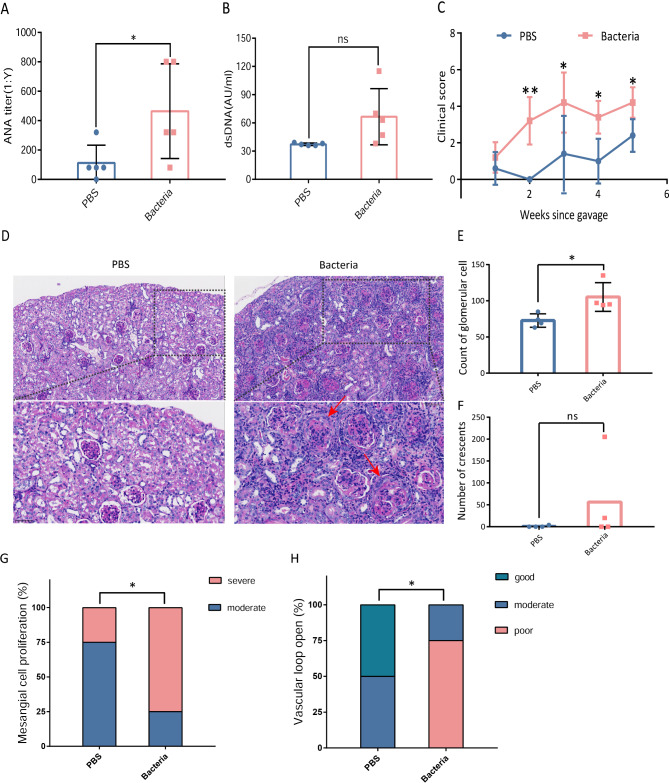
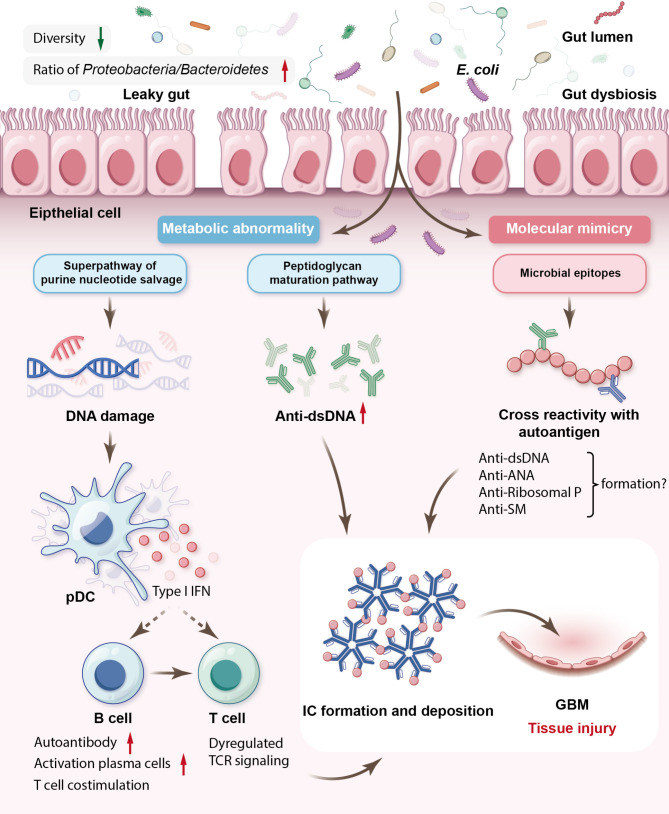
Results: SLE patients had gut microbiota richness reduction and composition alteration, particularly lupus nephritis and active patients. Proteobacteria/Bacteroidetes (P/B) ratio was remarkably up-regulated, and Escherichia was identified as the dominantly expanded genus in SLE, followed by metagenomics accurately located Escherichia coli and Escherichia unclassified species. Significant associations primarily appeared among Escherichia coli, metabolic pathways of purine nucleotide salvage or peptidoglycan maturation and SLE disease activity index (SLEDAI), and between multiple epitopes from Escherichia coli and disease activity or renal involvement phenotype. Finally, gavage with faecal Escherichia revealed that it upregulated lupus-associated serum traits and aggravated glomerular lesions in MRL/lpr mice.

Conclusion: We characterize a novel SLE exacerbating Escherichia outgrowth and suggest its contribution to SLE procession may be partially associated with metabolite changes and cross-reactivity of gut microbiota-associated epitopes and host autoantigens. The findings could provide a deeper insight into gut Escherichia in the procession of SLE.

Keywords: Escherichia; Gut microbiota dysbiosis; Gut microbiota-associated epitopes; Shotgun metagenomics; Systemic lupus erythematosus.


Conflict of interest statement

The authors declare no competing interests.

Figures

Fig. 1
Fig. 1
The full flowchart of the experiments
Fig. 2
Fig. 2
Obviously reduced diversity and altered gut microbial composition in faecal samples from SLE patients with renal damage and high disease activity. Alpha-diversity of richness (OTUs) and diversity (Shannon index) of faecal microbiota were compared between HCs and SLE (A), and between non-LN and LN patients (B). PCoA based on Bray-Curtis distance was performed using ‘adonis’ function in ‘Vegan’ package and used for the comparison of the difference of bacterial composition between HCs and SLE patients (C), and between non-LN patients and LN patients (D). (E) The Shannon index of gut microbiota was compared between active patients and inactive patients, stratified by SLEDAI-2K. (F) The correlation analysis of the observed OTUs and SLEDAI score in patients using Spearman’s correlation analysis. HCs, healthy controls; SLE, systemic lupus erythematosus; LN, lupus nephritis; OTUs, operational taxonomic units; PCoA, Principal Coordination analysis; SLEDAI, systemic lupus erythematosus disease activity index. P < 0.05 was considered statistically significant
Fig. 3
Fig. 3
Upregulation of characteristic P/B ratio and Escherichia genus involved in the gut dysbiosis of SLE. (A) Ternary plot displays the composition and enrichment of OTUs across the healthy controls (HCs, left corner), non-LN patients (Non-LN, top corner) and LN patients (LN, right corner). The coordination of each OTU is assigned according to its mean relative abundance in each group. The size of each circle represents the degree of significance of each OTU. The color of each circle represents the taxonomy assignment of each OTU. Non-significant OTUs are colored as grey with “ns” taxonomy label. The bottom part shows the comparison of the aggregated abundance of the main phylum or class taxa among HCs, non-LN and LN. Relative abundance was subjected to arcsine-squared transformation for visualization convenience. (B) The comparison of P/B ratio and previously reported F/B ratio among HCs, non-LN patients and LN patients. F/B or P/B ratio were calculated using the ratio of the untransformed relative abundance. (C) Enterotypes analysis of components of faecal microbiota in HCs and SLE patients using a clustering approach with phylum level. (D) The comparison of P/B ratio shown between HCs and SLE patients for shotgun metagenomics. (E) PCoA analysis for the distribution of Firmicutes, Bacteroidetes and Proteobacteria phylum of HCs and SLE cases in the discovery cohort and validation cohort. (F) The twenty most significant differentially changed bacterial genera were analyzed, followed by ranking of their abundances among HCs, non-LN and LN patients. Differential abundance at the phylum, family or genus level is identified by Wilcoxon rank sum test (FDR, which is correction of p value by Benjamini and Hochberg for multiple comparisons). HCs, healthy controls; LN, lupus nephritis; F: Firmicutes; B: Bacteroidetes; P: Proteobacteria; PCoA, Principal Coordination analysis; FDR, false discovery rate. *p < 0.05, **p < 0.001, ***p < 0.0001, ns, not significant
Fig. 4
Fig. 4
The most prominently upregulated Escherichia coli correlates with disease activity and the associated metabolic pathways changes in patients with SLE. (A) The primarily changed bacterial species between HCs and SLE patients by LDA method are plotted for shotgun metagenomics. The abundance alteration of Escherichia coli is shown between HCs and patients in (B) and between patients with different activities in (C). The relationship of Escherichia coli abundance and SLEDAI score was analyzed (D). (E) The relationships of the SLE-altered bacterial species and enriched functional pathways were analyzed using the labeledHeatmap function of the WGCNA of R. (FH) The associations of the key pathways about Escherichia coli and SLEDAI score were analyzed. HCs, healthy controls; SLE, systemic lupus erythematosus; PCoA, Principal Coordination analysis; LDA: Linear Discriminant Analysis; SLEDAI, systemic lupus erythematosus disease activity index. *p < 0.05, ***p < 0.001
Fig. 5
Fig. 5
The gut Escherichia coli-associated epitope changes correlate with disease activity in patients with SLE. The diversity of MEs was compared between HCs and SLE patients in the discovery cohort (A) and the validation cohort (B). The correlation between MEs diversity and the abundance of Proteobacteria (C) or SLEDAI (D) was analyzed in SLE Patients. (E) The correlations between the predicted MEs and clinical factors were analyzed. The MEs marked by red font represents the origin of Escherichia coli. ***p < 0.001. +: positive correlation, -: negative correlation
Fig. 6
Fig. 6
Gavage with Escherichia bacterial solution promotes the increase of lupus-associated traits and renal damage in MRL/lpr mice. (AC) The titers of ANA and anti-dsDNA, and clinical score were compared between MRL/lpr mice gavaged with Escherichia bacterial solution and those with PBS. (D) The paraffin-embedded renal tissue sections were stained using Periodic Acid-Schiff staining and then scanned by scanning electron microscopy. The upper graph is imaged at 200 times magnification and the bottom one is correspondingly imaged at 400 times magnification. Red arrow points to the area of crescent formation. (E-F) The number changes of glomerular cells and crescents were analyzed between bacterial solution-gavage group and PBS-gavage group. (G-H) The degree of renal injury was compared between bacterial solution-gavage group and PBS-gavage group by Kruskal Wallis test. n = 4–5. *p < 0.05, ** p < 0.01, ns, not significant
Fig. 7
Fig. 7
Schematic illustration for the potential mechanisms of gut dysbiosis characterized by Escherichia dominated by Escherichia coli outgrowth resulting in the exacerbation of SLE disease. E.coli, Escherichia coli; dsDNA, double-stranded DNA; ANA, antinuclear antibody; pDC, plasmacytoid dendritic cell; IFN, interferon; TCR: T-cell receptor; IC, immune complexes; GBM, glomerular basement membrane

References

    1. Kaul A, Gordon C, Crow MK, Touma Z, Urowitz MB, van Vollenhoven R, et al. Systemic lupus erythematosus. Nat Rev Dis Primers. 2016;2:16039. - PubMed
    1. Tsokos GC. Systemic lupus erythematosus. N Engl J Med. 2011;365:2110–21. - PubMed
    1. Clemente JC, Ursell LK, Parfrey LW, Knight R. The impact of the gut microbiota on human health: an integrative view. Cell. 2012;148(6):1258–70. - PMC - PubMed
    1. Kamada N, Seo SU, Chen GY, Nunez G. Role of the gut microbiota in immunity and inflammatory disease. Nat Rev Immunol. 2013;13(5):321–35. - PubMed
    1. Zhang X, Zhang D, Jia H, Feng Q, Wang D, Liang D, et al. The oral and gut microbiomes are perturbed in rheumatoid arthritis and partly normalized after treatment. Nat Med. 2015;21(8):895–905. - PubMed

LinkOut - more resources