. 2024 Nov 7;17(1):107.
doi: 10.1186/s13045-024-01629-3.

A single-cell transcriptomic map of the murine and human multiple myeloma immune microenvironment across disease stages

Affiliations

A single-cell transcriptomic map of the murine and human multiple myeloma immune microenvironment across disease stages

Emma Verheye et al. J Hematol Oncol. .

Abstract

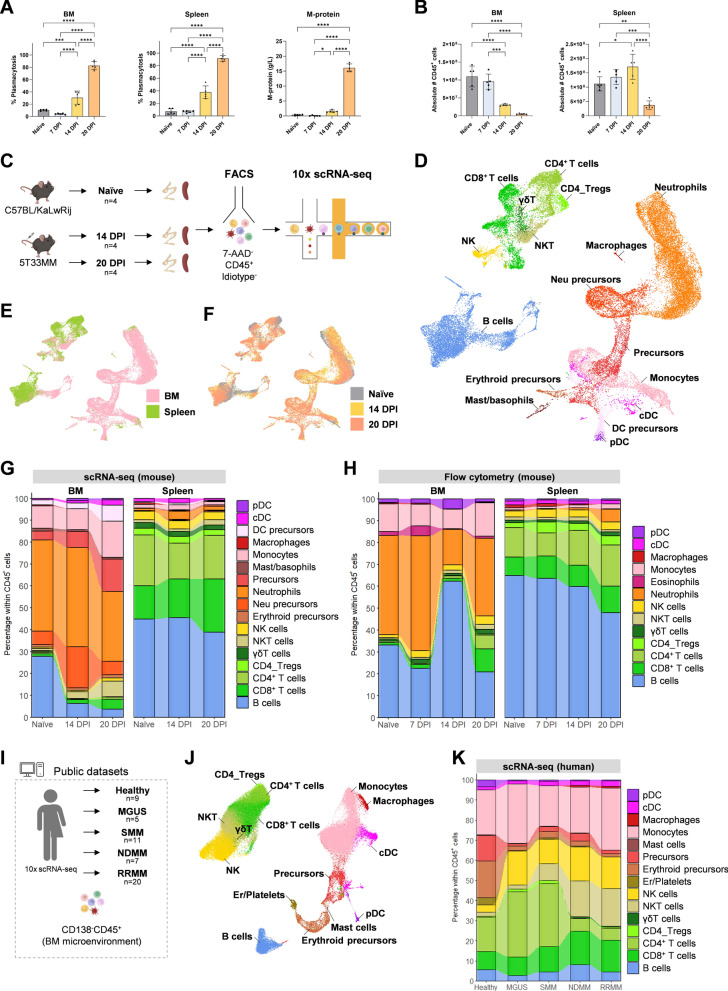
Background: The long-term effectiveness of immunotherapies against Multiple Myeloma (MM) remains elusive, demonstrated by the inevitable relapse in patients. This underscores the urgent need for an in-depth analysis of the MM tumor-immune microenvironment (TME). Hereto, a representative immunocompetent MM mouse model can offer a valuable approach to study the dynamic changes within the MM-TME and to uncover potential resistance mechanisms hampering effective and durable therapeutic strategies in MM.

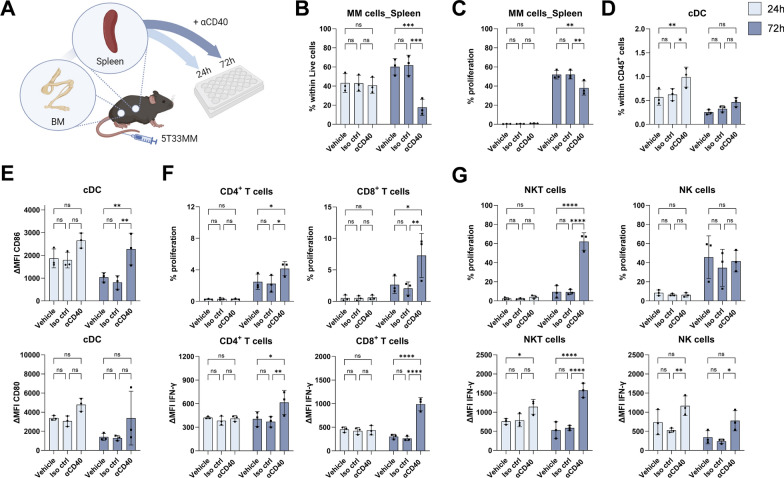
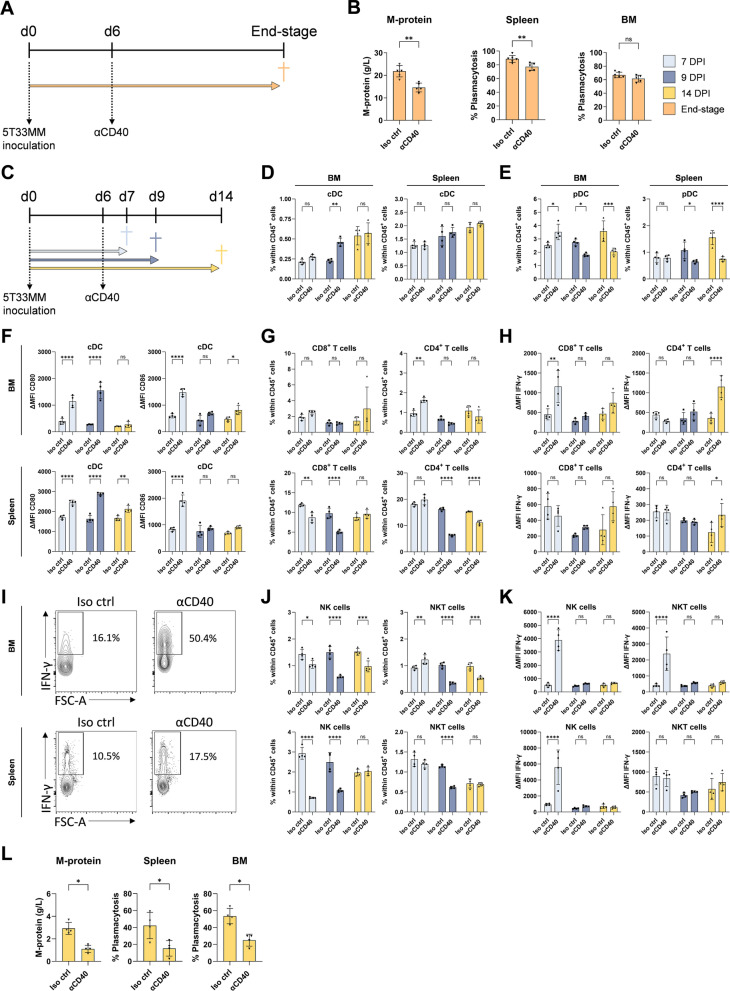
Methods: We generated a comprehensive single-cell RNA-sequencing atlas of the MM-TME in bone marrow and spleen encompassing different stages of disease, using the immunocompetent 5T33MM mouse model. Through comparative analysis, we correlated our murine dataset with the pathogenesis in MM patients by reanalyzing publicly available datasets of human bone marrow samples across various disease stages. Using flow cytometry, we validated the dynamic changes upon disease progression in the 5T33MM model. Furthermore, interesting target populations, as well as the immune-boosting anti-CD40 agonist (αCD40) therapy were tested ex vivo on murine and human primary samples and in vivo using the 5T33MM model.

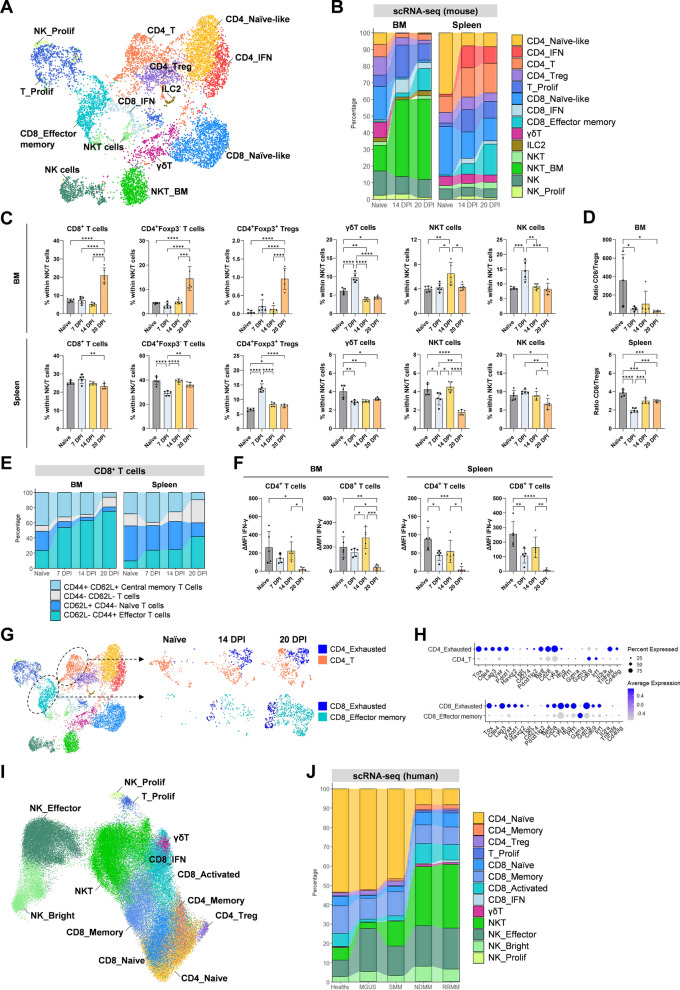
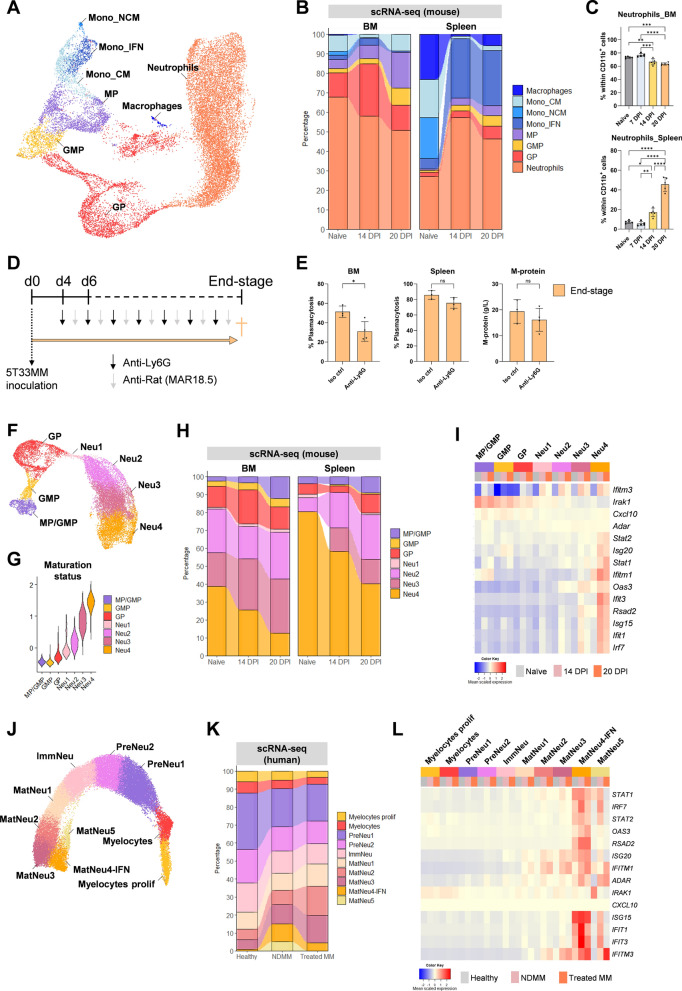
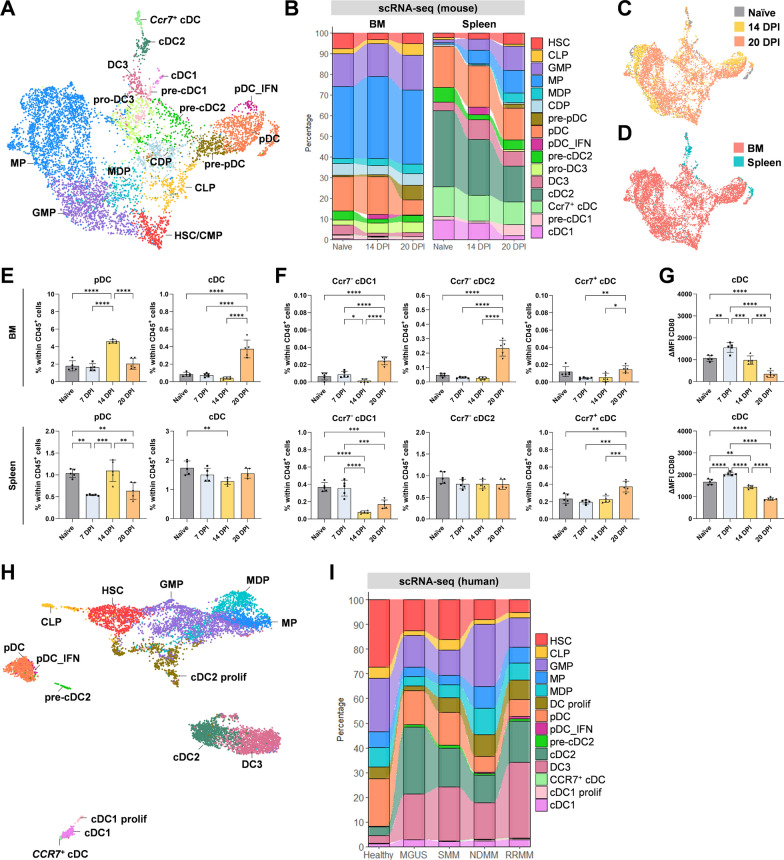
Results: In this study, we identified the heterogenous and dynamic changes within the TME of murine and human MM. We found that the MM-TME was characterized by an increase in T cells, accompanied with an exhausted phenotype. Although neutrophils appeared to be rather innocuous at early disease stages, they acquired a pro-tumorigenic phenotype during MM progression. Moreover, conventional dendritic cells (cDCs) showed a less activated phenotype in MM, underscoring the potential of immune-boosting therapies such as αCD40 therapy. Importantly, we provided the first pre-clinical evaluation of αCD40 therapy and demonstrated successful induction of cDC- and T-cell activation, accompanied by a significant short-term anti-tumor response.

Conclusions: This resource provides a comprehensive and detailed immune atlas of the evolution in human and murine MM disease progression. Our findings can contribute to immune-based patient stratification and facilitate the development of novel and durable (immune) therapeutic strategies in MM.

Keywords: 5T33MM immune microenvironment; Anti-CD40 agonist therapy; Human-mouse comparison; Multiple myeloma progression; Single-cell RNA-sequencing.


Conflict of interest statement

The authors declare no competing interests.

Figures

Fig. 1
Fig. 1
A detailed atlas of the tumor-immune microenvironment in murine and human MM. (A) Bar graphs show the tumor load in the 5T33MM bone marrow (BM), spleen and serum at 7, 14, and 20 days post-tumor inoculation (DPI). This is demonstrated by the percentage of plasmacytosis in BM and spleen, and the presence of the M-protein (g/L) in serum. (B) Bar graphs show the absolute number of CD45+ cells in BM and spleen of naïve and 5T33MM mice at 7, 14, and 20 DPI. n = 5 per group. (C) Schematic outline of the experimental procedures, detailing the sorting of 7-AADCD45+idiotype immune cells from naïve and 5T33MM mice (at 14 DPI and 20 DPI) for single-cell RNA-sequencing (scRNA-seq; 10 × Genomics). n = 4 samples pooled. (D) UMAP plot shows high-resolution clustering of the immune cell compartment in BM and spleen, using the scRNA-seq dataset of naïve mice and the 5T33MM model. (EF) UMAP embedding as shown in panel D, but colored according to (E) tissue of origin; including BM and spleen, and (F) stage of disease; including naïve mice and 5T33MM mice at 14 DPI and 20 DPI. (G-H) Bar graphs show the frequency of immune cells within the CD45+ cells across different stages of disease in murine BM and spleen, analyzed using (G) scRNA-seq and (H) flow cytometry. (I) Schematic outline of the consulted publicly available datasets (scRNA-seq; 10 × Genomics), including a CD138CD45+ sort on mononuclear cells from healthy individuals (n = 9), precursor stages such as Monoclonal Gammopathy of Undetermined Significance (MGUS; n = 5) and Smoldering Multiple Myeloma (SMM; n = 11), as well as Newly Diagnosed Multiple Myeloma (NDMM; n = 7) and Relapsed/Refractory Multiple Myeloma (RRMM; n = 20). (J) UMAP plot shows high-resolution subclustering of the immune cell compartment within the human BM scRNA-seq dataset. (K) Bar graph shows the frequency of immune cells within the CD45+ cells of the human BM scRNA-seq dataset across different stages of disease. Error bars represent mean values ± SD. Statistical analysis was performed by Ordinary One-way ANOVA. ns: p ≥ 0.05, *p < 0.05, **p < 0.01, ***p < 0.001, and ****p < 0.0001
Fig. 2
Fig. 2
The MM microenvironment is characterized by the presence of T cells with an exhausted phenotype. (A) UMAP plot shows high-resolution subclustering of the NK-/T-cell compartment within the in-house murine scRNA-seq dataset. (B) Bar graph shows the frequency of the different NK-/T-cell subsets within the murine BM and spleen, and across different disease stages; including naïve mice and 5T33MM mice at 14 DPI and 20 DPI, analyzed in the murine scRNA-seq dataset. (C and D) Bar graphs show (C) the frequencies of CD8+ T cells, CD4+ T cells, Foxp3+ T cells, γδT cells, NKT cells and NK cells as a percentage of the NK and T cells (CD11b CD19 cells), and (D) the CD8+ T cells/Treg ratio in BM (top) and spleen (bottom) from naïve and 5T33MM mice at 7, 14, and 20 DPI. Analyzed using flow cytometry. n = 5 per group. (E) Bar graph shows the frequency of CD44+CD62L+ Central memory T cells, CD44CD62L T cells, CD62L+CD44 Naïve T cells and CD62LCD44+ Effector T cells within the CD8+ T cells in murine BM and spleen, and across different stages of disease, analyzed using flow cytometry. n = 5 per group. (F) Bar graphs show ΔMFI (median fluorescence intensity) of IFN-γ in CD4+ T cells and CD8+ T cells present in the BM and spleen across different stages of disease, analyzed using flow cytometry. n = 5 per group. (G) UMAP plot shows high-resolution subclustering of the CD8_Effector memory cluster and the CD4_T cluster, identifying the CD4_Exhausted cluster and the CD8_Exhausted cluster as well as their evolution across different stages of disease, analyzed in the murine scRNA-seq dataset. (H) Dot plot shows the expression of marker genes associated with exhaustion within the murine scRNA-seq dataset. Dot size represents the percentage of cells expressing the gene and color gradient represents the average scaled expression within a cell cluster. (I) UMAP plot shows high-resolution subclustering of the NK-/T-cell compartment within the human BM scRNA-seq dataset. (J) Bar graph shows the frequency of the different NK-/T-cell subsets within the human BM scRNA-seq dataset across different stages of disease. Error bars represent mean values ± SD. Statistical analysis was performed by Ordinary One-way ANOVA. ns: p ≥ 0.05, *p < 0.05, **p < 0.01, ***p < 0.001, and ****p < 0.0001
Fig. 3
Fig. 3
Neutrophils acquired a more pronounced pro-tumor phenotype upon MM disease progression. (A) UMAP plot shows high-resolution subclustering of the myeloid compartment within the murine scRNA-seq dataset. (B) Bar graph shows the frequency of the different myeloid subsets within the murine BM and spleen across different disease stages, including naïve mice and 5T33MM mice at 14 DPI and 20 DPI, analyzed using the murine scRNA-seq dataset. (C) Bar graphs show the frequency of neutrophils within the CD11b+ cells in the murine BM (top) and spleen (bottom) across different stages of disease, analyzed using flow cytometry. n = 5 per group. Statistical analysis was performed by an Ordinary One-way ANOVA. (D) Schematic outline of the experimental procedures. 5T33MM-inoculated mice received alternating anti-Ly6G and anti-Rat (MAR18.5), starting at 4 DPI. Mice were sacrificed at end-stage. (E) Bar graphs show the tumor load, assessed by the percentage plasmacytosis in BM and spleen, and via the M-protein in serum. n = 3–4 per group. Statistical analysis was performed by Mann-Whitney U-test. (FL) Reclustering of the neutrophils using (FI) the in-house murine scRNA-seq dataset, and (JL) the human scRNA-seq dataset, based on de Jong et al. [9] (F, J) UMAP plot shows high-resolution subclustering of neutrophils and neutrophil precursors, analyzed in (F) the murine and (J) the human scRNA-seq dataset. (G) Violin plot shows the maturation status of the different neutrophil clusters. The maturation status was determined by the top 50 differentially expressed genes, based on Xie et al. [16] (H, K) Bar graph shows the frequency of the different neutrophil clusters across different stages of disease, analyzed using (H) the in-house murine scRNA-seq dataset, and (K) the human scRNA-seq dataset. (I, L) Heatmap plot shows the expression of IFN-associated genes by the different neutrophil clusters across different disease stages, analyzed using (I) the in-house murine scRNA-seq dataset and (L) the human scRNA-seq dataset. Error bars represent mean values ± SD. ns: p ≥ 0.05, *p < 0.05, **p < 0.01, ***p < 0.001, and *****p < 0.0001
Fig. 4
Fig. 4
Conventional DCs (cDCs) show a less activated phenotype in MM-bearing mice. (A) UMAP plot shows high-resolution subclustering of the dendritic cell (DC) compartment within the murine scRNA-seq dataset. (B) Bar graph shows the frequency of the different DC subsets with the murine BM and spleen across different stages of disease, including naïve mice and 5T33MM mice at 14 DPI and 20 DPI, analyzed using the murine scRNA-seq dataset. (C-D) UMAP embedding as shown in panel A but colored according to (C) stage of disease; including naïve mice and 5T33MM mice at 14 DPI and 20 DPI, and (D) tissue of origin; including BM and spleen. (E–F) Bar graphs show the frequency of (E) pDCs and cDCs and (F) cDC subsets within the CD45+ cells in murine BM (top) and spleen (bottom) across different stages of disease, analyzed using flow cytometry. n = 5 per group. (G) Bar graphs show the ΔMFI (median fluorescence intensity) of CD80 in total cDCs derived from murine BM (top) and spleen (bottom) across different stages of disease, analyzed using flow cytometry. n = 5 per group. (H) UMAP plot shows high-resolution subclustering of the DC compartment within the human BM scRNA-seq dataset. (I) Bar graph shows the frequency of the different DC subsets within the human BM scRNA-seq dataset across different stages of disease. Error bars represent mean values ± SD. Statistical analysis was performed by Ordinary One-way ANOVA. ns: p ≥ 0.05, *p < 0.05, **p < 0.01, ***p < 0.001, and ****p < 0.0001
Fig. 5
Fig. 5
Anti-CD40 agonist (αCD40) therapy induces DC activation and T-cell activation ex vivo. (A) Schematic outline of the experimental procedure. BM and spleen cells from 14 DPI 5T33MM mice were ex vivo treated with 10 µg of αCD40 therapy or isotype control (Iso ctrl) for 24h and 72h. n = 3 per condition. (B-C) Bar graphs show the percentage of (B) living MM cells and (C) proliferation of MM cells in spleen after 24h and 72h of αCD40 therapy, analyzed using flow cytometry. (D-E) Bar graphs show (D) the percentage of total cDCs within CD45+ cells, and (E) the ΔMFI (median fluorescence intensity) of CD86 and CD80 in total cDCs in spleen after 24h and 72h of αCD40 therapy, analyzed using flow cytometry. (F-G) Bar graphs show the percentage of proliferation (top), as well as the ΔMFI (median fluorescence intensity, bottom) of IFN-γ in CD4+ T cells, CD8+ T cells, NKT cells and NK cells in spleen after 24h and 72h of αCD40 therapy, analyzed using flow cytometry. Error bars represent mean values ± SD. Statistical analysis was performed by a two-way ANOVA. ns: p ≥ 0.05, *p < 0.05, **p < 0.01, ***p < 0.001, and ****p < 0.0001
Fig. 6
Fig. 6
αCD40 therapy induced DC activation and T-cell activation, resulting in short-term anti-tumor effects in the 5T33MM model. (A) Schematic outline of the experimental procedure. 5T33MM-inoculated mice received 100 µg of αCD40 therapy or isotype control (Iso ctrl) at 6 DPI. Mice were sacrificed when the control mice reached end-stage of disease. n = 5–6 per group. (B) Bar graphs show the tumor load of αCD40 treated 5T33MM mice sacrificed at end-stage of disease. Tumor load was assessed via the M-protein in serum, and by the percentage plasmacytosis in spleen and BM. (C) Schematic outline of the experimental procedure. 5T33MM-inoculated mice received 100 µg of Iso ctrl or αCD40 therapy at 6 DPI. Mice were sacrificed at 24h (7 DPI), 72h (9 DPI) and one week (14 DPI) after αCD40 therapy. n = 4 per group. (D-E) Bar graphs show the percentage of (D) total cDCs and (E) pDCs within CD45+ cells in BM and spleen, at indicated timepoints in panel C, analyzed using flow cytometry. (F) Bar graphs show the ΔMFI (median fluorescence intensity) of CD80 and CD86 in total cDCs from BM (top) and spleen (bottom), at indicated timepoints in panel C, analyzed using flow cytometry. (G-H) Bar graphs show (G) the percentage of CD4+ T cells and CD8+ T cells within CD45+ cells, and (H) the ΔMFI (median fluorescence intensity) of IFN-γ in CD4+ T cells and CD8+ T in BM (top) and spleen (bottom), at indicated timepoints in panel C, analyzed using flow cytometry. (I) Representative flow cytometry plots show the frequency of IFN-γ in T cells in BM (top) and spleen (bottom) after αCD40 therapy or Iso ctrl, analyzed using flow cytometry. (J-K) Bar graphs show (J) the percentage of NK cells and NKT cells, and (K) ΔMFI (median fluorescence intensity) of IFN-γ in NK cells and NKT cells in BM (top) and spleen (bottom), at indicated timepoints in panel C, analyzed using flow cytometry. (L) Bar plots show the tumor load of αCD40 treated 5T33MM mice sacrificed at 14 DPI. Tumor load was assessed via the M-protein in serum, and by the percentage plasmacytosis in spleen and BM. Error bars represent mean values ± SD. Statistical analysis was performed by Mann–Whitney U-test (for 2 groups) and two-way ANOVA (for multiple groups). ns: p ≥ 0.05, *p < 0.05, **p < 0.01, ***p < 0.001, and ****p < 0.0001

References

    1. Kumar SK, et al. Multiple myeloma. Nat Rev Dis Primer. 2017;3:1–20. - PubMed
    1. Mohyuddin GR, Chakraborty R, Cliff ERS, Derman BA. Clinician preferences on treatment of smoldering myeloma: a cross-sectional survey. eClinicalMedicine. 2023;65:102272. - PMC - PubMed
    1. Rodriguez-Otero P, et al. GPRC5D as a novel target for the treatment of multiple myeloma: a narrative review. Blood Cancer J. 2024;14:1–13. - PMC - PubMed
    1. Wang Q, et al. An alternative fully human anti-BCMA CAR-T shows response for relapsed or refractory multiple myeloma with anti-BCMA CAR-T exposures previously. Cancer Gene Ther. 2024;31:420–6. - PMC - PubMed
    1. Dang M, et al. Single cell clonotypic and transcriptional evolution of multiple myeloma precursor disease. Cancer Cell. 2023;41:1032-1047.e4. - PMC - PubMed

Publication types