. 2024 Nov 7;22(1):254.
doi: 10.1186/s12915-024-02032-7.

Widespread 3'UTR capped RNAs derive from G-rich regions in proximity to AGO2 binding sites

Affiliations

Widespread 3'UTR capped RNAs derive from G-rich regions in proximity to AGO2 binding sites

Nejc Haberman et al. BMC Biol. .

Abstract

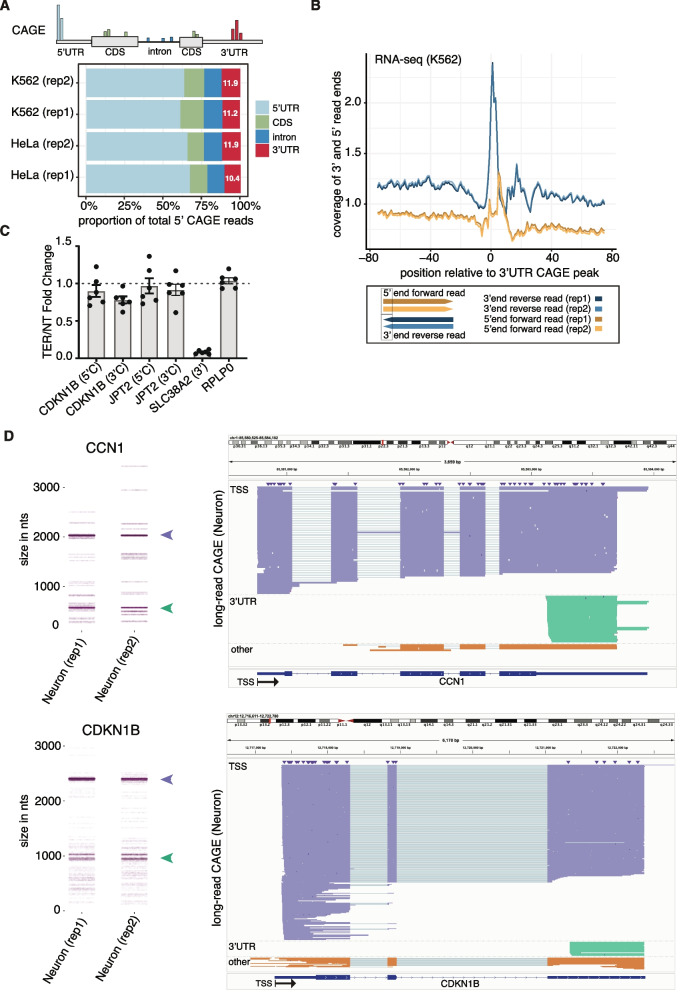
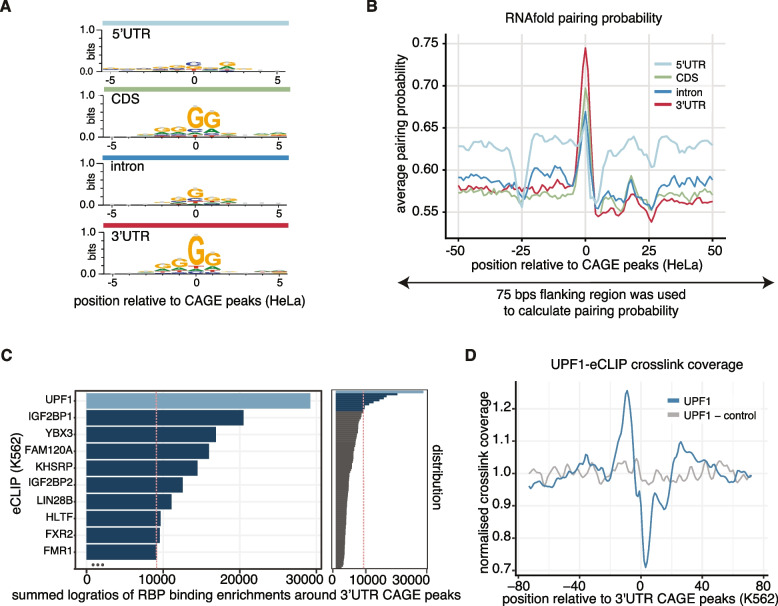
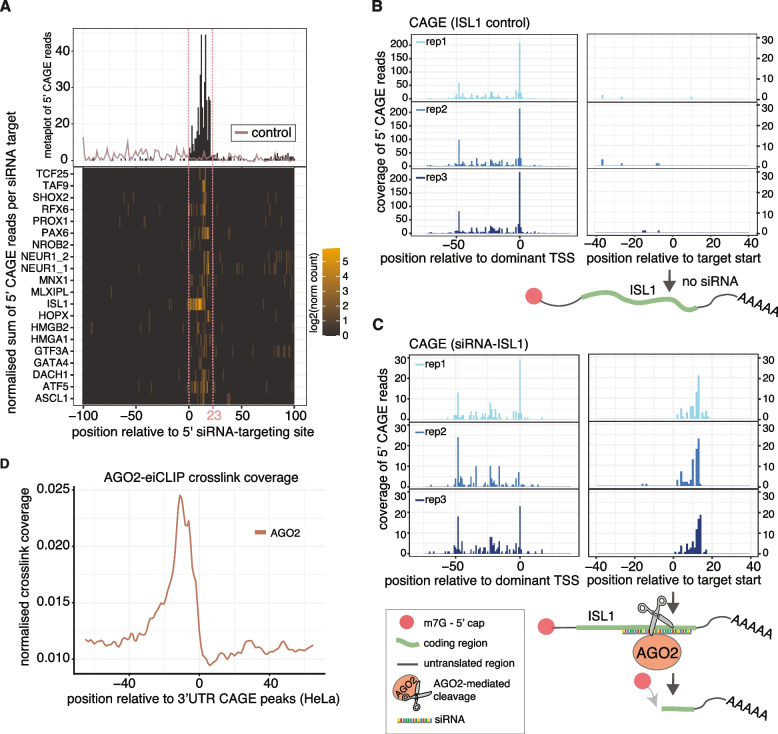
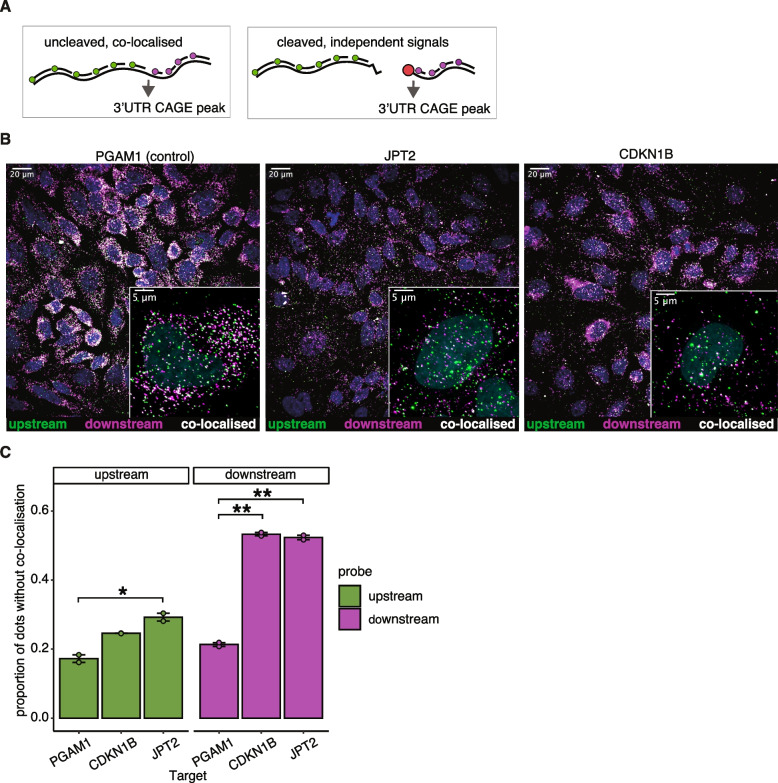
The 3' untranslated region (3'UTR) plays a crucial role in determining mRNA stability, localisation, translation and degradation. Cap analysis of gene expression (CAGE), a method for the detection of capped 5' ends of mRNAs, additionally reveals a large number of apparently 5' capped RNAs derived from locations within the body of the transcript, including 3'UTRs. Here, we provide direct evidence that these 3'UTR-derived RNAs are indeed capped and widespread in mammalian cells. By using a combination of AGO2 enhanced individual nucleotide resolution UV crosslinking and immunoprecipitation (eiCLIP) and CAGE following siRNA treatment, we find that these 3'UTR-derived RNAs likely originate from AGO2-binding sites, and most often occur at locations with G-rich motifs bound by the RNA-binding protein UPF1. High-resolution imaging and long-read sequencing analysis validate several 3'UTR-derived RNAs, showcase their variable abundance and show that they may not co-localise with the parental mRNAs. Taken together, we provide new insights into the origin and prevalence of 3'UTR-derived RNAs, show the utility of CAGE-seq for their genome-wide detection and provide a rich dataset for exploring new biology of a poorly understood new class of RNAs.

Keywords: 3′UTR; 3′UTR-derived RNA; AGO2; CAGE; Capping; G-rich; Subcellular localisation; UPF1.


Conflict of interest statement

The authors declare no competing interests.

Figures

Fig. 1
Fig. 1
CAGE-seq identifies non-promoter associated capped 3′UTR-derived RNAs. A Top: Schematic representation of CAGE signals’ position across different transcript regions. Bottom: Bars indicate the proportion of total 5′ CAGE read positions per transcript region identified in CAGE-seq libraries of K562 and HeLa samples with two biological replicates each (rep1/2), provided by ENCODE (Additional file 2: Table S1—ENCSR000CJN and ENCSR000CJJ). B Top: Plot of the normalised coverage of the 5′ ends of forward paired-end reads (yellow lines) and 3′ ends of reverse paired-end reads (blue lines) of RNA-seq relative to 3′UTR CAGE peaks in K562 cells (Additional file 2: Table S1—ENCSR545DKY). Bottom: Schematic representation of paired-end read positioning. Forward and reversed paired-end reads are presented in yellow and blue, respectively, with the intensity of the colour indicating each of two biological replicates. The black box represents the ends of reads that are plotted in the top graph. C RT-qPCR data of gene expression ratios using primers amplifying regions immediately upstream (5′C) and downstream (3′C) of the 3′UTR CAGE peak, except for SLC38A2 whose 3′ cleavage site results in uncapped downstream fragment. Data is presented as a fold change of samples (six replicates) treated with TerminatorTM 5′-Phosphate-Dependent Exonuclease (TEX), which degrades 5′ monophosphate RNAs, versus non-treated (NT). Each dot represents the value of an independent biological replicate. D Long-read CAGE data (Additional file 2: Table S1—E-MTAB-14500) showing 3′ UTR-derived RNAs from CCN1 (above) and CDKN1B (below). Nanoblot plots (left) showing the range of read lengths at these genomic loci from two biological replicates in cortical neurons differentiated from induced pluripotent stem cells (rep1 and rep2), with long-read CAGE reads originating near the TSS (purple arrowhead) and those originating near the HeLa and K562 3′UTR CAGE peaks (green arrowhead) indicated. Genome browser visualisation (right) of the reads grouped and coloured in the same manner: 1_TSS (purple) originating near the TSS; 2_UTR (green) originating near the HeLa and K562 3′ UTR CAGE peaks and 3_OTHER (orange) originated at other sites
Fig. 2
Fig. 2
5′ ends of 3′UTR-derived RNAs are enriched in G-rich motifs and strong secondary structures and flanked by UPF1 binding sites. A Sequence logos around HeLa cells’ CAGE peaks across different transcript regions. B The 75-nt region centred on HeLa cells’ CAGE peaks at different transcript regions was used to calculate pairing probability with the RNAfold program, and the average pairing probability of each nucleotide is shown for the 50-nt region around CAGE peaks. C Enrichment of eCLIP cross-linking clusters surrounding 3′UTR CAGE peaks from 80 different RBP samples (right-hand side panel) in K562 cells from the ENCODE database (Additional file 2: Table S1—all eCLIP samples) using sum of log2 ratios of crosslink enrichments. The red line represents the threshold of top 10 RBP targets which are presented in detail in the left-hand side panel. D RNA-map [32] showing normalised density of UPF1 crosslink sites (Additional file 2: Table S1—ENCSR456ASB) relative to 3′UTR CAGE peaks (blue, UPF1) and random positions of the same 3′UTRs as control (grey, UPF1-control) in K562 cells
Fig. 3
Fig. 3
Capping at small interfering RNAs (siRNAs) target sites. A Enrichment of 5′ CAGE reads relative to 5′ sites of small interfering RNAs in TC-YIK cells (Additional file 2: Table S1—siRNA-KD CAGE [47]) transfected with siRNAs targeting 20 different mRNAs (with IDs indicated on the left-hand side of the bottom graph) and merged control samples (control). The heatmap represents log2 of read counts, normalised by the mean of all counts within 200 nts of the targeting site. B, C Enrichment of 5′ CAGE reads relative to the correspondent dominant transcription start sites (TSS) (left-hand side panels) and to 5′ end of the ISL1 mRNA sequence targeted by the siRNA (right-hand side panels) in samples treated with an siRNA targeting ISL1 (C, siRNA-ISL1) or with non-targeting siRNA controls (B, control siRNAs). Three biological replicates are shown per treatment. Visual representations of the capped, full-length ISL1 mRNA in the absence of ISL1-targeting siRNAs (B, control siRNAs) versus both the capped, full-length and the capped, cleaved fragment in the presence of ISL1-targeting siRNAs (C, siRNA-ISL1), are shown below the correspondent panels. D RNA-map [32] showing normalised density of eiCLIP-AGO2 crosslink sites relative to 3′UTR CAGE peaks in HeLa cells (Additional file 2: Table S1—E-MTAB-12945)
Fig. 4
Fig. 4
Capped 3′UTR fragments of CDKN1B and JPT2 transcripts do not co-localise with the parental mRNAs. A Schematic representation of probe design for HCR-FISH microscopy to separate regions upstream (green) and downstream (purple) of the 3′UTR CAGE sites as cleaved, independent signals and uncleaved, co-localised signals. B Representative examples of HCR-FISH images for PGAM1 (control), JPT2 and CDKN1B. Independent signal from upstream probes is shown in green and signal from downstream probes is shown in purple, with colocalising signals appearing in white. C Proportion of independent signals for each upstream or downstream probe. Independent signals are those without a detected colocalising signal from the opposing probset. Error bars represent standard error. Significance was determined using pairwise Welch t-tests. *p (adjusted) < 0.05, **p < 0.005

References

    1. Ramanathan A, Robb GB, Chan S-H. mRNA capping: biological functions and applications. Nucleic Acids Res. 2016;44(16):7511–26. - PMC - PubMed
    1. Otsuka Y, Kedersha NL, Schoenberg DR. Identification of a cytoplasmic complex that adds a cap onto 5’-monophosphate RNA. Mol Cell Biol. 2009;29(8):2155–67. - PMC - PubMed
    1. Mukherjee C, Bakthavachalu B, Schoenberg DR. The cytoplasmic capping complex assembles on adapter protein nck1 bound to the proline-rich C-terminus of mammalian capping enzyme. PLoS Biol. 2014;12(8):e1001933. - PMC - PubMed
    1. Hestand MS, Klingenhoff A, Scherf M, Ariyurek Y, Ramos Y, van Workum W, et al. Tissue-specific transcript annotation and expression profiling with complementary next-generation sequencing technologies. Nucleic Acids Res. 2010;38(16):e165. - PMC - PubMed
    1. Naeli P, Winter T, Hackett AP, Alboushi L, Jafarnejad SM. The intricate balance between microRNA-induced mRNA decay and translational repression. FEBS J. 2023;290(10):2508–24. - PubMed

LinkOut - more resources