Review
. 2024 Nov-Dec;16(6):e2007.
doi: 10.1002/wnan.2007.

Nanobubble Contrast Enhanced Ultrasound Imaging: A Review

Affiliations
Review

Nanobubble Contrast Enhanced Ultrasound Imaging: A Review

Dana Wegierak et al. Wiley Interdiscip Rev Nanomed Nanobiotechnol. 2024 Nov-Dec.

Abstract

Contrast-enhanced ultrasound is currently used worldwide with clinical indications in cardiology and radiology, and it continues to evolve and develop through innovative technological advancements. Clinically utilized contrast agents for ultrasound consist of hydrophobic gas microbubbles stabilized with a biocompatible shell. These agents are used commonly in echocardiography, with emerging applications in cancer diagnosis and therapy. Microbubbles are a blood pool agent with diameters between 1 and 10 μm, which precludes their use in other extravascular applications. To expand the potential use of contrast-enhanced ultrasound beyond intravascular applications, sub-micron agents, often called nanobubbles or ultra-fine bubbles, have recently emerged as a promising tool. Combining the principles of ultrasound imaging with the unique properties of nanobubbles (high concentration and small size), recent work has established their imaging potential. Contrast-enhanced ultrasound imaging using these agents continues to gain traction, with new studies establishing novel imaging applications. We highlight the recent achievements in nonlinear nanobubble contrast imaging, including a discussion on nanobubble formulations and their acoustic characteristics. Ultrasound imaging with nanobubbles is still in its early stages, but it has shown great potential in preclinical research and animal studies. We highlight unexplored areas of research where the capabilities of nanobubbles may offer new advantages. As technology advances, this technique may find applications in various areas of medicine, including cancer detection and treatment, cardiovascular imaging, and drug delivery.

Keywords: contrast; microbubbles; nanobubbles; nonlinear; ultrasound.


Conflict of interest statement

The authors declare no conflicts of interest.

Figures

FIGURE 1
FIGURE 1
Diagram comparing the dimensions of a typical microbubble, to a nanobubble and a typical gas vesicle. Made with Biorender.
FIGURE 2
FIGURE 2
Coulter counter (Multisizer 4, Beckman Coulter Brea, CA, USA; 30‐μm aperture tube, 100‐μL volumetric setting; 0.6–18 μm) size distribution measurements for (a) Definity, (b) MicroMarker. Mean number density (histogram, shaded) and volume‐weighted size distribution (solid line) are plotted versus particle diameter. Reproduced from Raymond et al. (2013). (c) Number‐weighted size distribution measurements (Multisizer 3, 30‐μm aperture tube, measurement range 0.7–18 μm, Beckman Coulter, Fullerton, CA, USA) of various commercially available contrast agents (Lumason‐blue, Definity‐yellow; Optison‐green) and two in‐house prepared agents before (BG8758‐black) and after (MSB4) size isolation. Reproduced from Helbert et al. (2020) with permissions requested.
FIGURE 3
FIGURE 3
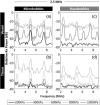
Representative relative received (Rx) power spectra at 2.5 MHz (a)–(d) transmit frequency over a range in pressures. The top row depicts agent behavior in the vessel phantom, and the bottom row illustrates received spectra for agents embedded in the tissue phantom. Columns alternate between microbubble and nanobubble samples. Data are averaged over the first five ultrasound pulses. Reproduced from Pellow et al. (2018) with permissions pending.
FIGURE 4
FIGURE 4
Contrast enhancement of polydisperse NB solution with (a) flexible and, (b) stiff shells, and of filtered monodisperse NB solution with (c) flexible, and (d) stiff shells relative to the agarose phantom for different PNPs. Arrows mark the pressure threshold (P t) of sudden signal enhancements exhibited by monodisperse populations. Representative ultrasound contrast harmonic imaging mode images of solutions of filtered monodisperse: Flexible and stiff shell NBs for different PNPs corresponding to (c) and (d). Adapted from Jafari Sojahrood et al. (2021) with permissions requested.
FIGURE 5
FIGURE 5
Demonstration of nanobubble (NB) use in contrast‐enhanced ultrasound (CEUS) imaging. (a) Adapted and reproduced with permissions requested (W. B. Cai et al. 2015). (a.i) Ultrasound‐enhanced images of subcutaneous tumors before and after caudal vein injection of (top) NBs and (bottom) SonoVue at 10 s, 30 s, 2 min, and 5 min. (a.ii) Time‐intensity histogram of the tumor gray‐scale enhancement after caudal vein injection with NBs (red) and SonoVue (blue). **p < 0.01 comparison of NBs and SonoVue at the same time point. (b) Adapted and reproduced with permissions requested (Peyman et al. 2016). (i) High Frequency Ultrasound (US) images of mouse aorta after bolus delivery of (left to right) mixed population bubbles, NBs, or MBs via tail vein catheter at 0.6 mL min−1. The aorta was identified in each mouse (circled). (ii) Size distribution of NBs as determined by particle tracking. Inset: TEM image of NBs. (c) Adapted and reproduced with permissions requested (Wei et al. 2022). (i) US imaging of gas vesicles (GVs) and lipid MBs in MB49‐tumor: a B‐mode and nonlinear contrast images of GVs and MBs in 15 min after tail injection; (ii) time–intensity curves of GVs and MBs perfused into the tumor tissue.

References

    1. Abenojar, E. C. , Bederman I., Leon A. C. d., et al. 2020. “Theoretical and Experimental Gas Volume Quantification of Micro‐ and Nanobubble Ultrasound Contrast Agents.” Pharmaceutics 12, no. 3: 208. 10.3390/pharmaceutics12030208. - DOI - PMC - PubMed
    1. Abenojar, E. C. , Nittayacharn P., de Leon A. C., et al. 2019. “Effect of Bubble Concentration on the In Vitro and In Vivo Performance of Highly Stable Lipid Shell‐Stabilized Micro‐ and Nanoscale Ultrasound Contrast Agents.” Langmuir 35, no. 31: 10192–10202. 10.1021/acs.langmuir.9b00462. - DOI - PubMed
    1. Alheshibri, M. , and Craig V. S. J.. 2018. “Differentiating Between Nanoparticles and Nanobubbles by Evaluation of the Compressibility and Density of Nanoparticles.” Journal of Physical Chemistry C 122, no. 38: 21998–22007. 10.1021/acs.jpcc.8b07174. - DOI
    1. Alheshibri, M. , Qian J., Jehannin M., and Craig V. S. J.. 2016. “A History of Nanobubbles.” Langmuir 32, no. 43: 11086–11100. 10.1021/acs.langmuir.6b02489. - DOI - PubMed
    1. Aliabouzar, M. , Kripfgans O. D., Brian Fowlkes J., and Fabiilli M. L.. 2023. “Bubble Nucleation and Dynamics in Acoustic Droplet Vaporization: A Review of Concepts, Applications, and New Directions.” Zeitschrift für Medizinische Physik 33, no. 3: 387–406. 10.1016/j.zemedi.2023.01.004. - DOI - PMC - PubMed

Publication types

LinkOut - more resources