. 2024 Oct 24:15:1480041.
doi: 10.3389/fimmu.2024.1480041. eCollection 2024.

Circulating mucosal-like IgA responses increase with severity of Puumala orthohantavirus-caused hemorrhagic fever with renal syndrome

Affiliations

Circulating mucosal-like IgA responses increase with severity of Puumala orthohantavirus-caused hemorrhagic fever with renal syndrome

Luz E Cabrera et al. Front Immunol. .

Abstract

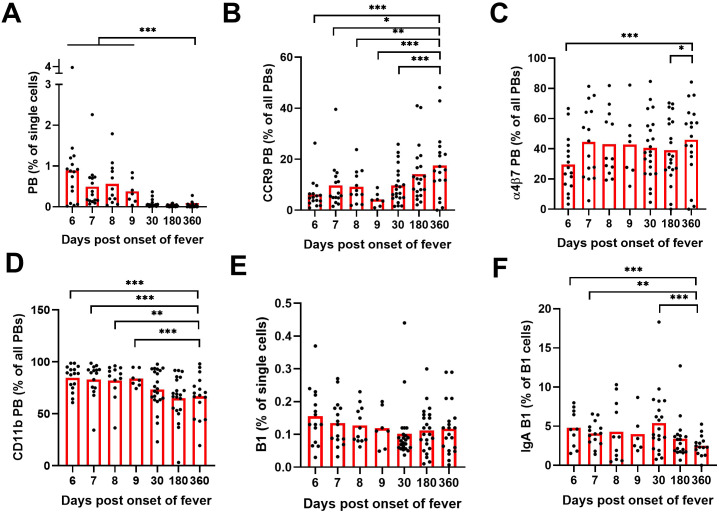
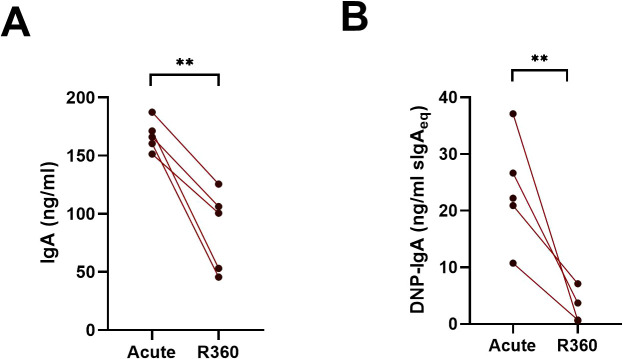
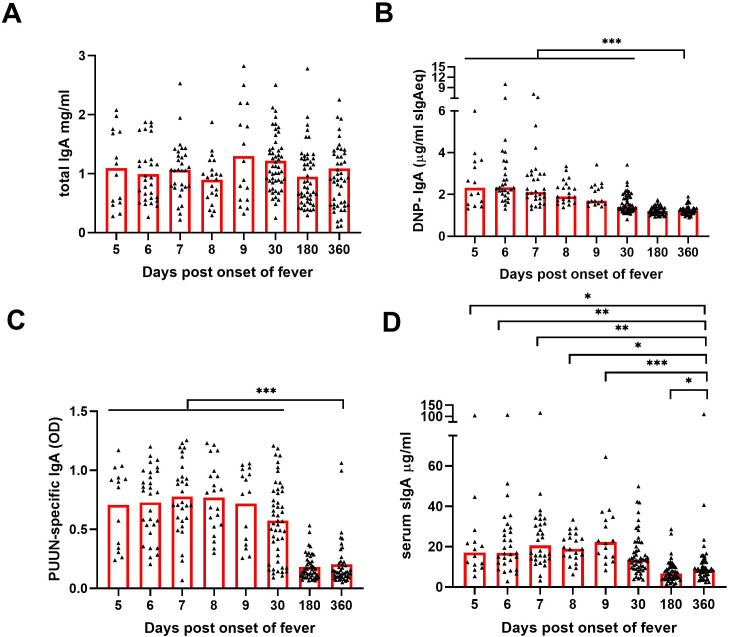
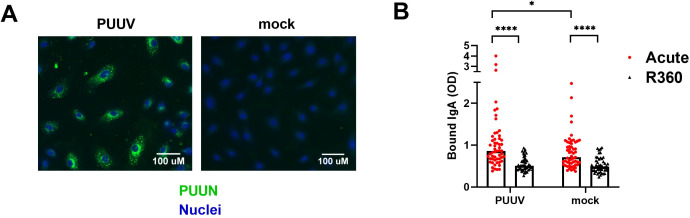
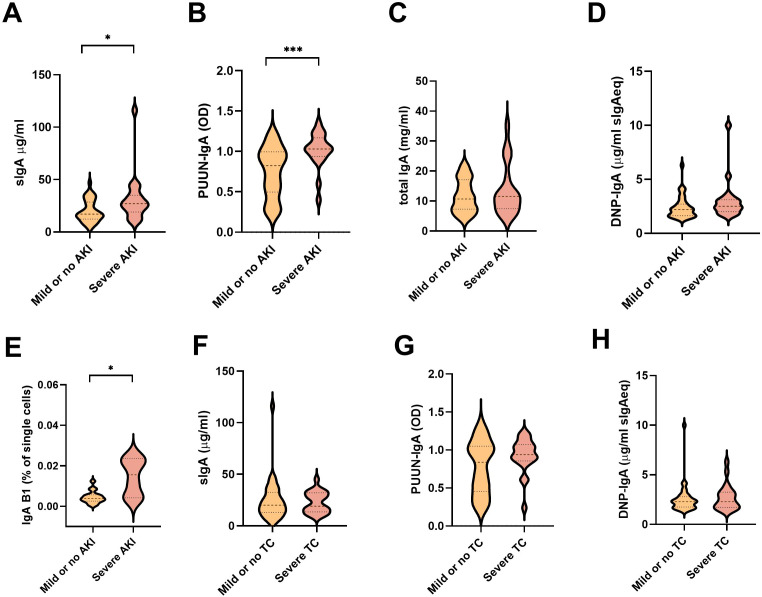
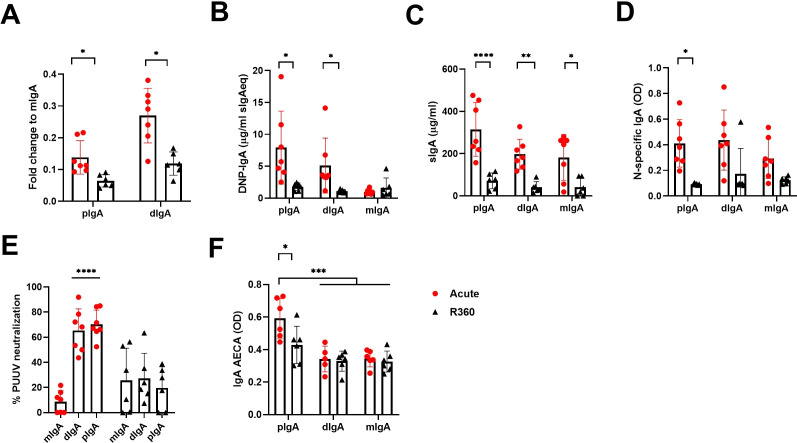
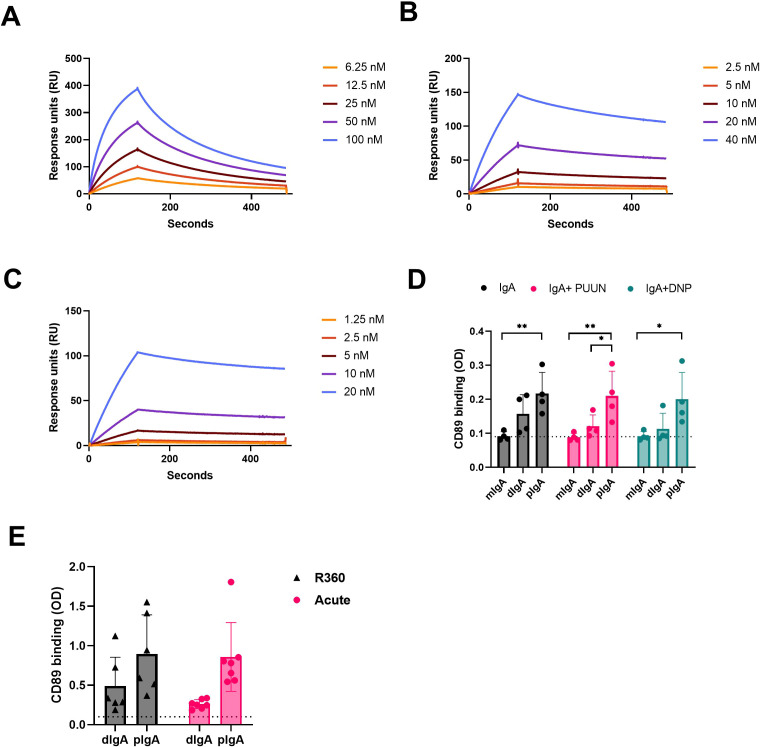
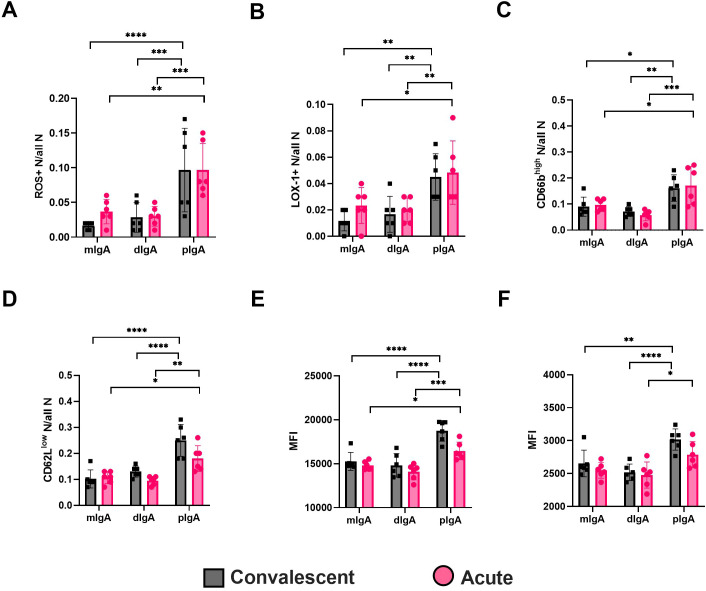
Old World Orthohantaviruses cause hemorrhagic fever with renal syndrome (HFRS) characterized by increased vascular permeability and acute kidney injury (AKI). Despite the systemic nature of the disease, the virus enters humans through inhalation and therefore initially encounters the immunoglobulin class A (IgA) dominated mucosal immune system. Herein, we characterized systemic IgA responses and their potential relationship to the mucosal immune activation by examining blood samples obtained from patients hospitalized due to acute Puumala orthohantavirus infection. Our findings reveal increased frequencies of putative IgA-expressing circulating mucosal-associated B1 cells and plasmablasts, as well as elevated levels of polyreactive, polymeric, virus-specific and secretory IgA in the acute stage of the disease. Importantly, the levels of circulating virus-specific and secretory IgA, as well as the putative IgA+ B1 cells, increased with the severity of AKI. Furthermore, circulating polymeric IgA displayed enhanced effector functions by forming stable complexes with the IgA receptor CD89 and induced pro-inflammatory neutrophil responses. These results suggest that excessive levels of circulating mucosal-like IgA might serve as a biomarker for HFRS disease progression.

Keywords: HFRS; IgA; hantavirus; mucosal immunity; neutrophils.


Conflict of interest statement

The authors declare that the research was conducted in the absence of any commercial or financial relationships that could be construed as a potential conflict of interest.

Figures

Figure 1
Figure 1
Multiparameter flow cytometric analysis of PBs and B1 cells in peripheral blood of PUUV-HFRS. PBMCs from hospitalized (days 6-9 after onset of fever, n = 7-16 per day), two weeks after discharge (~30 days post onset fever, n = 23) and recovered (180 and 360 days post-onset of fever, n =21-23) patients (total n = 25) were stained with a panel of fluorochrome-labeled antibodies and live/dead green viability stain. Stained cells were analyzed by flow cytometry. (A) The frequencies of plasmablasts (PBs) in all single cells. (B) The frequencies of PBs expressing cell surface CCR9. (C) The frequencies of PBs expressing cell surface integrin α4β7. (D) The frequencies of PBs expressing cell surface integrin CD11b. (E) The frequencies of B1 cells in all single cells. (F) The frequencies of surface IgA expressing B1 cells out of all B1 cells. Statistical significance at each time point as compared to recovery at 360 days post-onset of fever were assessed by generalized estimating equations. ***, ** and * indicate p-values <0.001, < 0.01 and < 0.05, respectively.
Figure 2
Figure 2
Cells in the peripheral blood spontaneously produce polyreactive IgA during acute PUUV-HFRS. PBMCs isolated from acute (1st day of hospitalization, n = 5) or recovery (360 days post-onset of fever; R360, n = 5) of PUUV-HFRS were cultured for 6 days and supernatants analyzed for total IgA (A) and DNP-reactive IgA (B) by ELISA. Salivary sIgA was used as standard in (B) and concentrations reported as sIgA equivalent. The lines connect matched data obtained from the same patient. Statistically significant differences between groups were assessed by paired samples T-test. ** indicate p-values <0.01.
Figure 3
Figure 3
Increased levels of circulating polyreactive, PUUN-specific and secretory IgA in acute PUUV-HFRS. Sequential serum samples from hospitalized (days 5-9 post onset of fever, n = 14-30 per day), two weeks after discharge (~30 days post onset fever, n = 51) and recovered (180 and 360 days post-onset of fever, n = 47-48) PUUV-HFRS patients (total n = 55) were analyzed for total IgA (A), DNP-reactive IgA (B), PUUN-specific IgA (C) as well as for secretory IgA (D) by ELISA. Statistically significant differences at each time point as compared to recovery at R360 were assessed by generalized estimating equations. OD = optical density at 450 nm. ***, ** and * indicate p-values <0.001, <0.01 and <0.05, respectively.
Figure 4
Figure 4
Circulating IgA during acute PUUV-HFRS binds microvascular endothelial cells. PUUV- or mock-infected primary blood microvascular endothelial cells (BECs) were fixed at 24 h post-inoculation and used for studying the IgA responses of acute- and recovery-phase sera. (A) An overlay of immunofluorescence for PUUN (green)- and Hoechst33342 (blue)-stained PUUV- and mock-infected BECs without the addition of patient serum. (B) Serum from acute (1st day of hospitalization, n = 55) or recovery (360 d post onset of fever, R360, n =48) PUUV-HFRS was added on PUUV- or mock-infected BECs for 1 h. After washing, cell-surface bound IgA was measured with on-cell ELISA and optical density (OD, at 450nm) recorded. Statistically significant differences between acute and recovery samples were assessed by two-way ANOVA including Tukey’s multiple comparison test. **** and * indicate p-values <0.0001 and <0.05, respectively.
Figure 5
Figure 5
Association between measured soluble IgA and IgA ASC levels with parameters of disease severity. (A–E) The PUUV-HFRS patients (n = 55) were stratified based the maximum blood creatinine levels measured during hospitalization as mild (blood creatinine ≤ 265 µmol/l = AKI stage 2 or lower, n = 36) or severe (blood creatinine > 265 µmol/l = AKI stage 3, n = 19) or (F–H) minimum thrombocyte levels as mild or no thrombocytopenia (TC, ≥ 50 * 104/µl blood, = 33) and severe TC (< 50 * 104/µl blood, n = 21). The maximum levels of sIgA (A, F), PUUN-specific IgA (B, G) DNP-reactive IgA (C, H), total IgA (D), and IgA B1 cells (E) measured during hospitalization were grouped based on patient severity criteria and significant differences assessed by Mann-Whitney test. *** and * respectively indicate p-values <0.001 and <0.05.
Figure 6
Figure 6
Increased levels of circulating multimeric IgA in acute PUUV-HFRS. Total IgA was isolated from serum of acute (1st day of hospitalization, n = 7) or recovery (360 d post onset of fever, R360, n = 6) PUUV-HFRS by Peptide M followed by size –exclusion chromatography to separate polymeric, dimeric and monomeric forms of IgA. Isolated IgA fractions were analyzed for fold change of total IgA concentration compared to mIgA (A). After normalization, IgA fractions were analyzed for DNP-reactive IgA (B), sIgA (C), PUUN-specific IgA (D) and IgA AECAs (F). The neutralization of PUUV was analyzed by a microneutralization test (E). OD = optical density at 450nm. Statistically significant differences between acute and recovery samples of each fraction were assessed by two-way ANOVA including Tukey’s multiple comparison test. ****, ***, ** and * indicate p-values <0.0001, < 0.001, <0.01 and <0.05, respectively.
Figure 7
Figure 7
CD89 receptor binding kinetics of circulating mIgA, dIgA and pIgA. (A–C) Surface plasmon resonance (SPR) binding kinetics assay using Biacore T100. The IgA receptor CD89 was coated on the sensor chip surface, and different IgA fractions isolated from acute PUUV-HFRS (n = 7) were pooled in equal ratio and used at indicated concentrations: (A) monomeric IgA (mIgA), (B) dimeric IgA (dIgA) and (C) polymeric IgA (pIgA). (D) CD89 was coated on an ELISA plate, and binding of mIgA, dIgA and pIgA from acute PUUV-HFRS (n = 4) was analyzed. The binding assays were performed in the presence of 100-fold excess PUUN or DNP-albumin where indicated. (E) Comparative CD89-binding ELISA was performed with dIgA and pIgA isolated from acute (n = 7) vs. recovery (n = 6) PUUV-HFRS. Dotted lines indicate baseline optical density (OD, 450nm) levels. Statistically significant differences between acute and recovery samples of each fraction were assessed by two-way ANOVA including Tukey’s multiple comparison test. ** and * indicate p-values <0.01 and <0.05, respectively.
Figure 8
Figure 8
Circulating pIgA activates neutrophils. Neutrophils were isolated from healthy volunteers and incubated 4 h with 10 µg/ml of pIgA, dIgA and mIgA obtained from acute (n = 6) vs. recovery (n = 6) PUUV-HFRS patients as previously described. Reactive oxygen species (ROS) generation (A) and cell surface expressions of LOX-1 (B), CD66b (C), CD62L (D), CD11b (E) and HLA-DR (F) were assessed by multicolor flow cytometry. The frequency of gated positive cells (A–C), negative cells (D) or median fluorescence intensity (MFI) of all cells (E, F) were reported. Statistically significant differences between acute and recovery samples of each fraction were assessed by two-way ANOVA including Tukey’s multiple comparison test. ****, ***, ** and * respectively indicate p-values <0.0001, <0.001, <0.01 and <0.05, respectively. The presented data is representative of three similarly performed experiments.

Similar articles

Cited by

References

    1. Vial PA, Ferrés M, Vial C, Klingström J, Ahlm C, López R, et al. . Hantavirus in humans: a review of clinical aspects and management. Lancet Infect Dis. (2023) 23:e371–82. doi: 10.1016/S1473-3099(23)00128-7 - DOI - PubMed
    1. Vaheri A, Smura T, Vauhkonen H, Hepojoki J, Sironen T, Strandin T, et al. . Puumala hantavirus infections show extensive variation in clinical outcome. Viruses. (2023) 15 (3):805. doi: 10.3390/v15030805 - DOI - PMC - PubMed
    1. Mackow ER, Gavrilovskaya IN. Hantavirus regulation of endothelial cell functions. Thromb Haemost. (2009) 102:1030–41. doi: 10.1160/TH09-09-0640 - DOI - PubMed
    1. Hepojoki J, Vaheri A, Strandin T. The fundamental role of endothelial cells in hantavirus pathogenesis. Front Microbiol. (2014) 5:727. doi: 10.3389/fmicb.2014.00727 - DOI - PMC - PubMed
    1. Klingström J, Smed-Sörensen A, Maleki KT, Solà-Riera C, Ahlm C, Björkström NK, et al. . Innate and adaptive immune responses against human Puumala virus infection: immunopathogenesis and suggestions for novel treatment strategies for severe hantavirus-associated syndromes. J Intern Med. (2019) 285:510–23. doi: 10.1111/joim.12876 - DOI - PMC - PubMed

LinkOut - more resources