. 2024 Nov 3:17:4149-4166.
doi: 10.2147/DMSO.S492099. eCollection 2024.

White Matter Function and Network Abnormalities in Patients with Diabetic Retinopathy

Affiliations

White Matter Function and Network Abnormalities in Patients with Diabetic Retinopathy

Yu-Lin Zhong et al. Diabetes Metab Syndr Obes. .

Abstract

Background: This study aims to explore changes in white matter function and network connectivity in individuals with DR.

Methods: This study included 46 patients with DR and 43 age- and gender-matched healthy control (HC) participants were enrolled in the study. The aim was to investigate inter-group differences in white matter (WM) function and to analyze changes in the WM network among DR patients.

Results: Increased degree centrality (DC) values were observed in the middle cerebellar peduncle and genu of the corpus callosum, while higher fractional amplitude of low-frequency fluctuations (fALFF) values were found in the left superior corona radiata, right anterior corona radiata, and right superior longitudinal fasciculus. Conversely, reduced regional homogeneity (ReHo) values were noted in the left posterior thalamic radiation among patients with DR compared to HC, with statistical correction applied The SVM classification accuracy for distinguishing between DR and HC patients based on WM measures indicated values of 81.52%, 80.43%, and 89.13% for DC, fALFF, and ReHo, respectively, with respective area under the curve (AUC) values of 0.87, 0.85, and 0.93. Furthermore, alterations were detected within specific brain regions including the body of corpus callosum (BCC), splenium of corpus callosum (SCC), genu of corpus callosum (GCC), left posterior thalamic radiation (PTR), right anterior corona radiata (ACR), and right posterior corona radiata (PCR) in the DR group compared to HCs, with an intra-network decrease in connectivity. Interestingly, the left superior longitudinal fasciculus (SLF) within the DR group exhibited an intra-network increase compared to the HC group.

Conclusion: DR exhibited abnormal white matter functional alterations, particularly affecting the fiber pathways linking the visual network to the sensory-motor network.

Keywords: DC; ICA; ReHo; degree centrality; diabetic retinopathy; fALFF; fractional amplitude of low-frequency fluctuation; independent component analysis; regional homogeneity.


Conflict of interest statement

The authors declare that they have no conflict of interest in this work.

Figures

Figure 1
Figure 1
This flowchart outlines the preprocessing, statistical analysis, and machine learning procedures conducted in this study. Initially, functional and structural brain images of the subjects were extracted separately. Subsequently, white matter functional images were computed, with preservation of over 90% of them for the creation of white matter templates. Following this, one-sample and two-sample tests for Degree Centrality (DC), fractional Amplitude of Low-Frequency Fluctuations (fALFF), and Regional Homogeneity (ReHo) in diabetic retinopathy (DR) and healthy control (HC) groups were performed based on the white matter template. Machine learning techniques were then applied. In parallel, the smoothed white matter images underwent independent component analysis (ICA). An initial selection of 20 independent components was made, with 8 components chosen for further analysis. The remaining independent components underwent intra- and inter-network evaluations.
Figure 2
Figure 2
Results of one-sample t-tests for white matter DC signal values, white matter fALFF signal values and white matter ReHo signal values in DR and HC. (A) Results of white matter DC signal values in DR patients. (B) White matter DC signal value results in HC group. (C) Results of white matter fALFF signal values in DR patients. (D) Results of white matter fALFF signal values in HC group. (E) Results of white matter ReHo signal values in DR patients. (F) Results of white matter ReHo signal values in HC group.
Figure 3
Figure 3
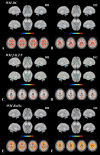
Two-sample t-test results of white matter DC signal values, white matter fALFF signal values and white matter ReHo signal values in DR patients and HC group. (A and B) Results of the white matter DC values. (C and D) Results of the white matter fALFF values. (E and F) Results of the white matter ReHo values.
Figure 4
Figure 4
Machine classification results based on (A and B) white matter DC signal values, (C and D) white matter fALFF signal values and (E and F) white matter ReHo signal values. The left column shows the ROC curve of the SVM classifier with AUC values of 0.87, 0.85 and 0.93, and the right column of images shows a 10-fold in the class 1 (DR group) and class 2 (HC group), respectively.
Figure 5
Figure 5
Classical spatial patterns for each white matter bundles in DR and HC groups, including IC06(SCC), IC07(UF1), IC08(PTR), IC10(ACR1), IC12(ACR2), IC13(ACR3), IC15(UF2), IC19(SLF). Scale represents T-values with a range of 1–24.8 in each white matter bundles.
Figure 6
Figure 6
The DR group had differential white matter networks compared to the HC group. The warm colors indicate increased strength of functional connectivity and the cold colors indicate reduced strength of functional connectivity. In the diabetic retinopathy (DR) group, there was an intra-network decrease in the body of the corpus callosum (BCC) depicted in IC06 (A), the splenium of the corpus callosum (SCC) represented by IC08 (B), the genu of the corpus callosum (GCC) and the left posterior thalamic radiation (PTR) shown in IC12 (C), the right anterior Corona radiata (ACR) displayed in IC13 (D), and the right posterior corona radiata (PCR) illustrated in IC19 (E) compared to the healthy control (HC) group. Conversely, the left superior longitudinal fasciculus (SLF) in the DR group exhibited an intra-network increase relative to the HC group. (two-tailed, voxel-level p < 0.01, GRF correction, cluster-level p < 0.05).
Figure 7
Figure 7
Functional connectivity matrix between all white matter networks (A), warm colors indicate positive correlations and cold colors indicate negative correlations. Differences in network functional connectivity between DR and HC groups (B) (p<0.05). DR, diabetic retinopathy; HC, healthy control.

References

    1. Antonetti DA, Klein R, Gardner TW. Diabetic Retinopathy. N Engl J Med. 2012;366:1227–1239. doi:10.1056/NEJMra1005073 - DOI - PubMed
    1. Kollias AN, Ulbig MW. Diabetic Retinopathy. Dtsch Arztebl Int. 2010;107:75–84. doi:10.3238/arztebl.2010.0075 - DOI - PMC - PubMed
    1. Teo ZL, Tham Y-C, Yu M, et al. Global prevalence of diabetic retinopathy and projection of burden through 2045: systematic review and meta-analysis. Ophthalmology. 2021;128(11):1580–1591. doi:10.1016/j.ophtha.2021.04.027 - DOI - PubMed
    1. Tan T-E, Wong TY. Diabetic retinopathy: looking forward to 2030. Front Endocrinol. 2022;13:1077669. doi:10.3389/fendo.2022.1077669 - DOI - PMC - PubMed
    1. Chai Y-H, Zhang Y-P, Qiao Y-S, et al. Association between diabetic retinopathy, brain structural abnormalities, and cognitive impairment for accumulated evidence in observational studies. Am J Ophthalmol. 2022;239:37–53. doi:10.1016/j.ajo.2022.01.011 - DOI - PubMed